Ocean optics illuminates aquatic algae
DOI: 10.1063/PT.3.5269

Oceans and lakes are full of microscopic algal particles—single cells that are 1–200 µm in size and range in concentration from several tens to millions per liter of water. Various types of macroalgae, sometimes called seaweed, are also ubiquitous in oceans and lakes. Sargassum, Ulva, giant kelp, and others live either on the ocean floor or in surface water. Both microalgae and macroalgae are important to their local ecosystems. They also affect the environment around the world and the way humans interact with the ocean. Today, satellites and the developing field of ocean optics are rapidly changing the way scientists measure algae and their interactions with the environment.
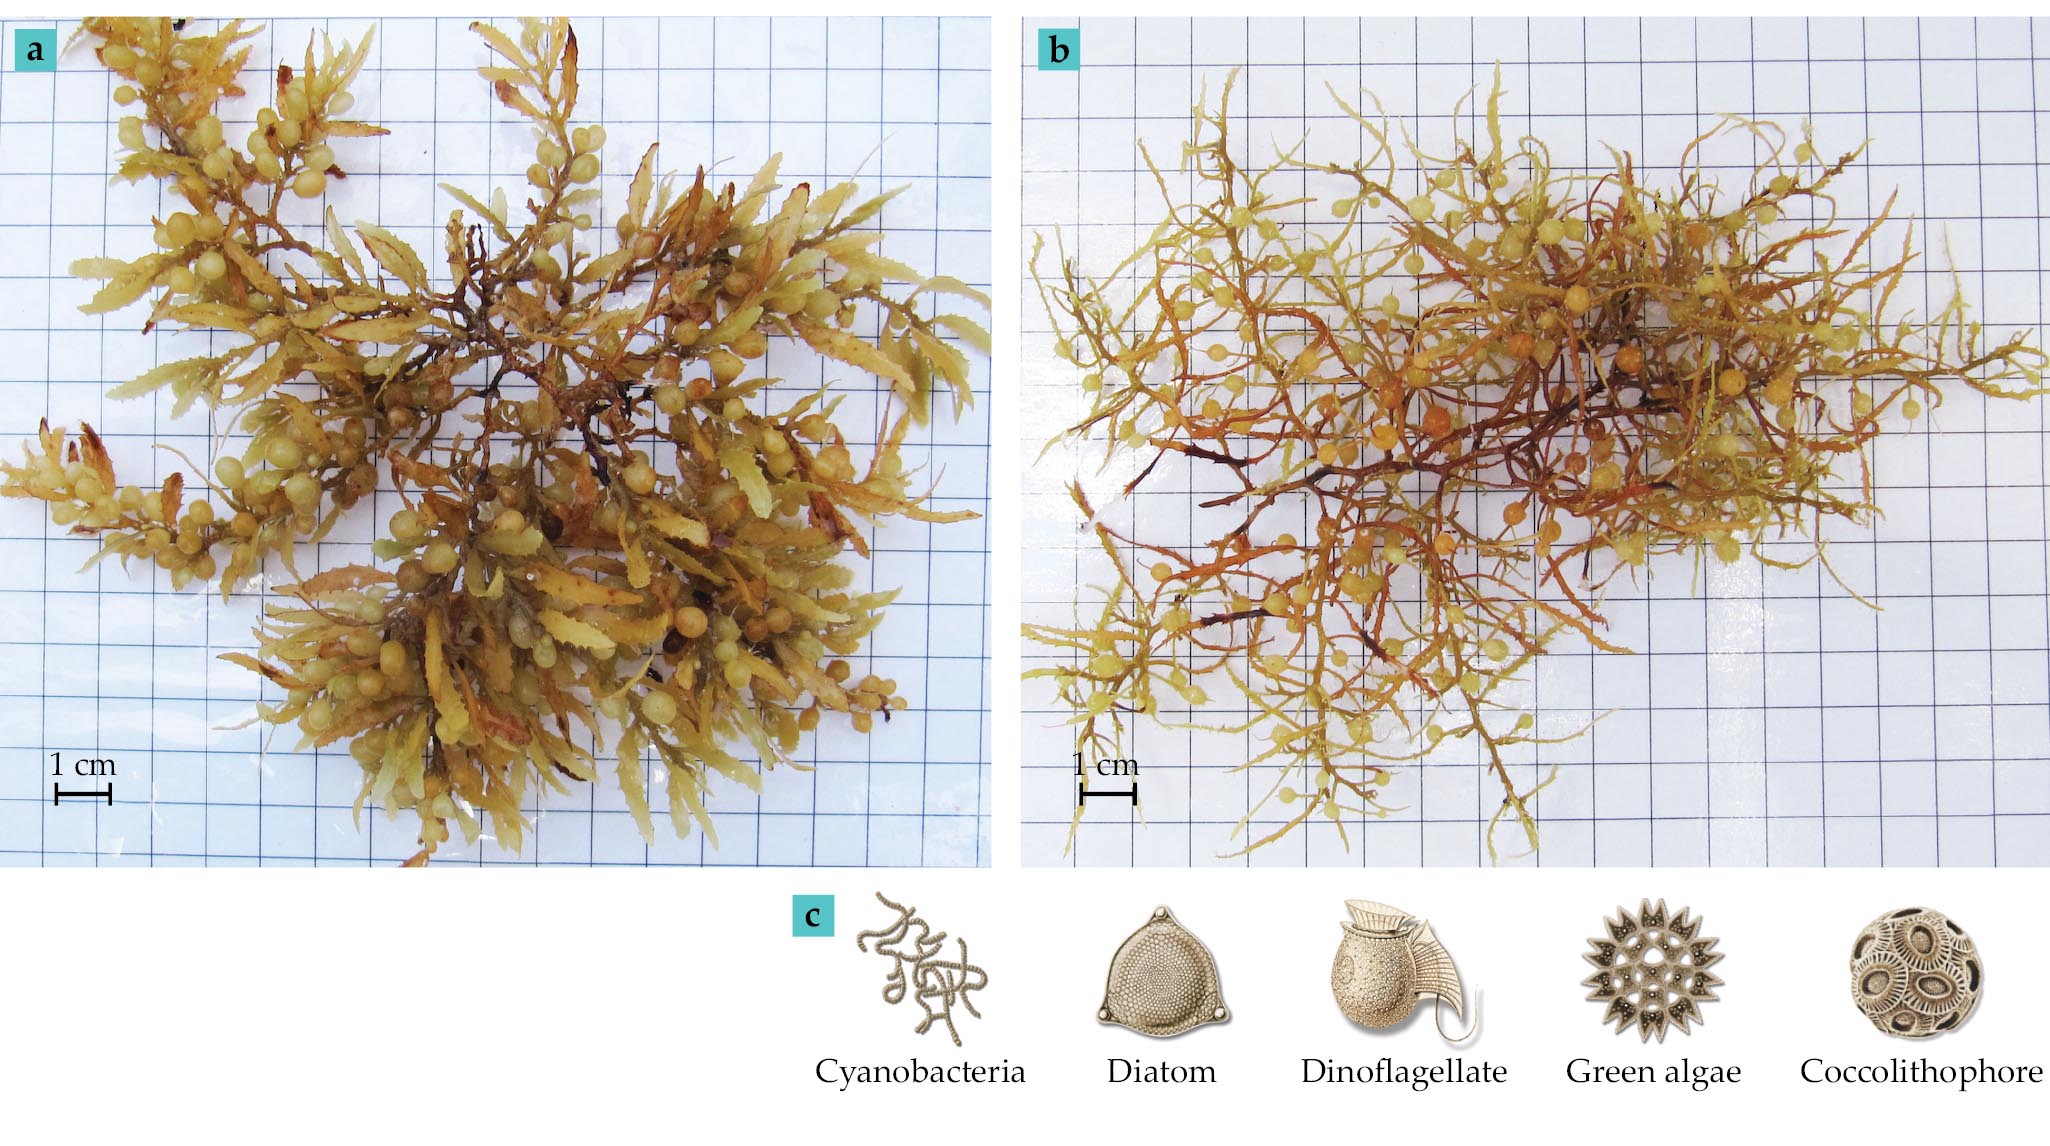
Microalgal particles vary in size, shape, and type. The most common are cyanobacteria, often called blue-green algae, and diatoms, dinoflagellates, green algae, and coccolithophores (see figure
Figure 1.

Macroalgae and microalgae. Clumps of the macroalgae Sargassum fluitans III (a) and Sargassum natans I (b) are abundant in the Atlantic Ocean. They are good habitats for aquatic life because their air bladders help them float on the ocean surface. (Images courtesy of Amy Siuda, Eckerd College.) (c) Common types of microalgae found in oceans and lakes. They are not drawn to scale or in natural colors; most are tens of micrometers in size. Each type may have hundreds of species that have different shapes than shown here. (Adapted from drawings and micrographs by Sally Bensusen, NASA EOS Project Science Office.)
Although microalgae, which are also called phytoplankton, are invisible to the human eye, the small plants still undergo photosynthesis and are the primary producers of carbon in the food chain. In fact, they are responsible for about half of the total primary production on Earth, with the other half provided by terrestrial vegetation. 1 Measuring microalgal particles, therefore, is critical to understanding their role in carbon sequestration, fisheries, and ecology.
At high concentrations, some microalgae form harmful algal blooms (HABs) that can produce toxins or deplete dissolved oxygen. They kill fish and other animals, which causes alterations of the food web and other environmental effects. HABs can also disrupt the local economy. Cyanobacterial HABs have been recurrent in Lake Erie, Lake Okeechobee, and many lakes around the world. In the Gulf of Mexico, a single but long-lasting HAB of the toxic dinoflagellate Karenia brevis in 2018 cost Florida $317 million and 2900 jobs. 2 The repercussions harm not only industries that work in the ocean, such as commercial fishing and for-hire diving operations, but also such secondary industries as tourism and real estate because people stay away from affected regions.
Among the various types of macroalgae, pelagic (open-water) Sargassum in the Atlantic Ocean is of particular importance because it serves as a critical habitat for many marine animals. Atlantic Sargassum primarily has two species, Sargassum fluitans and Sargassum natans (see figure

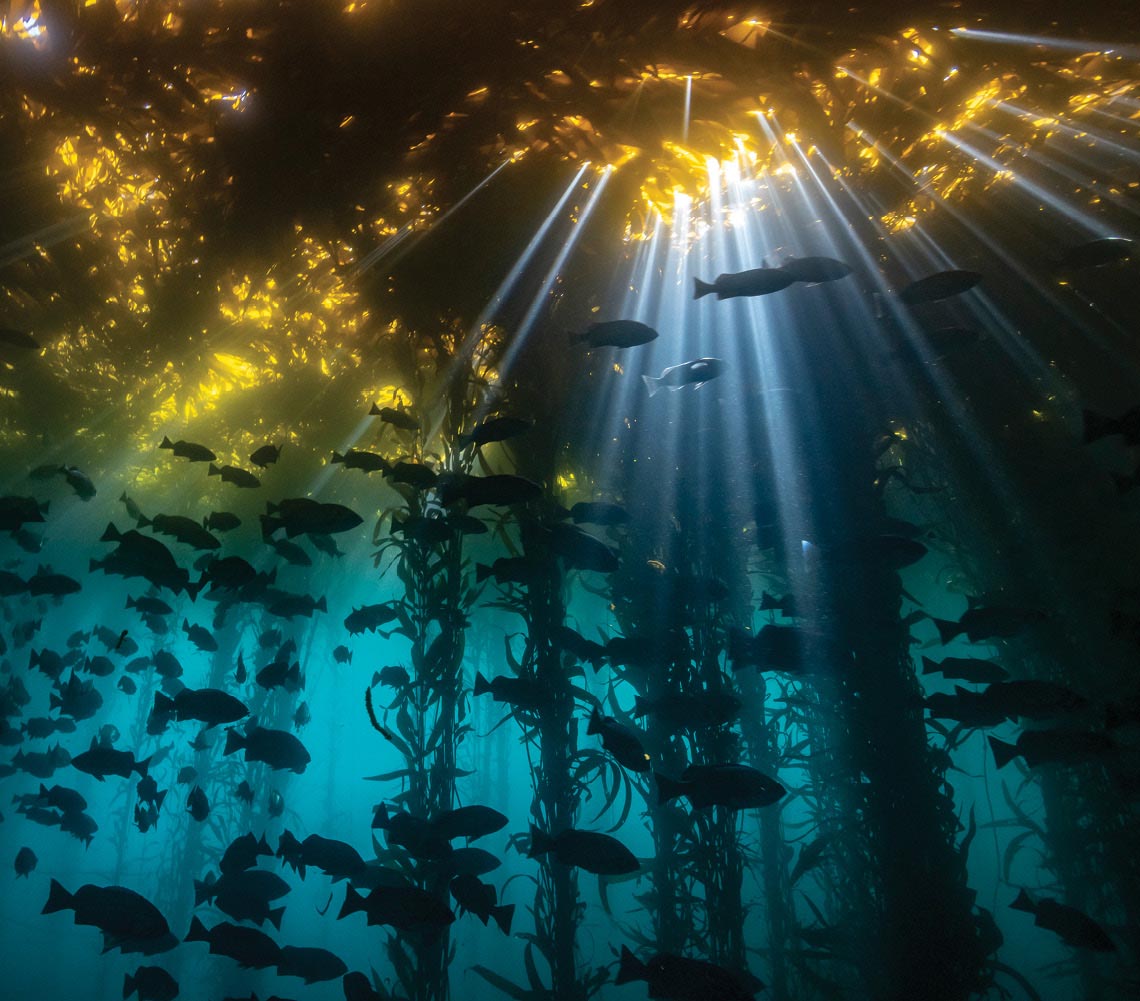
JON ANDERSON/CC BY 2.0
Measuring microalgae in the field
Traditionally, microalgal particles are collected in the field and then analyzed under a microscope to characterize their size, shape, morphology, and taxa or species. 3 Field collection techniques have been extended to flow cytometry, in which pictures of microalgal cells suspended in a flow tube are captured on a camera and analyzed by either human analysts or computer programs. Recently, DNA barcoding has also been used to identify microalgal taxa and their living environment. Although the techniques are relatively accurate, they rely on physically handling the samples. Optical instruments, on the other hand, measure the microalgal particles through nontouch techniques.
The history of optical measurements of the ocean dates back to the initial efforts in the late 19th and early 20th centuries to understand the color of the ocean and how sunlight penetrates it. The light penetration, or water transparency, is determined by the depth at which a submerged Secchi disk—divided into quadrants and colored white and black—is no longer visible to the human eye. That is called the Secchi depth. 4 While relatively accurate, the handheld instruments measure only one property of the ocean water. To describe other optical properties, researchers needed to develop digital instruments that can accurately measure them.
Such requirements drove advances in ocean optics: the study of how light interacts with water and its constituents and how such interactions can be measured and interpreted. It employs radiative transfer theory, based on physical principles, to describe the optical properties of the ocean and its constituents and how light interacts with the atmospheric gases and particles (that is, aerosols).
5
,
6
A combination of physics and oceanography, ocean optics made its formal debut as an interdisciplinary science between the 1950s and the 1980s, when its pioneers systematically studied how natural light is absorbed, scattered, and fluoresced by marine particles and dissolved matter
7
,
8
(see figure
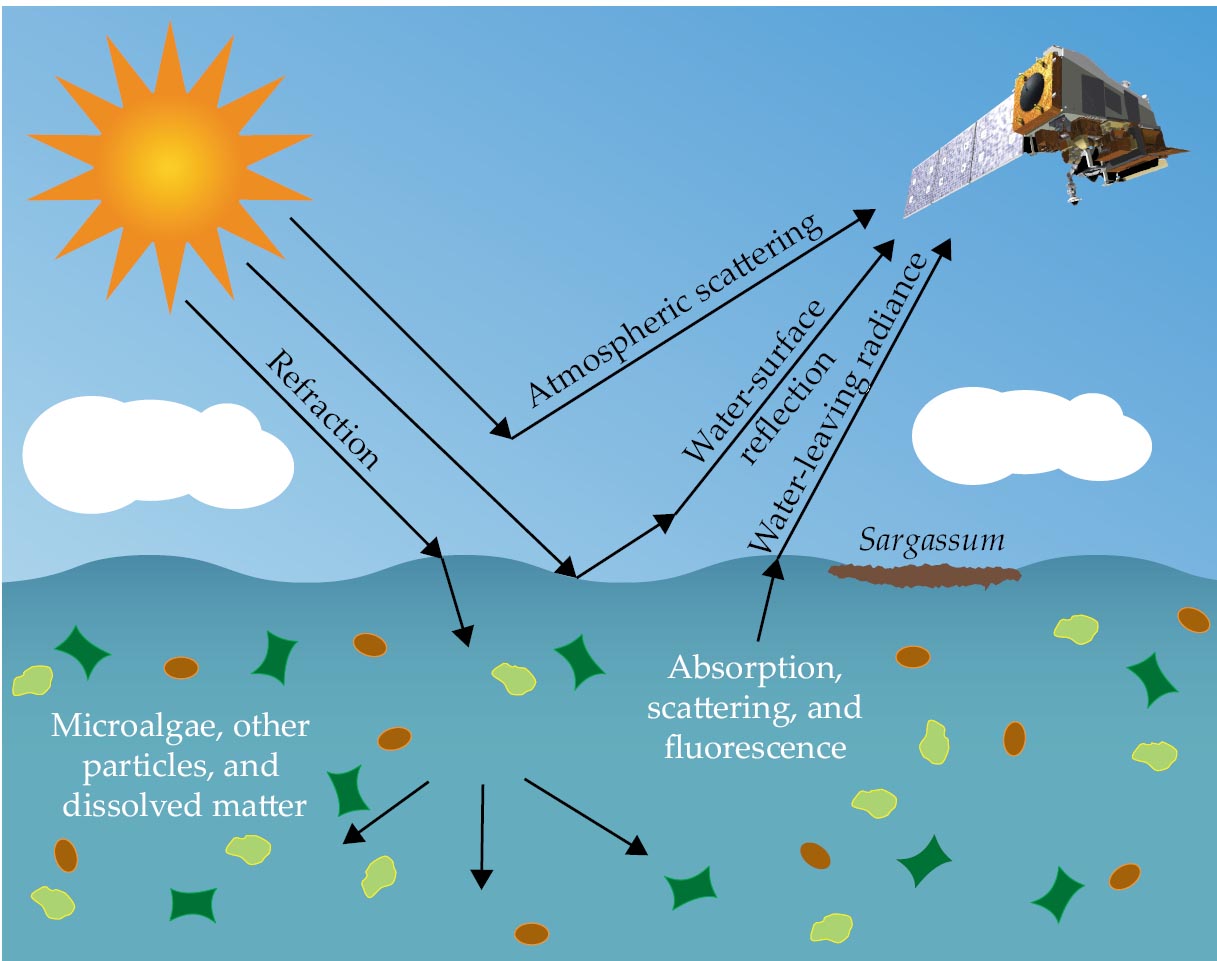
Figure 2.

Sunlight interacts with the atmosphere, the water, particles, and dissolved matter in the water before it is captured by a satellite. In remote sensing of ocean color, the atmosphere’s contributions are corrected for, resulting in spectral surface reflectance that can be used to characterize microalgae and macroalgae both below and on the surface. (Image adapted from a diagram by Meng Qi; the Joint Polar Satellite System-1 adapted from an illustration by Ball Aerospace.)
Advances in ocean optics have led to new methods for measuring various microalgal particles. Early on, the optical properties (absorption and scattering) of microalgae and non-algae particles were measured in both the field and the laboratory using shining tubes, filter pads, and other instrumentation. 9 For example, the concentrations of chlorophyll a—the primary pigment used in photosynthesis—and other pigments were determined using fluorometers because once the microalgae absorb light at one wavelength, they can emit light at a longer wavelength.
Today, more sophisticated instruments and methods are available to measure all those properties. One such way is through high-performance liquid chromatography (HPLC). Different types of microalgae have different pigment compositions, 10 and each pigment has its own absorption spectrum, which is known a priori. The total pigment absorption spectrum can thus be decomposed into individual pigment absorption spectra from which the type and size of the microalgae can be estimated. For example, the freshwater cyanobacterium Microcystis aeruginosa (responsible for most freshwater HABs) can often be identified through its phycocyanin pigment, which contributes to its blue-green color, and the saltwater cyanobacterium Trichodesmium sp. can be identified through its phycourobilin, phycoerythrobilin, and phycocyanin pigments.
Alternatively, the ratio of microalgal backscattering to absorption can be used as an index to separate otherwise similar microalgae. That technique was employed to differentiate the toxic dinoflagellate Karenia brevis (responsible for most HABs producing red tides in the Gulf of Mexico) from diatoms because the former has a lower backscattering efficiency. 11 More importantly, surface spectral reflectance data from satellites have become a critical tool because inversion algorithms allow for the determination of absorption and scattering spectra.
Measuring macroalgae in the field
Optical techniques are also used to measure macroalgae. For the case of the Atlantic pelagic Sargassum, most field and laboratory efforts rely on eye sighting, sample collection using a net, 12 and measuring the sample’s pigment composition and chemical composition—carbon, nitrogen, phosphorus, arsenic, and more—using HPLC and other techniques. Optical measurements of Sargassum did not start until the 2010s. 13
Because Sargassum on the surface forms individual clumps (see figures
Figure 3.

Measuring Sargassum mats in the Gulf of Mexico. (a) The biomass density is determined by weighing the collected Sargassum and using a reference quadrat, here 1 m on a side, to determine the size of the collected Sargassum. (Courtesy of Samuel Bunson.) (b) The mat’s spectral reflectance is measured using a handheld spectrometer pointing at the mat. Differences in magnitude are primarily due to how much Sargassum (that is, biomass density in kilograms per square meter) is captured in the spectrometer’s field of view. The relationship between reflectance and density is used to develop algorithms to calibrate and validate space-based measurements, which provide only reflectance data.
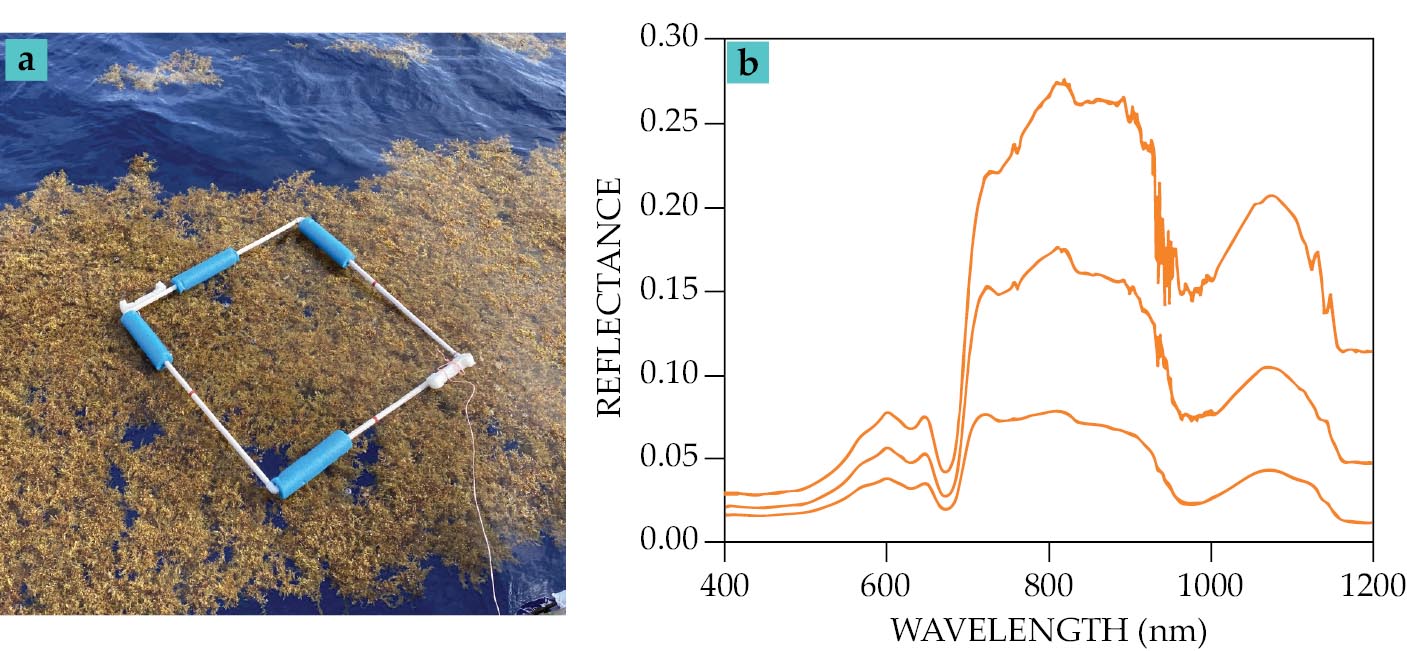
The reflectance of the Sargassum mat is measured using a spectrometer with a fiber-optic probe, which collects the sunlight reflected in the quadrat. Figure
In addition to the reflectance and biomass density measurements in the field, Sargassum samples collected from the quadrat are also analyzed for their pigment composition and elemental concentrations of carbon, nitrogen, and phosphorus, among others. 13 Because the makeup of the samples is measured with the Sargassum reflectance, which can also be measured from satellites, field data are essential for validating satellite observations. Using data based on field and laboratory measurements, researchers develop algorithms that they apply to space-based measurements in order to estimate Sargassum biomass density and other properties.
With new ocean color remote sensing techniques, along with advances in theory, instrumentation, and algorithm development, scientists can not only measure and characterize the underwater light field but also observe global oceans and lakes from space. The satellite-detected signals are used to estimate surface spectral reflectance of the ocean through a process called atmospheric correction
6
(see figure
The history of ocean color remote sensing goes back to the pioneering works of many individuals. 14 Since 1978, when the proof-of-concept Coastal Zone Color Scanner was one of eight instruments aboard the Nimbus-7 spacecraft, modern satellite sensors specifically designed to measure reflected sunlight have been equipped with more spectral bands, better signal-to-noise ratios, and finer spatial resolutions. Recent missions also allow for more frequent revisits to the same area. The satellite-derived surface reflectance measurements produce unprecedented data to study not only light penetration in the ocean but also, through the use of inversion algorithms, properties of microalgal particles and macroalgal mats.
Indeed, since the 1980s the number of publications that use the phrases “ocean optics” and “ocean color” has grown exponentially. Global distribution maps of microalgal particles that show concentration, absorption, scattering, type, size, and other variables have been made available by various space agencies (including NASA, at https://oceancolor.gsfc.nasa.gov ). Those data products have been used by the research community to not only quantify chlorophyll a and primary production but also differentiate different phytoplankton functional groups (see figure
Figure 4.

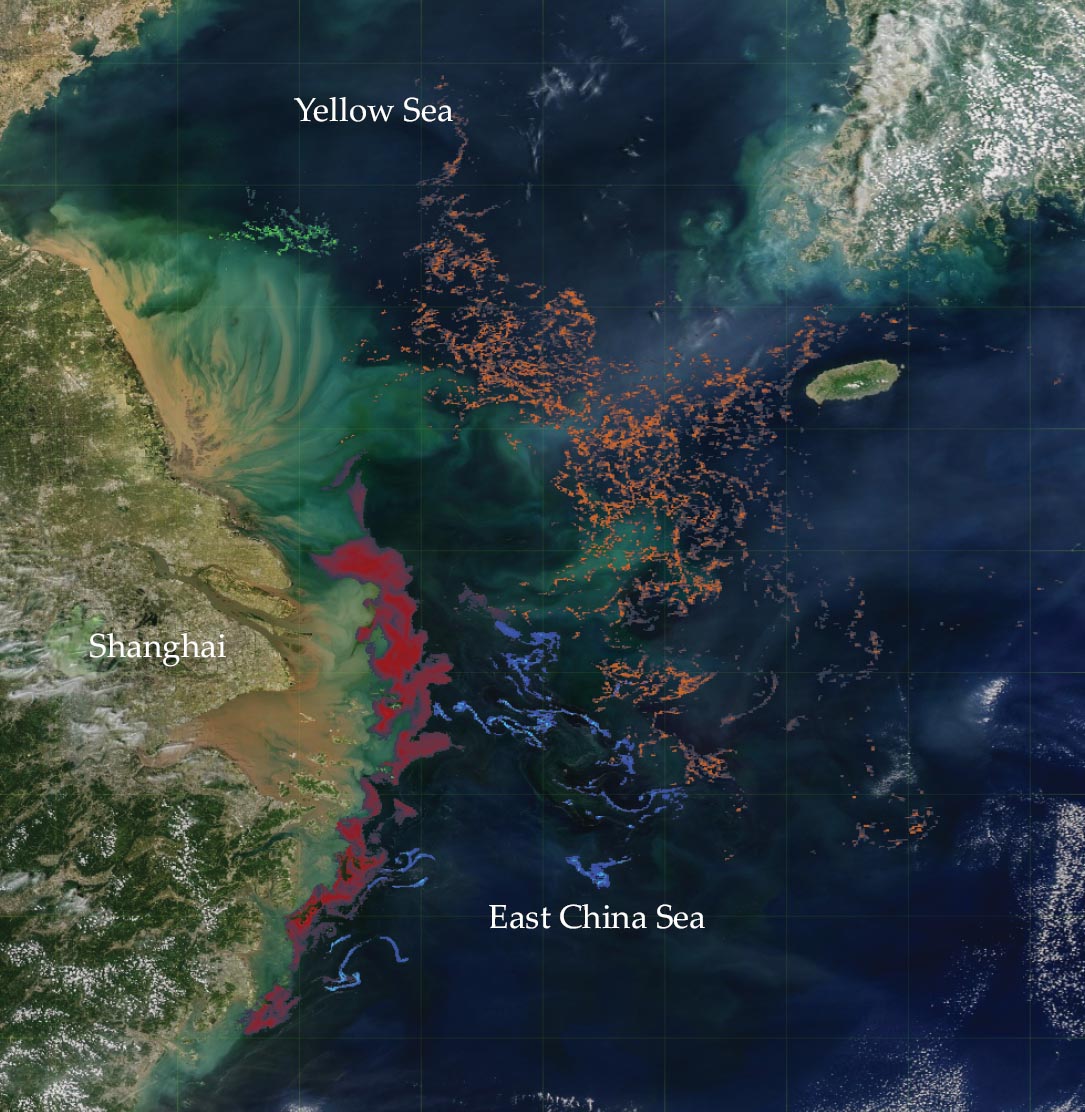
A blooming ocean of algae captured by NASA’s Moderate Resolution Imaging Spectroradiometer on the Aqua satellite over the East China Sea and Yellow Sea in 2017. Among the detected ocean algae are the microalgae Prorocentrum donghaiense (red) and Noctiluca scintillans (blue) and the macroalgae Sargassum horneri (orange) and Ulva prolifera (green). (Satellite image courtesy of Norman Kuring, NASA’s Goddard Space Flight Center; additional algae traces highlighted by Lin Qi.)
Measuring Sargassum from space
Ocean color remote sensing is now a crucial tool for studying not only microalgae but also macroalgae. Among the many types of macroalgae, the Atlantic pelagic Sargassum represents a special case because the recurrent great Atlantic Sargassum belt (GASB) 15 represents an emerging phenomenon that has significant implications for research, the environment, tourism, and the economy.
The relationship between Sargassum’s reflectance and biomass density—established from field measurements—can be applied to satellite-measured reflectance in each valid image pixel to map its biomass density from space. In that process, contributions from the atmosphere and other perturbation factors are removed (see figure
The distribution map of Sargassum density for the month of June 2021 is shown in figure
Figure 5.

The great Atlantic Sargassum belt in June 2021, which spanned an area of about 5 × 10⁶ km2. The Sargassum itself was estimated to be about 6000 km2 when aggregated together, with a total wet biomass of 18 million metric tons (t). The areal density of 0.1% corresponds to biomass density of 3.3 t/km2. (Data courtesy of MODIS.)

The discovery of the GASB, which has been recurring annually since 2011, resulted from advances in ocean optics and ocean color remote sensing. Traditionally, Sargassum was known to be abundant in the Sargasso Sea—a subocean in the North Atlantic named after the macroalgae—but satellite data show much higher abundances of the macroalgae in the tropical Atlantic in recent years. Researchers are hard at work studying the GASB, including how it was formed, whether it indicates a regime shift resulting from a changing climate, how it affects local biology and ecology, how it may change carbon cycling, and whether it can be used to sink carbon to the ocean floor.
Sargassum is a critical habitat for ocean life, but excessive amounts of it in coastal waters and on beaches have caused tremendous problems because dead Sargassum can sink to the bottom and smother corals and seagrasses. Rotten Sargassum on beaches can destroy turtle nests, attract insects, grow and spread bacteria, and cause respiratory problems in humans. All of those issues adversely affect local tourism and the economy, turning Sargassum from a critical habitat to a beach nuisance.
Countering Sargassum’s negatives will require more research efforts in understanding its biology and forecasting its blooms and in developing new methods to mitigate its effects and make it into useful products, such as fertilizers. Ocean optics and ocean color remote sensing are expected to continue playing an essential role in all those aspects. Improved understanding of the Sargassum biomass, growth rate, and changing patterns will provide more accurate data for forecasting models and for improved monitoring and tracking capacity through the application of artificial intelligence. 16
Globally, Sargassum is not the only macroalgae that can be detected, characterized, and quantified using optical means. Other types, either floating on the water surface or growing on the shallow bottom, have also been reported worldwide. They include Ulva prolifera, a green macroalgae, in the Yellow Sea; Sargassum horneri, a brown macroalgae that grows on the shallow ocean floor but can be detached to float on the surface, in the East China Sea
17
(see figure
Satellites big and small
After a century of development, ocean optics continues to greatly affect technology and science. The theory of underwater visibility has been revised from relying on assumptions to enabling direct estimates of water clarity. New sensors have been invented to measure variable fluorescence. New flow cytometers have been created to analyze thousands of microalgal cells per second. Those and other developments allow for more accurate assessments of phytoplankton physiology, and some sensors have been customized to be mounted on autonomous platforms, such as ocean gliders and the floats used by the international Argo program to collect ocean data.
The sensors include direct and derivative measurements of light scattering, absorption, fluorescence, attenuation, and reflectance—thus making it possible to characterize the underwater light environment and to automatically estimate microalgae and other ocean constituents. For example, as it drifts with ocean currents, each Argo float cycles between the surface and depths of 2000 m every 10 days, collecting a depth-dependent profile of ocean properties through its mounted sensors. There are 4000-plus Argo floats in the world’s oceans, so such bio-optical data will provide an unprecedented capability for mapping microalgae and other ocean properties in three dimensions, developing remote-sensing algorithms, and validating remote-sensing data products.
Those developments also support new polar-orbiting and geostationary satellite missions that use detectors that combine spectroscopy with imaging, polarimetry, and active techniques, such as lidar. Planned efforts include NASA’s forthcoming Plankton, Aerosol, Cloud, Ocean Ecosystem (PACE) mission; NASA’s Geostationary Littoral Imaging and Monitoring Radiometer (GLIMR), currently being developed; and NOAA’s future Geostationary Extended Observations (GeoXO) satellite system.
Of particular importance are the emerging constellations of easy-to-produce small satellites known as CubeSats that can measure land and coastal waters at a spatial resolution of just a few meters with near-daily revisits around the globe. Such a capacity has never been possible until recently because traditional satellites could not address the simultaneous requirements of high spatial and high temporal resolutions needed for studying the fast-changing microalgae and macroalgae with fine details. Indeed, the PlanetScope constellation of more than 200 CubeSats already has shown a much-improved capacity to track macroalgae near beaches. 18
Computer artificial intelligence has found increased applications in field and laboratory measurements and optical remote sensing, often with more robust algorithms and data products than what’s offered by traditional methods. All the advances will continue to enhance our capability to characterize, quantify, and understand both microalgae and macroalgae in the field and from space.
References
1. A. Morel, D. Antoine, Science 296, 1980 (2002). https://doi.org/10.1126/science.1072561
2. J.-P. Ferreira et al., Tour. Econ. 29, 812 (2023). https://doi.org/10.1177/13548166211068276
3. K. A. Steidinger, M. E. Meave del Castillo, eds., Guide to the Identification of Harmful Microalgae in the Gulf of Mexico, vols. 1 and 2, Florida Fish and Wildlife Conservation Commission (2018).
4. P. A. Secchi, Nuovo Cimento 20, 205 (1864). https://doi.org/10.1007/BF02726911
5. C. D. Mobley, Light and Water: Radiative Transfer in Natural Waters, Academic Press (1994).
6. H. R. Gordon, Physical Principles of Ocean Color Remote Sensing, University of Miami (2019).
7. N. G. Jerlov, Marine Optics, Elsevier (1976).
8. R. W. Preisendorfer, Hydrologic Optics, vols. 1–6, NOAA (1976).
9. C. S. Yentsch, Limnol. Oceanogr. 7, 207 (1962). https://doi.org/10.4319/lo.1962.7.2.0207
10. A. Bricaud et al., J. Geophys. Res. Oceans 109, C11010 (2004). https://doi.org/10.1029/2004JC002419
11. J. P. Cannizzaro et al., Cont. Shelf Res. 28, 137 (2008). https://doi.org/10.1016/j.csr.2004.04.007
12. D. S. Goodwin, A. N. S. Siuda, J. M. Schell, PeerJ 10, e14079 (2022). https://doi.org/10.7717/peerj.14079
13. M. Wang et al., Geophys. Res. Lett. 45, 12359 (2018). https://doi.org/10.1029/2018GL078858
14. J. Acker, The Color of the Atmosphere with the Ocean Below: A History of NASA’s Ocean Color Missions, CreateSpace Independent Publishing Platform (2015).
15. M. Wang et al., Science 365, 83 (2019). https://doi.org/10.1126/science.aaw7912
16. C. Hu et al., Remote Sens. Environ. 289, 113515 (2023). https://doi.org/10.1016/j.rse.2023.113515
17. L. Qi et al., Geophys. Res. Lett. 49, e2022GL098185 (2022). https://doi.org/10.1029/2022GL098185
18. S. Zhang et al., IEEE Geosci. Remote Sens. Lett. 19, 1 (2022). https://doi.org/10.1109/LGRS.2022.3227164
More about the authors
Chuanmin Hu is a professor of oceanography at the University of South Florida in St Petersburg. He has over 30 years of experience in ocean optics and ocean color remote sensing.


