The surface hydrology of Antarctica’s floating ice
DOI: 10.1063/PT.3.4919

Imagine an area the size of the US state of Rhode Island, some 3000 km2, breaking off from the land, collapsing, and floating away. Picture Brown University completely submerged and houses falling into the Atlantic Ocean. Luckily for the residents of Providence and the rest of the state, Rhode Island is a relatively stable land mass, so such a collapse is an unrealistic scenario. But if it were built on an Antarctic ice shelf, the story would be a little different.

NASA’S EARTH OBSERVATORY

Ice flows across Antarctica and continues to do so as it reaches the edge of the land mass and extends over the ocean. The huge floating tongues of ice often remain attached to the continent. Anything that remains grounded on the land is part of the Antarctic ice sheet; the floating part is an ice shelf. Floating ice shelves surround three-quarters of Antarctica’s coast and make up about 11% of its total area. One of the largest, the Ross Ice Shelf, is roughly the size of France. The George VI Ice Shelf is shown in the opening image, taken by NASA’s Landsat 8 in January 2020.
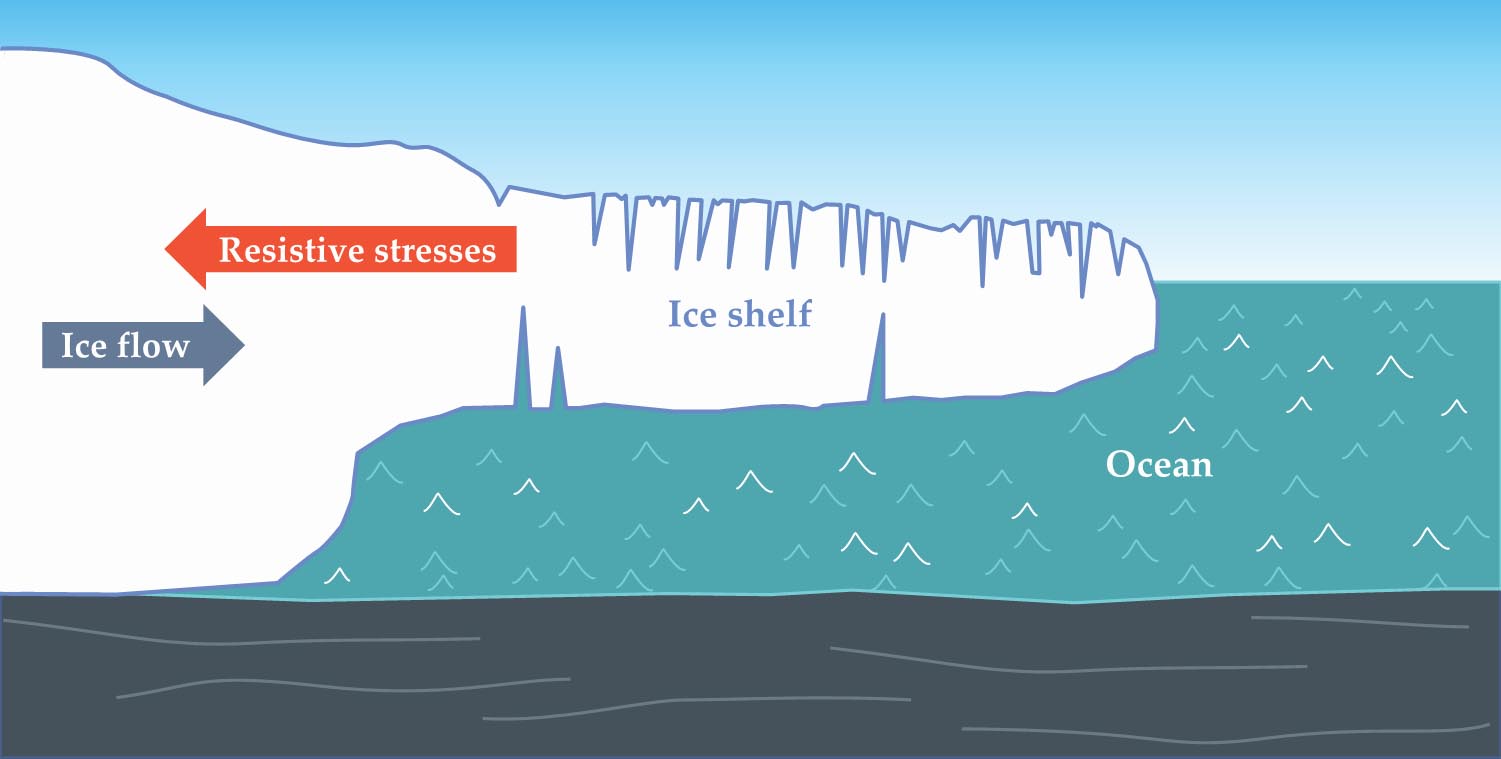
It may seem intuitive that all the ice added to the ocean from melting ice shelves would raise global sea level, but that’s not the case. By Archimedes’s principle, ice shelves floating on the water have already displaced their own weight, so their disintegration or melting won’t change the water level. Ice shelves do, however, regulate the speed of glaciers on Antarctica’s land. As shown in figure
Figure 1.

Resistive stresses restrain ice from flowing into the ocean. Some of the ice from the grounded sheet on the left floats on the ocean surface, where it prevents more ice from accelerating into the water and contributing to increased global sea level. (Image by Sammie Buzzard and Donna Padian.)
Although ice shelves are located thousands of kilometers away from anywhere else on Earth, their loss has global consequences. It can change ocean circulation, temperature, and salinity when the cold, fresh water from a collapsed shelf floats into the ocean and melts. Furthermore, sudden collapses destroy habitats for penguins and various other creatures.
In 2002 the Larsen B Ice Shelf, an area roughly the size of Rhode Island, suddenly disintegrated spectacularly. It shattered into smaller pieces and was dispersed to the surrounding ocean in less than a month. Scientists have observed several major ice-loss events over the past few decades, including on Larsen B’s next-door neighbors. The Larsen A Ice Shelf collapsed in 1995, and in 2017 the Larsen C Ice Shelf lost an iceberg larger than the areas of Larsen A and Larsen B combined. 1
In the case of Larsen B, the ice shelf was located on the Antarctic Peninsula, the most northern part of the continent. The region is one of the warmer areas of Antarctica, and the surface of the ice is melting. The water from it accumulates to form lakes up to 4 km long. Larsen B was covered in those lakes, but just before the ice shelf collapsed, the lakes started to drain one after another. Scientists suspect that the chain reaction of draining lakes was key to the sudden collapse of the ice shelf.
2
Figure
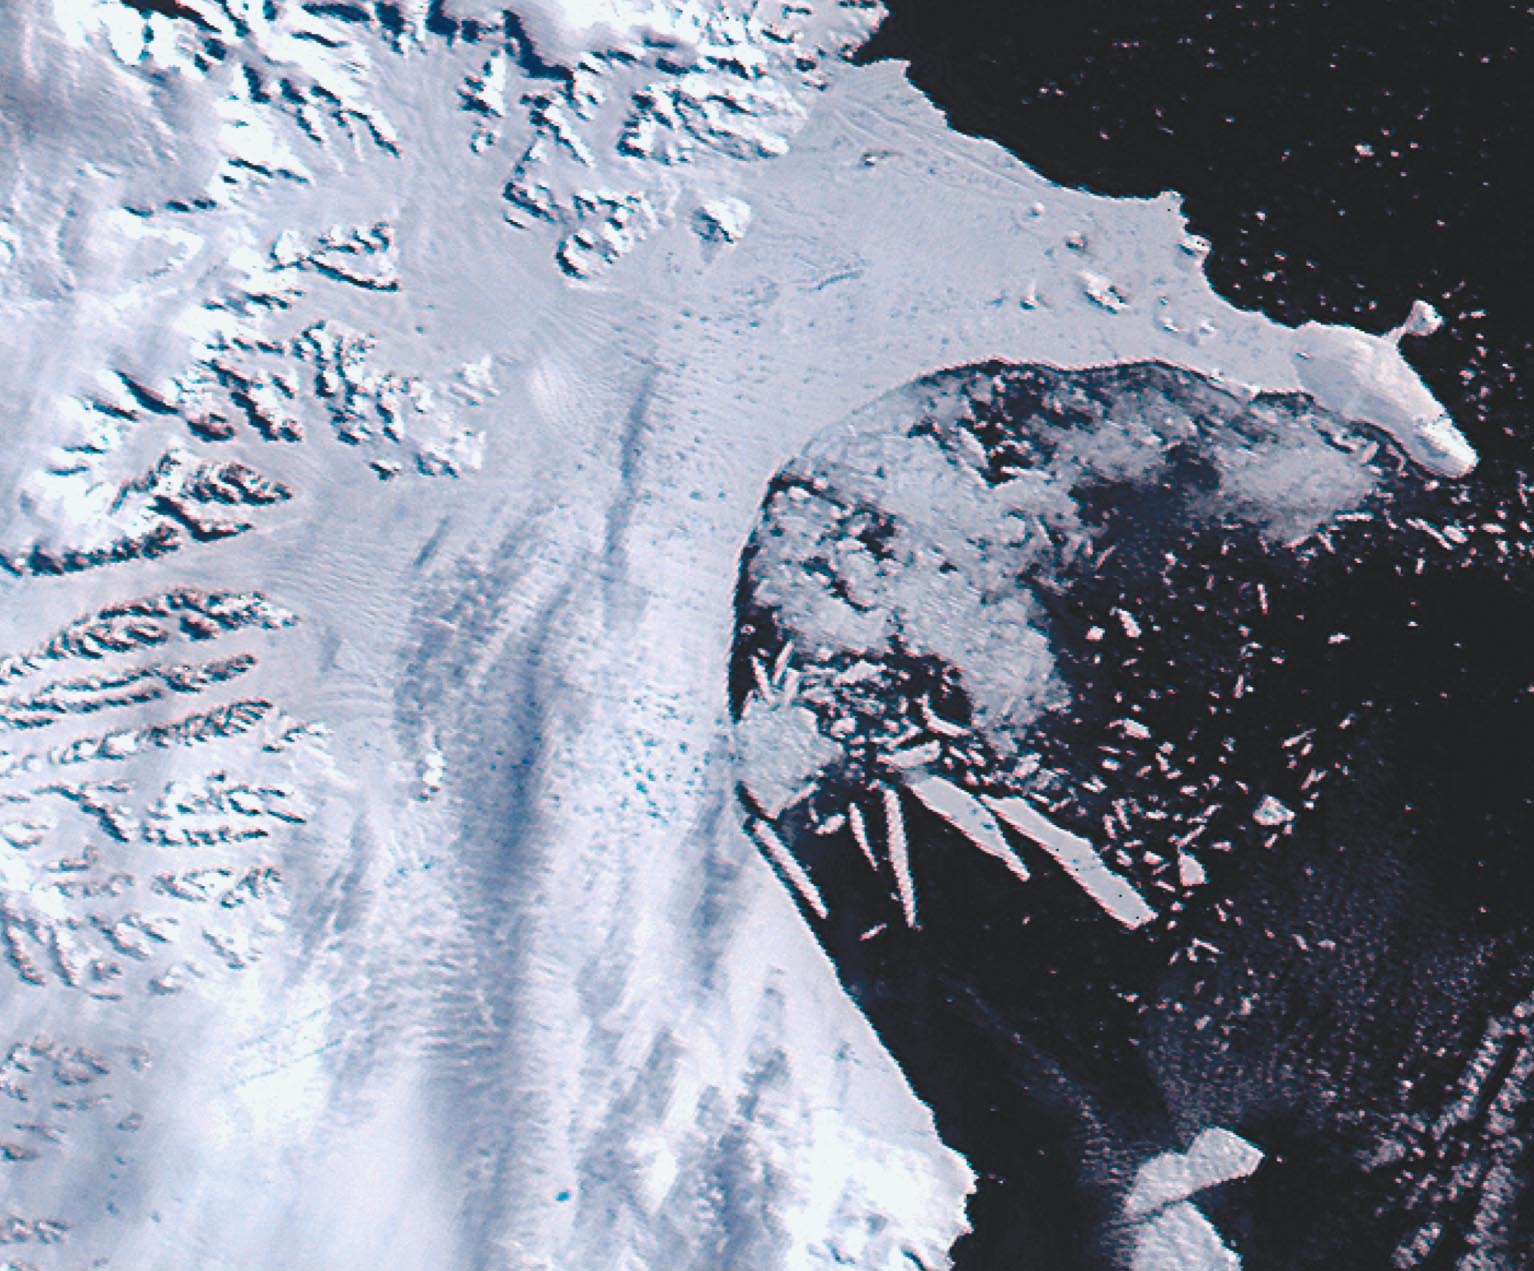
Figure 2.

The Larsen B Ice Shelf, which totaled some 3000 km2, collapsed from Antarctica’s land surface in February 2002. The solid white areas are the ice shelf, the dark area to the right is ocean, and the white fragments are disintegrated ice shelf or sea ice. The speckled blue-colored features on the ice shelf are melt lakes that were present at the time of the collapse and that likely contributed to the shelf’s instability. (Courtesy of MODIS, NASA’s Earth Observatory.)
Between 2012 and 2016, the Antarctic ice sheet lost 199 ± 26 gigatons of ice per year. 3 Researchers in the climate-science community hotly debate how much of the sheet will melt in the future and at what rate. Part of the debate focuses on whether the direction of the bed slope beneath the ice sheet will influence the melt rate, which is known as marine ice-sheet instability. The ice sheet is considered unstable when the bed slopes downward from the point that the sheet becomes afloat toward its center. Another possibility, known as marine ice-cliff instability, arises when unstable ice cliffs form as ice shelves collapse. 4 Both instabilities are theoretical possibilities that have yet to be observed, and the choice to include them in ice-sheet models produces a wide range of future predictions of Antarctica’s contribution to sea-level rise. 5
Although many ice shelves currently remain relatively unscathed, researchers are investigating which of them may be at future risk and which collapse events may be related to human effects on the climate. 6 Lakes and other features caused by melting snow and ice have been observed on other ice shelves in Antarctica, 7 in the Arctic on the Greenland Ice Sheet, and on the frozen sea ice in the Arctic Ocean. To understand what the future may hold for the planet’s frozen regions, researchers need to understand more about the melting. How well are computer models capturing the thermodynamics of ice shelves? How and where are they melting, and where is the water going?
Antarctica’s changing surface
The ice shelves and ice sheets of Antarctica are made of more than solid ice. In many areas, a layer of snow, sometimes tens of meters thick, lies on top of the ice. Over time, that snow forms ice sheets. As more snow falls on the surface, the older snow below becomes more compacted and is eventually dense enough to form solid ice. Called meteoric ice, it is derived from precipitation, which in Antarctica almost always means snow.
The snow layer complicates estimates of ice-shelf melting because any water produced through melting at the surface will drain down into the snow. Although some satellite methods can detect water on the surface and in the snow, observations are limited and don’t always provide accurate values. Many estimates of the amount of melting are based on regional climate models, and scientists still have a lot to learn about the snow itself: how deep it goes, how dense it is, and how those properties change over space and time.
One thing glaciologists can be sure about is that Antarctica gets quite cold. When water drains into the snow, it often refreezes, which causes two important changes to the ice shelf. The frozen water alters the shelf’s density and its temperature. The density change is intuitive: Filling lots of fluffy, airy snow with water that freezes will make the snow denser than it was originally. In some cases, enough water refreezes in the snow to form lenses, or layers, of solid, impermeable ice. They can be a few centimeters to several meters thick.
8
Figure
Figure 3.

Glaciologist Heïdi Sevestre points to lenses of solid ice in a snow wall that separates two snow pits on the Larsen C Ice Shelf in Antarctica. (Courtesy of Project MIDAS, Swansea University, and Aberystwyth University.)

The second change, the ice shelf’s temperature, occurs because of the release of latent heat as water freezes and becomes ice. The phase change heats up the surrounding snow enough that when the ambient temperature reaches 0 °C, a layer of constant-temperature, or isothermal, snow develops that extends from the surface to the depth that the meltwater has reached.
For lakes to form, the snow has to become completely saturated with meltwater. The isothermal layer would need to extend down to where the snow becomes so dense that water can no longer percolate through it. The maximum depth that water can reach is known as the pore-closure depth of the ice shelf. The formation of ice lenses can expedite the saturation of the snow. Because the lenses are mostly impermeable to meltwater, any water that reaches them is then stuck and can’t permeate farther. The water begins to saturate the snow from the ice lenses upward, which means that a much smaller melt volume is needed for the snow to become fully saturated and for lakes to form on top of the snow–water mixture.
Once lakes form, they can accelerate the melting of the surrounding ice through multiple processes. First, the lakes are darker than the ice and thus have a lower albedo, or reflectivity. Consequently, they absorb more shortwave solar energy than the ice, heat up, and melt more of the surrounding snow and ice. The positive feedback loop leads to more melting.
Second, the water itself causes additional melting if it gets into existing crevasses on the ice shelf. The weight of the shelf—known as overburden or lithostatic pressure—acts to close crevasses. But the water pressure can counteract the lithostatic pressure and open the crevasse horizontally and vertically. With enough water, the crevasse penetrates the whole ice shelf, a consequence of which may be sudden collapse, depending on the stresses the shelf is experiencing. In addition, researchers have observed that the weight of the water in the lakes bends the ice shelf. That process may have contributed to the instability of Larsen B. 2
Science at the poles
Given the size of Antarctica and the logistics of getting there and taking measurements, observing ice processes is especially difficult. Satellites provide some information. Lakes are visible, for example, in optical images, but as soon as their surfaces refreeze, it is no longer possible to determine whether they contain water or to distinguish them from surface ice. Other complicating factors include clouds blocking the satellite’s view for a substantial proportion of time and the 24 hours of darkness the South Pole experiences for five months of the year. Researchers at the UK’s Halley VI Research Station farther north on Antarctica’s Brunt Ice Shelf have to endure “only” around 100 days of darkness a year.
Automatic weather stations provide information about ice-shelf conditions even when people aren’t there to monitor them. Only a limited number of locations, however, are monitored by the network of instruments, which people still need to maintain and retrieve the data from. With the 2020 and 2021 field seasons disrupted by the COVID-19 pandemic, operations have been severely curtailed, including travel. To date, Antarctica has had only a few coronavirus cases. The majority of data-gathering fieldwork was canceled or postponed in the 2020–21 field season, and the limited personnel who have traveled to the continent are mostly maintaining existing instrumentation rather than doing any new science.
Although researchers have been allowed to continue with some fieldwork during the 2021–22 season with stringent quarantine requirements, they will have to wait at least another year to collect valuable measurements such as those taken from radar surveys, which reveal the inner structure of the ice shelf and where they should drill for ice cores. They can learn about past climates by looking at the air bubbles trapped in the cores (see the article by Mark Maslin, Physics Today, May 2020, page 48 ).
Simulating Antarctica’s water
Given the lack of direct water observations on Antarctica, computer models are essential to predicting the future of the continent’s ice shelves. Researchers at Cardiff University and Georgia Tech are currently collaborating to develop MONARCHS, the first comprehensive model for surface meltwater across Antarctica’s ice shelves. (The acronym stands for Model of Antarctic Ice Shelf Surface Hydrology and Stability. Scientists do love a tenuous acronym.) The collaborators will use it to assess what areas of Antarctica are vulnerable to collapse events.
One ice shelf of particular interest is Larsen C. The next-door neighbor of the former Larsen B, it is Antarctica’s most northern ice shelf and the continent’s fourth largest. The Larsen Ice Shelves, of which there were originally four, were named after Carl Anton Larsen, a Norwegian whaling captain who sailed along the ice front in 1893. Although Larsen A and Larsen B have mostly collapsed (see figure
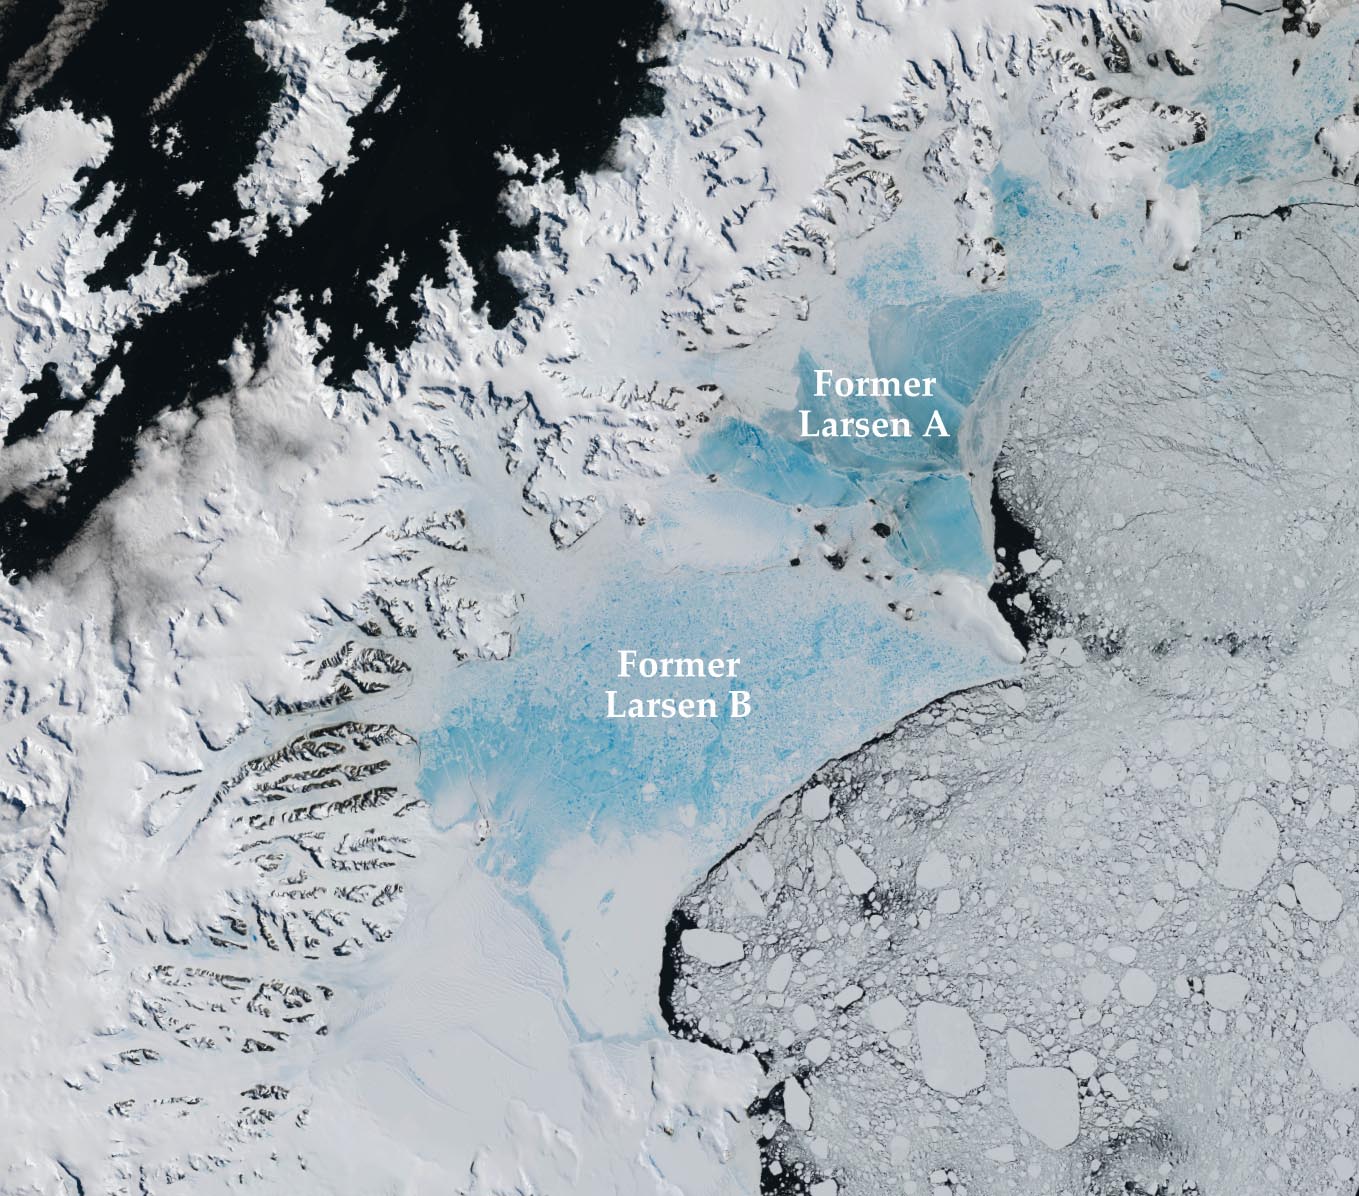
Figure 4.

Two ice shelves, Larsen A and Larsen B, collapsed from the east coast of the Antarctic peninsula in 1995 and 2002, respectively. Sea ice now fills their place. Recently the Larsen C Ice Shelf (not shown) has experienced potentially unstable conditions, including the loss of a huge iceberg in 2017. (Courtesy of NASA’s Earth Observatory.)
Larsen C hit headlines in 2017 when a huge iceberg broke away from the shelf. 9 Although the production of an iceberg is a natural event and doesn’t necessarily indicate climate change, researchers are concerned about the lakes that satellite images have revealed on part of the ice shelf.
The snow on Larsen C that sits on top of the ice is several meters deep, and water from snow melting at the surface will drain downward into the remaining snow. For a lake to form, it would take a lot of water, likely several times more than would be provided in any one location by the melting snow at the surface of the ice shelf. The large volume of water that would be needed suggests that something else is contributing to lake formation. Scientists need to understand whether the water accumulates in certain areas because of the shape of the ice shelf’s surface or if the processes involving the refreezing of water have an effect.
To simulate ice-shelf processes, computer models need to include not just the energy balance at the surface of the ice shelf and the heat transfer through the ice and snow, but also the changes in the density of the snow as it melts and refreezes and the path of any water produced across the ice shelf’s surface. 10 A significant amount of computing power has to be dedicated to certain processes. The vertical percolation of meltwater, for example, happens on scales of a few centimeters to meters, whereas water can travel laterally across the ice shelf for many meters or even kilometers. A simulation of horizontal water transport across several kilometers of an ice-shelf surface takes just a few minutes on a laptop. But including the water percolating vertically down into the snow and refreezing can mean running computer simulations for several days on a supercomputer.
Although the refreezing of meltwater to form ice lenses can be important for the formation of melt lakes and can cause lakes to refreeze, 11 a lot of work remains to determine how water moves laterally across ice shelves and how it affects their stability. Could the future of the Larsen C Ice Shelf be headed for a fate similar to that of Larsen B?
The future of polar regions
Much of the work mentioned in this article is applicable beyond Antarctica’s ice shelves. In the Arctic, the Greenland Ice Sheet is melting, and lakes have formed. In many ways, the surface behaves similarly to that of ice shelves. Most of Greenland’s ice is grounded, but if water drains to the bed of the ice sheet, it can lubricate the base. The sheet then slides across its bed faster, reaches the ocean more quickly, and accelerates sea-level rise.
Meltwater processes also apply to sea ice, the frozen layer of seawater that sits on the surface of polar oceans, although on a smaller scale and with added salt. Ponds on the surface of sea ice contribute to its seasonal retreat and breakup as it disappears each summer with increasing temperatures.
As global temperatures continue to rise because of climate change, knowing more about the role of meltwater and the thermodynamics of the ice in Earth’s frozen regions is becoming increasingly important. Scientists are discovering new features of meltwater, such as fast-flowing rivers and waterfalls, which complicate their understanding of Antarctica’s hydrology. Additionally, they need to fully comprehend the effect of a warming ocean on the base of ice shelves. As Earth continues to warm, those effects will likely continue to develop, damage ice shelves, and raise sea level. Antarctica’s contribution to global sea level is increasing: Between 1992 and 2017, Antarctica is estimated to have contributed 7.6 mm to global sea level, 12 with two-fifths of that amount occurring since 2008.
The sizes of ice sheets and ice shelves and water’s high heat capacity mean that polar regions are slow to respond to climate change. It appears that humanity has committed to centuries of ice-sheet melt and sea-level rise that will continue until the polar regions reach a new equilibrium state. Understanding the polar regions better, however, will allow society to plan for that change, protect the most vulnerable communities from the consequences, and ensure that humanity’s actions going forward do not make the problem worse.
References
1. B. Davies, “The Larsen C Ice Shelf growing rift,” AntarcticGlaciers.org (19 June 2017).
2. A. F. Banwell, D. R. MacAyeal, O. V. Sergienko, Geophys. Res. Lett. 40, 5872 (2013). https://doi.org/10.1002/2013GL057694
3. M. Meredith et al., in The Ocean and Cryosphere in a Changing Climate: A Special Report of the Intergovernmental Panel on Climate Change, H.-O. Pörtner et al., eds. (2019), chap. 3.
4. F. Pattyn, Nat. Commun. 9, 2728 (2018). https://doi.org/10.1038/s41467-018-05003-z
5. T. L. Edwards et al., Nature 566, 58 (2019). https://doi.org/10.1038/s41586-019-0901-4
6. D. G. Vaughan et al., in Climate Change 2013: The Physical Science Basis—Working Group I Contribution to the Fifth Assessment Report of the Intergovernmental Panel on Climate Change, T. F. Stocker et al., eds., Cambridge U. Press (2013), chap. 4.
7. R. E. Bell et al., Nat. Clim. Change 8, 1044 (2018). https://doi.org/10.1038/s41558-018-0326-3
8. B. Hubbard et al., Nat. Commun. 7, 11897 (2016). https://doi.org/10.1038/ncomms11897
9. A. E. Hogg, G. H. Gudmundsson, Nat. Clim. Change 7, 540 (2017). https://doi.org/10.1038/nclimate3359
10. S. Buzzard, D. Feltham, D. Flocco, Cryosphere 12, 3565 (2018). https://doi.org/10.5194/tc-12-3565-2018
11. S. C. Buzzard, D. L. Feltham, D. Flocco, J. Adv. Model. Earth Sys. 10, 262 (2018). https://doi.org/10.1002/2017MS001155
12. IMBIE team, Nature 558, 219 (2018). https://doi.org/10.1038/s41586-018-0179-y
More about the authors
Sammie Buzzard is a lecturer in climate science at Cardiff University in Wales.


