Three-dimensional mapping of dark matter reveals the expected filamentary scaffold
DOI: 10.1063/1.2718745
In 2004 and 2005, the Cosmic Evolution Survey was granted almost 1000 hours of observing time on the Hubble Space Telescope . COSMOS, an international collaboration of some 90 astronomers headed by Nick Scoville of Caltech, used this extraordinary allotment of scarce HST time to peer at very distant galaxies in a patch of sky about nine times as big as the full Moon.
Not far from the North Pole of our own galaxy, this patch was chosen for its relative freedom from obscuring foreground stars, dust, and local galaxies. The COSMOS exposure has yielded well measured positions and shapes for half a million galaxies out to a redshift z of 3. That’s a glimpse all the way back to how galaxies looked 11 billion years ago.
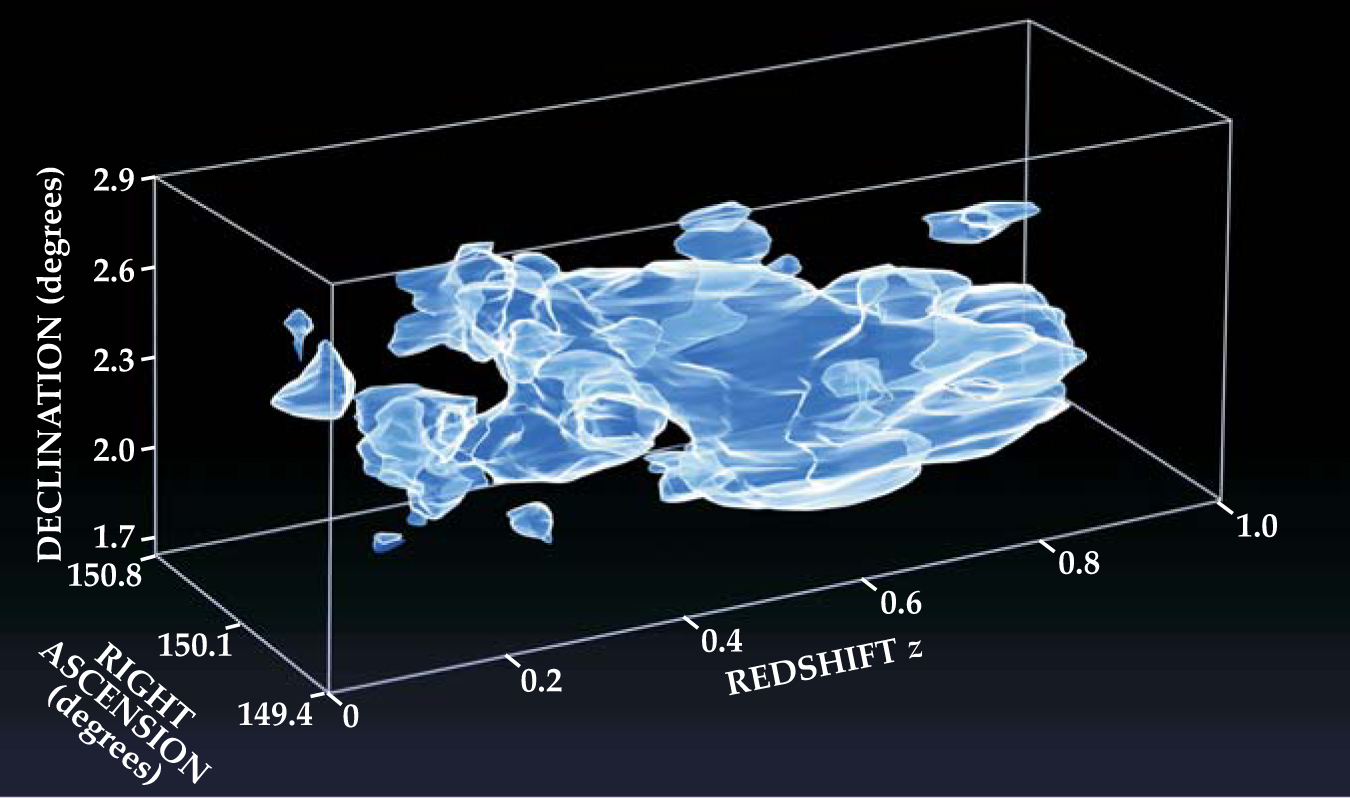
Having completed a gravitational-lensing analysis of that prodigious accumulation of observational data, the collaboration has now reported the most extensive and detailed study to date of how the distribution of dark matter on a cosmological scale has been evolving over the past 8 billion years. 1 The showpiece of the study is the three-dimensional dark-matter map displayed in Figure 1. Charting the distribution of the dark matter lets the COSMOS team examine how that distribution has governed the clustering of ordinary matter into accumulations of gas and stars.

Figure 1. Three-dimensional map of the distribution of dark matter in a 1.6-square-degree patch of sky to a redshift depth of z = 1, which means a look-back time of almost 8 billion years. The dark matter reveals itself by its gravitational-lensing distortion of the images of background galaxies. The surface is an isodensity contour chosen to illustrate the evolving fragmentation of the dark matter by gravitational collapse into filaments and clumps. The interior white shading suggests the filamentary structure. The smooth continuity of the dark matter in z is probably somewhat exaggerated by the limited redshift resolution of the mapping.
(Adapted from ref. 1.)
Nonbaryonic dark matter made up of still-unidentified weakly interacting elementary particles is presumed in standard cosmology to account for about 85% of all matter. Because it neither emits nor reflects photons at any wavelength, astronomers can map it on large scales only through its gravitational-lensing distortion of background galaxies (see Physics Today, November 2006, page 21 ).
Exploiting the Hubble
Pioneering gravitational-lensing studies of dark matter on large scales have been carried out in recent years with ground-based telescopes. 2 But atmospheric blurring makes it difficult for ground-based telescopes to measure the typically small lensing distortions with the requisite precision, especially for the faint galaxies at the higher redshifts. “The HST was essential to our charting of the dark matter with resolution good enough for interesting comparison with theory,” says Richard Massey (Caltech), who led the gravitational-lensing analysis of the COSMOS field.
The ellipticity of the distortion imparted to a distant galaxy’s image by any massive foreground system not precisely along the line of sight is a few percent at most. Because that’s well within the range of true galactic ellipticities, only a painstaking statistical analysis of the nonrandom distribution of ellipse orientations can yield the so-called gravitational-shear field from which one deduces the distribution of all foreground lensing matter.
But complementary data from large ground-based telescopes, and indeed from the European Space Agency’s orbiting XMM-Newton x-ray telescope, were also essential to the COSMOS undertaking. Gravitational lensing, like its optical analogue, is strongest when the lensing mass is halfway between the observer and the object being lensed. In the absence of distance information about the distorted background galaxies, the shear field yields only an integral of all the lensing masses along each line of sight.
Therefore, to get 3D information about the dark-matter distribution one needs some measure of how far away each background galaxy is. That’s where the ground-based telescopes come in. Follow-up photometric measurements of almost all the half-million galaxies found in the COSMOS field by the HST were carried out in 15 wavelength bands by the 8-meter Subaru telescope in Hawaii and other large telescopes. Those observations measured each galaxy’s redshift, and thus its distance or, equivalently, its look-back time. (Galaxies with redshifts less than 0.03 were discarded as being too local.)
Cosmic tomography
To deduce the dependence of the dark-matter distribution on distance, the group resorted to what’s been called cosmic tomography. Massey and company compiled separate gravitational-shear maps for 12 different redshift bins of background galaxies. Then, knowing how the distortion of galaxies at a given distance depends on the distance of foreground lensing matter, they were able to create tomographic slices through the dark-matter distribution at different redshift distances.
Figure 2 shows three such slices, at distances corresponding roughly to look-back times ranging from 3.5 to 6.5 billion years. The contour lines show the COSMOS field’s distribution of lensing matter (mostly dark) in each slice. As expected from the standard cold-dark-matter scenario—which assumes that the dark-matter particles are too cold to stream freely out of deep gravitational potential wells—the dark-matter distribution gets clumpier and more fragmented over time (with decreasing redshift) as gravitational clustering amplifies differences between regions of greater and lesser mass density. The same increasing fragmentation is also evident in Figure 1.

Figure 2. Tomographic slices of the COSMOS field’s evolving distribution of dark matter and galaxies at three different redshifts z, corresponding to look-back times (with increasing z) of about 3.5, 5.0, and 6.5 billion years. The contour lines show the density variation of total lensing matter, dark and baryonic. The colors show the distribution of galaxies near each redshift. Green shading indicates the number density of galaxies, and blue shading weights that density in favor of galaxies with large stellar masses.
(Adapted from ref. 1.)
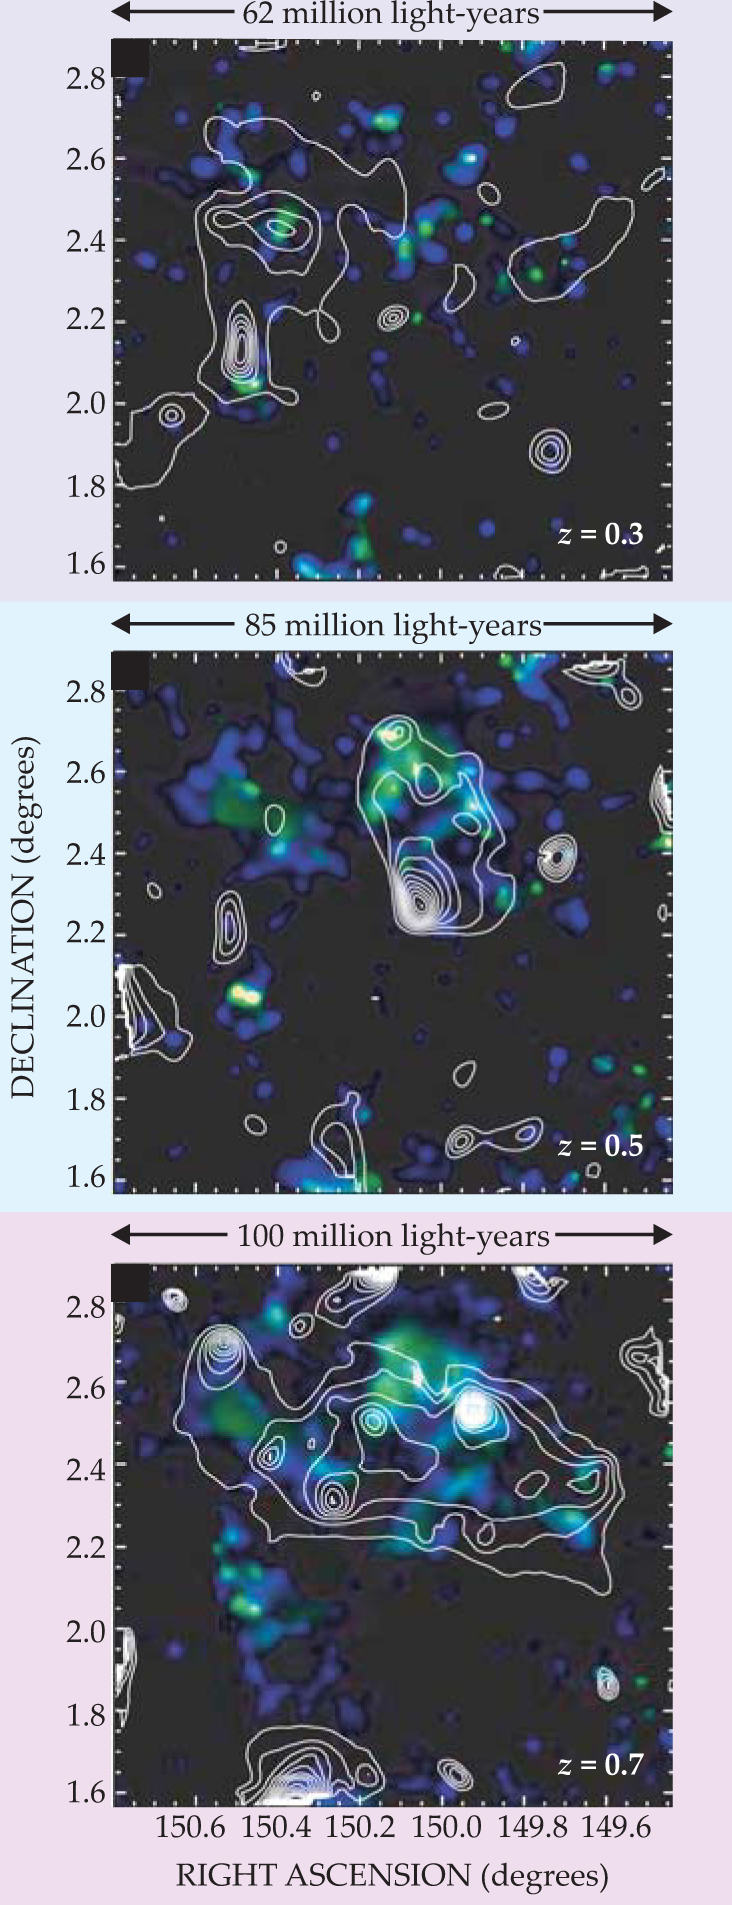
Like any peephole, the COSMOS field is a window onto a conical volume that gets wider with increasing distance—here somewhat complicated by the ongoing Hubble expansion of the universe. All three width labels on the slices in Figure 2 are of order 108 light-years. That’s big enough to give evidence of the gradual gravitational collapse of dark-matter accumulations into a network of filaments of the kind one expects from the filamentary distribution of galaxies revealed by large-scale galaxy surveys.
Where do the baryons go?
The colors in the tomographic slices of Figure 2 point out another important function of the ground-based redshift measurements. Knowing how far away the galaxies are is important not just for the lensing analysis. It also lets one examine how the distribution of dark matter influences the evolution and clustering of galaxies. The color shadings in each slice indicate the abundance and stellar masses of galaxies nearby.
The densest accumulation of dark matter revealed by the COSMOS lensing analysis at any redshift is indicated by the prominent convergence of contours near declination 2.5° and right ascension 149.9° in the bottom slice of Figure 2. That dark-matter prominence turns out to sit right on top of a previously unknown giant cluster of galaxies at z = 0.73. With an estimated stellar mass 3 × 10¹³ times that of the Sun, the newly discovered high-redshift cluster was, 6.5 billion years ago, already as massive as the Coma supercluster, practically our neigbor at z = 0.02, is now.3 Still, that stellar mass is dwarfed by the dark-matter halo that envelops it.
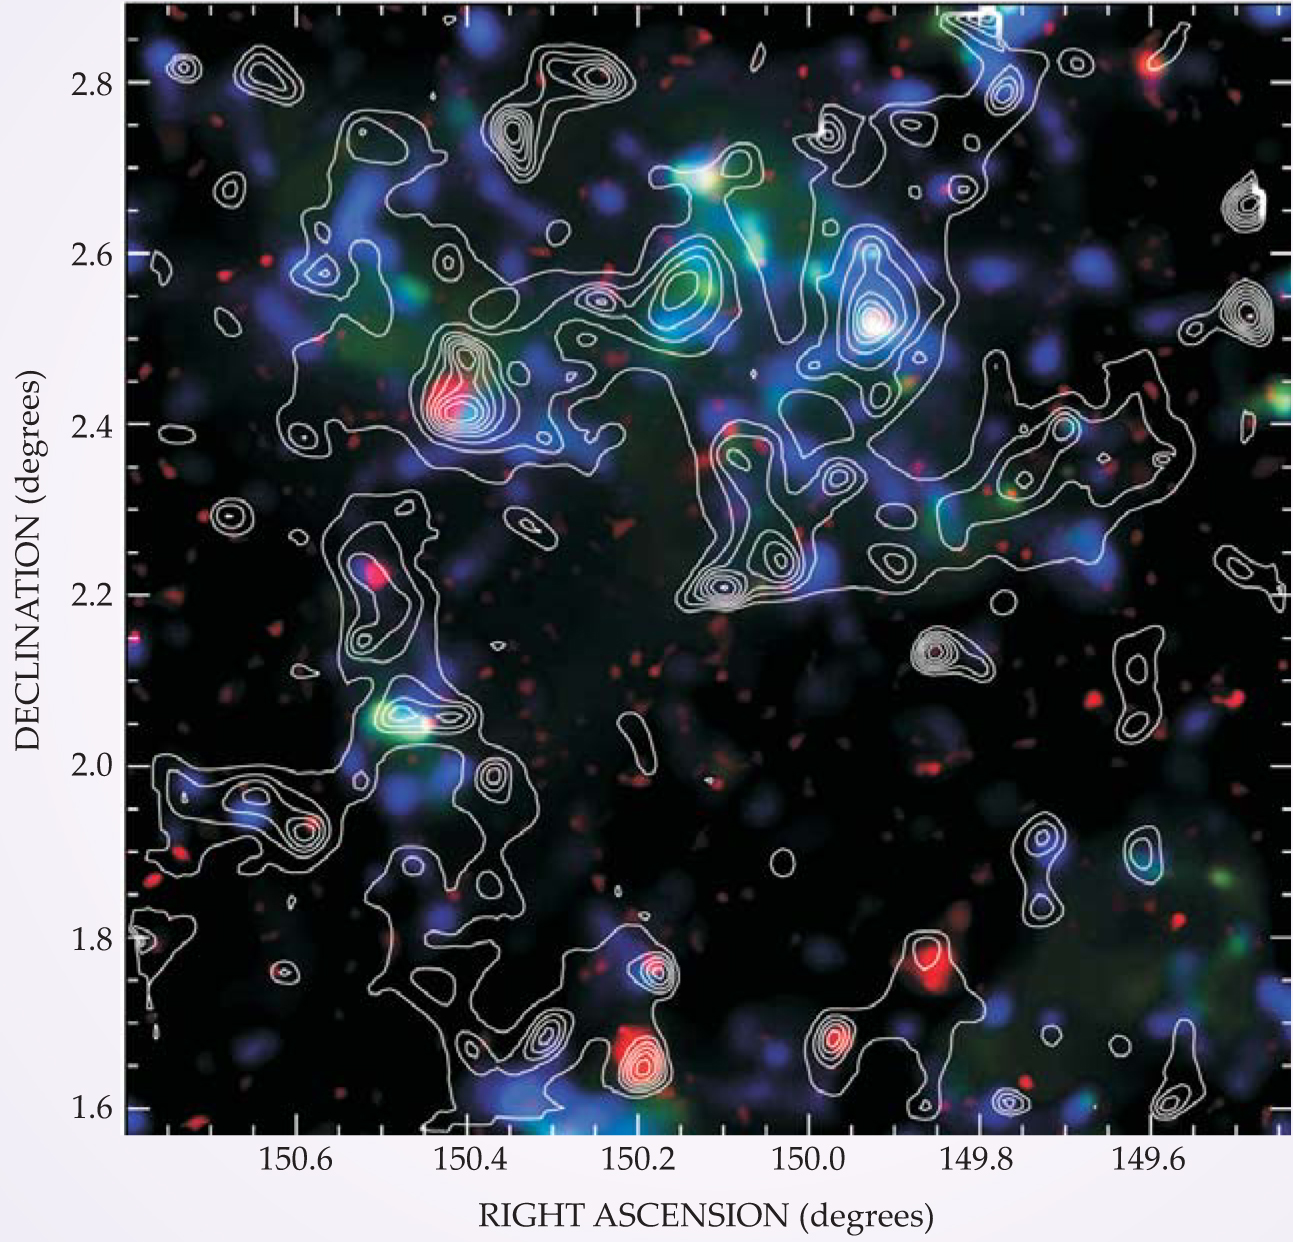
Such coincidence of dark-matter peaks and large galaxy clusters agrees well with the theoretical expectation that galaxies form most readily where gas has collected in deep potential wells created by the prior clustering of dark matter. Figure 3 demonstrates more broadly the affinity of ordinary baryonic matter for dense accumulations of dark matter. The figure’s contour lines show the projection onto the celestial sphere of all the COSMOS field’s lensing matter (roughly 85% nonbaryonic), summed over all z. Superimposed on the contours is not only the projected distribution of galaxies, but also all accumulations of hot intergalactic gas found in x rays by XMM-Newton . The projection makes it easier to see the filamentary character of the dark-matter distribution.

Figure 3. Sum over all redshifts of dark and ordinary matter in the COSMOS field here includes hot intergalactic gas (shown in red) revealed by its x-ray emission. Green and blue shading and contour lines are the same as in Figure
(Adapted from ref. 1.)
A scaffold for building stars
In model simulations of the gravitational evolution of structure in an initially almost-uniform distribution of cold dark matter, a cosmic filamentary network forms as denser regions of randomly elongated geometry collapse first in two dimensions. Subsequently, in such models, galaxies form earliest at nodes where filaments meet, later elsewhere along the filaments, and seldom in regions between filaments. 4
That’s essentially what COSMOS finds. The distributions of galaxies and of hot gas are strongly correlated with the evolving dark-matter distribution, and the largest galaxy clusters and hot gas tend to appear at junctions between filaments. Furthermore, galaxies near the junctions tend to have the oldest star populations, as witness the weakness of their ultraviolet output.
Massey calls the filamentary network of dark matter glimpsed by the lensing analysis “a cosmic gravitational scaffold in which stars are built.” Tweaking the metaphor, astrophysicist Eric Linder (Lawrence Berkeley National Laboratory) cautions that in a few places, especially near the edges, Figure 3 shows “flesh without supporting bones and bones without surrounding flesh.” Does that indicate a problem with the theory?
Massey responds that the periphery of the COSMOS field is particularly susceptible to spurious lensing results, essentially because points near the edge are not fully surrounded by imaged background galaxies. Furthermore, artifacts can be introduced by cumulative radiation damage to the CCD arrays of the HST ‘s Advanced Camera for Surveys, which recorded the COSMOS data.
The ACS suddenly went dead in January. Whether or not the camera recovers, it is scheduled to be replaced by a next-generation survey camera during a 2008 servicing mission. With the new camera, the collaboration hopes to refine its dark-matter mapping of the COSMOS field and extend it to higher redshifts. In addition to charting dark matter, the COSMOS collaboration examines, quite generally, how galaxies at high redshifts differ from galaxies in the present epoch. 3 Scoville calls it paleocosmology. “COSMOS,” he says, “is revealing, for the first time, the largest structures as they form in the early universe.”
Looking beyond the HST , the collaboration hopes for a specialized orbiter that could produce deeper and more finely resolved dark-matter maps over regions of sky very much larger than the COSMOS field. To that end, COSMOS has joined the SNAP collaboration led by Saul Permutter at LBNL. SNAP is one of several contending orbiter proposals to investigate dark energy by searching for high-redshift supernovae. But it is the only contender designed to map dark matter while it’s patrolling for supernova explosions.
References
1. R. Massey et al., Nature 445, 286 (2007). https://doi.org/10.1038/nature05497
2. D. Wittman et al., Astrophys. J. 557, L89 (2001) and 643, 128 (2006); https://doi.org/10.1086/323173
N. Kaiser, G. Wilson, G. Luppino, http://arxiv.org/abs/astro-ph/0003338 .3. N. Scoville et al., Astrophys. J. Suppl. (in press), available at http://arxiv.org/abs/astro-ph/0612384 .
4. See, for example, V. Springel et al., Nature 435, 629 (2005). https://doi.org/10.1038/nature03597


