Reduced pandemic emissions contributed to atmospheric methane surge

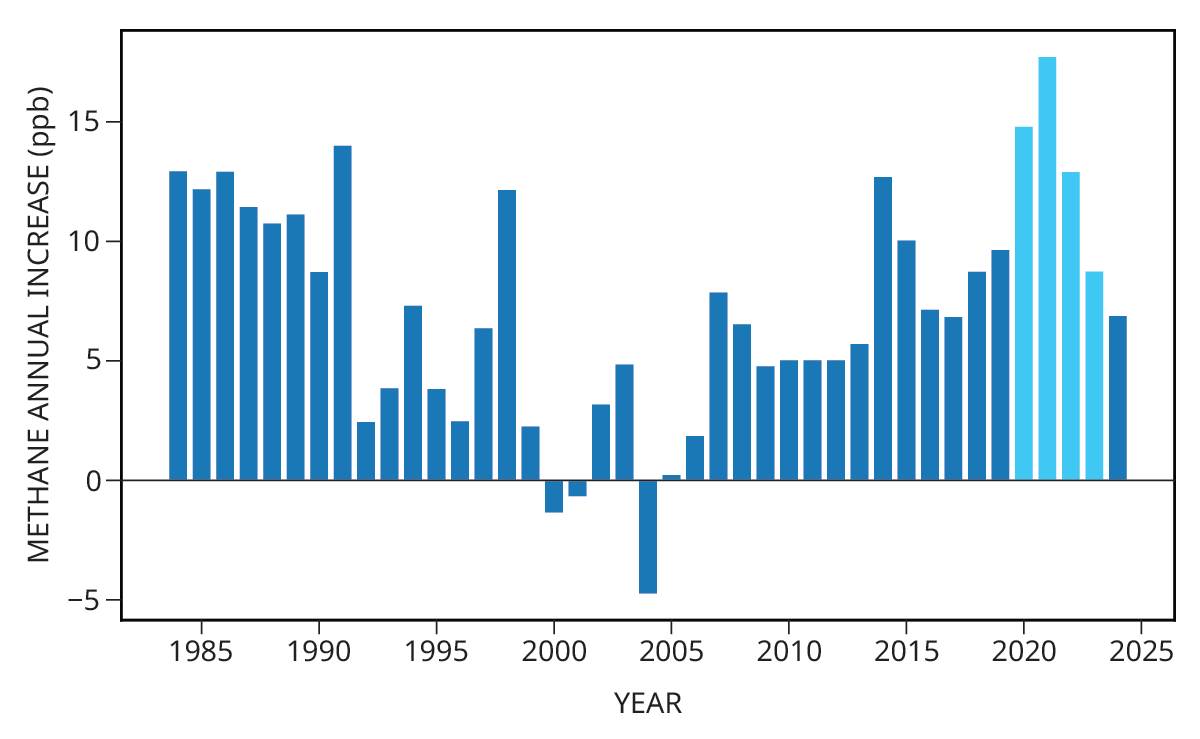
During the pandemic shutdowns that began in early 2020, the anthropogenic emissions of certain pollutants, such as nitrogen oxides, dropped—which contributed to improvements in air and water quality. Nonetheless, the concentration of atmospheric methane surged. From January 2021 to January 2022, methane levels increased by 17.7 ppb, according to NOAA data, 1 the largest annual increase in the roughly 40 years that NOAA’s Earth system research laboratory has measured methane (see figure 1 ). By 2023, the annual rate of increase had fallen back to 8.6 ppb. To put that in perspective, the total concentration of atmospheric methane was about 1950 ppb as of last fall, and every 1 ppb increase is equivalent to 2.8 million metric tons of methane entering the atmosphere.
Figure 1.

In 2021, the annual rate of increase in atmospheric methane concentration reached its highest level in the nearly 40 years of NOAA measurements. Methane levels change from year to year because of a variety of factors, including changes in anthropogenic and biogenic emissions levels and the capacity of methane sinks like hydroxyl radicals.
(Image adapted from NOAA.)
Tracking methane, the second most prevalent anthropogenic greenhouse gas behind carbon dioxide, is an important yet difficult task. Understanding the rises and falls in methane concentrations requires disentangling methane sources, such as emissions from human activities like burning fossil fuels and raising livestock, and biogenic sources, like wetlands, where microbes in the soil emit methane when they break down organic material. Data about those sources are not uniformly collected, and various climate models combine and weight the data differently, so estimates of the contributions that individual emission sources make to the total amount of atmospheric methane can vary drastically.
To determine how the different factors led to the methane surge, Philippe Ciais, from the Laboratory for Climate and Environmental Sciences in France, and colleagues at various institutions in different countries analyzed several data sources. 2 For top-down inventories, they looked to the Japanese Greenhouse Gases Observing Satellite, which measures the atmospheric concentrations of carbon dioxide and methane using spectroscopy, and NOAA’s global network of ground-based atmospheric observing stations, which measure methane levels using air sampling (see figure 2 ). They also did a bottom-up inventory that looked at different ways of adding the contributions of various methane emitters. Comparing predictions from the different models allowed the researchers to determine which combination of sources was responsible for the surge.
Figure 2.

The lines (units on the left side of the graph) depict the annual change in atmospheric methane concentration as measured by NOAA ground observatories and the Japanese Greenhouse Gases Observing Satellite (GOSAT). The bars (units on the right) show how various methane sources and sinks contribute to the methane budget.
(Image adapted from ref. 2 .)
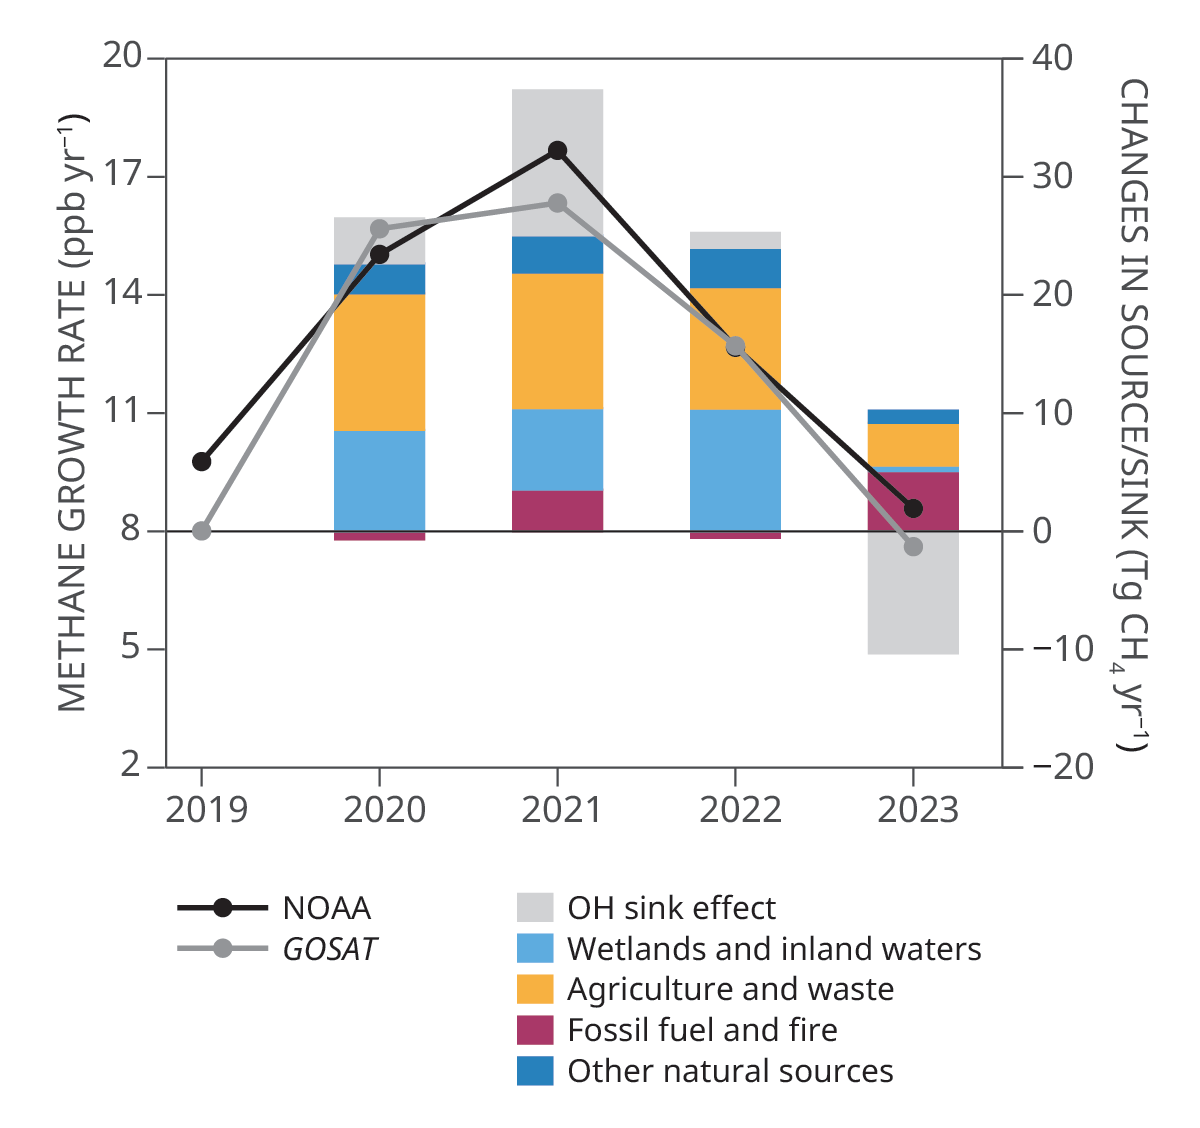
The team found that the surge was primarily caused by two factors. The dominant factor, accounting for roughly 80% of the surge, was a reduced atmospheric concentration of hydroxyl radicals, which act as a methane sink by oxidizing the pollutant and breaking it down into water vapor and carbon dioxide. The drop in hydroxyl levels was caused by the drop in emissions of nitrogen oxides during the pandemic. Nitrogen oxides catalyze a photolysis reaction in ozone that produces hydroxyl radicals. The rest of the surge is explained by an increase in wetland emissions, which was caused by a particularly warm and wet La Niña season in tropical regions of Africa and Southeast Asia. The researchers quantified the impact of the wetland emissions by comparing atmospheric-inversion models, which work backward from methane concentration levels to find emission sources, and simulations of wetlands. Eventually, a shift in conditions—increased nitrogen oxides emissions as pandemic restrictions eased and a drier El Niño season starting in 2023—brought methane levels back to an expected range.
Beyond solving the mystery of the methane surge, the findings demonstrate the need for improved monitoring and climate models, Ciais and colleagues say. They highlight urgent gaps in monitoring flooded ecosystems and methane-producing microbial processes. With improved monitoring, researchers could conduct comprehensive assessments of the methane budget in months rather than years, which would help them understand changes to methane levels while they are still underway.
References
1. X. Lan, K. W. Thoning, E. J. Dlugokencky, “Trends in globally-averaged CH4, N2O, and SF6 determined from NOAA Global Monitoring Laboratory measurements ” (2026).
2. P. Ciais et al., “Why methane surged in the atmosphere during the early 2020s ,” Science 391, eadx8262 (2026).


