Melting underneath Thwaites Glacier is more complicated than expected
DOI: 10.1063/PT.3.5213

Thwaites Glacier, located in western Antarctica (see the figure
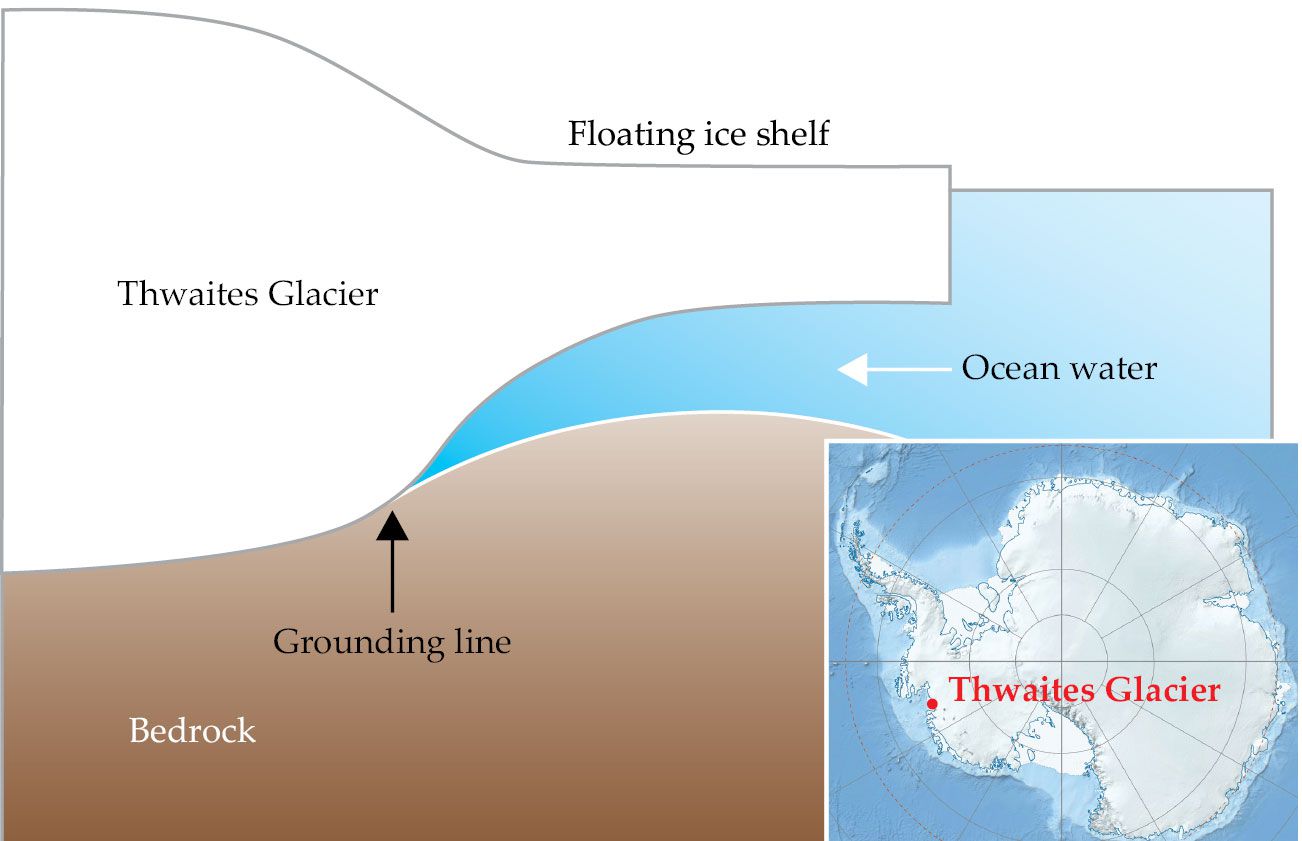
Figure 1.

Below Thwaites Glacier, in western Antarctica, the land slopes downward away from the ocean. When relatively warm water interacts with the cold ice, the grounding line beyond which the glacier is no longer supported by bedrock retreats landward, making the ice shelf extending over the ocean less stable and thus more prone to collapse. (Inset by Alexrk2, Wikimedia Commons, CC BY-SA 3.0 ; image by Freddie Pagani.)
Given the continent’s harsh conditions and remote location, most observations of Thwaites Glacier have come from satellites, radar systems, and autonomous instruments. Those data, however, offer only a limited view of what’s underneath the ice and of how fast it’s melting at the base. (For more on Antarctica’s hydrology, see the article by Sammie Buzzard, Physics Today, January 2022, page 28 .) To remedy that deficit, in 2018 NSF and the UK’s Natural Environment Research Council launched the International Thwaites Glacier Collaboration.
As part of the collaboration’s MELT project, researchers traveled to the glacier and measured the depth of the ice and the ocean’s temperature and salinity through a newly drilled borehole and the remote-controlled underwater vehicle Icefin.
In two simultaneously published papers, the team shows that although above-freezing water at the base of Thwaites Glacier is melting it as expected, the ice topography varies unexpectedly over small scales and interacts with the ocean conditions to produce highly variable melt rates dependent on location. 3 , 4 The improved measurements underneath the ice should make projections of melting and sea-level rise in glacier models more accurate and precise.
Under the radar
Glaciers are always on the move. Changing temperatures, precipitation rates, and ocean–ice dynamics all influence whether the ice accumulates or diminishes. Even changes in the predominant atmospheric winds over a glacier can help melt ice. (See Physics Today, October 2019, page 14 .)
Thwaites Glacier is especially prone to ocean-driven melting because the depth of its base increases farther inland, as shown in figure
Over time, more ice that was grounded consequently flows into the ocean, causing sea levels to rise. And eventually, the entire ice shelf may become destabilized and collapse into the ocean.
The goal of the MELT project has been to go beyond that simple explanation and study in more detail how warm waters at the grounding line are melting Thwaites Glacier and at what rate. A change in the melt rate of the base increases the glacier’s speed and drives the retreat of its grounding line. With dedicated funding from the UK and US, the International Thwaites Glacier Collaboration deployed various instruments to monitor the ice column and the underlying water.
The borehole was drilled through about 0.5 km of ice and 2 km seaward of the grounding line. Through it, a sensor collected measurements over the entire 54 m water column beneath the ice. Researchers have drilled boreholes to investigate other glaciers before but not through Thwaites Glacier. Now it has three boreholes: one drilled for the MELT project and two others drilled simultaneously for another project of the collaboration.
Compared with previous efforts, the MELT project collected more data near and around Thwaites Glacier’s grounding line. Icefin’s five expeditions below the ice, one of which reached the grounding line, gave the collaboration the opportunity to observe how the melting of the underside varies by location. Icefin was equipped with various other sensors to monitor ocean conditions and measure the ice base. In addition to those data, a ground-based, phase-sensitive radar system measured the basal melt rate.
Rough topography
Data from the borehole profiler and the nearby measurements collected by Icefin show water temperatures around −0.8 °C at the glacier’s base. The water temperature steadily increases with distance from the ice and reaches 0 °C at the ocean bottom farther from land. To help quantify melting, a useful metric is thermal driving—the difference between the ocean temperature and the in situ freezing point. (The in situ freezing point is affected by salinity and pressure.) As expected for Thwaites Glacier, the thermal driving of about +1.5 °C near the base is strong enough to trigger melting.
Although melting was expected, Britney Schmidt of Cornell University and colleagues report several surprising features that were discovered at a small region of the glacier that extends laterally for a few kilometers. 3 The bottom of the ice is characterized by a rough topography of ridges, crevasses, steplike terraces, and other structures. Coauthor Peter Davis, of the British Antarctic Survey, says, “We’ve seen in data before that these sorts of structures exist, but this is the very first time that we’ve been able to visually image them in such a critical region. They’re just right there.”
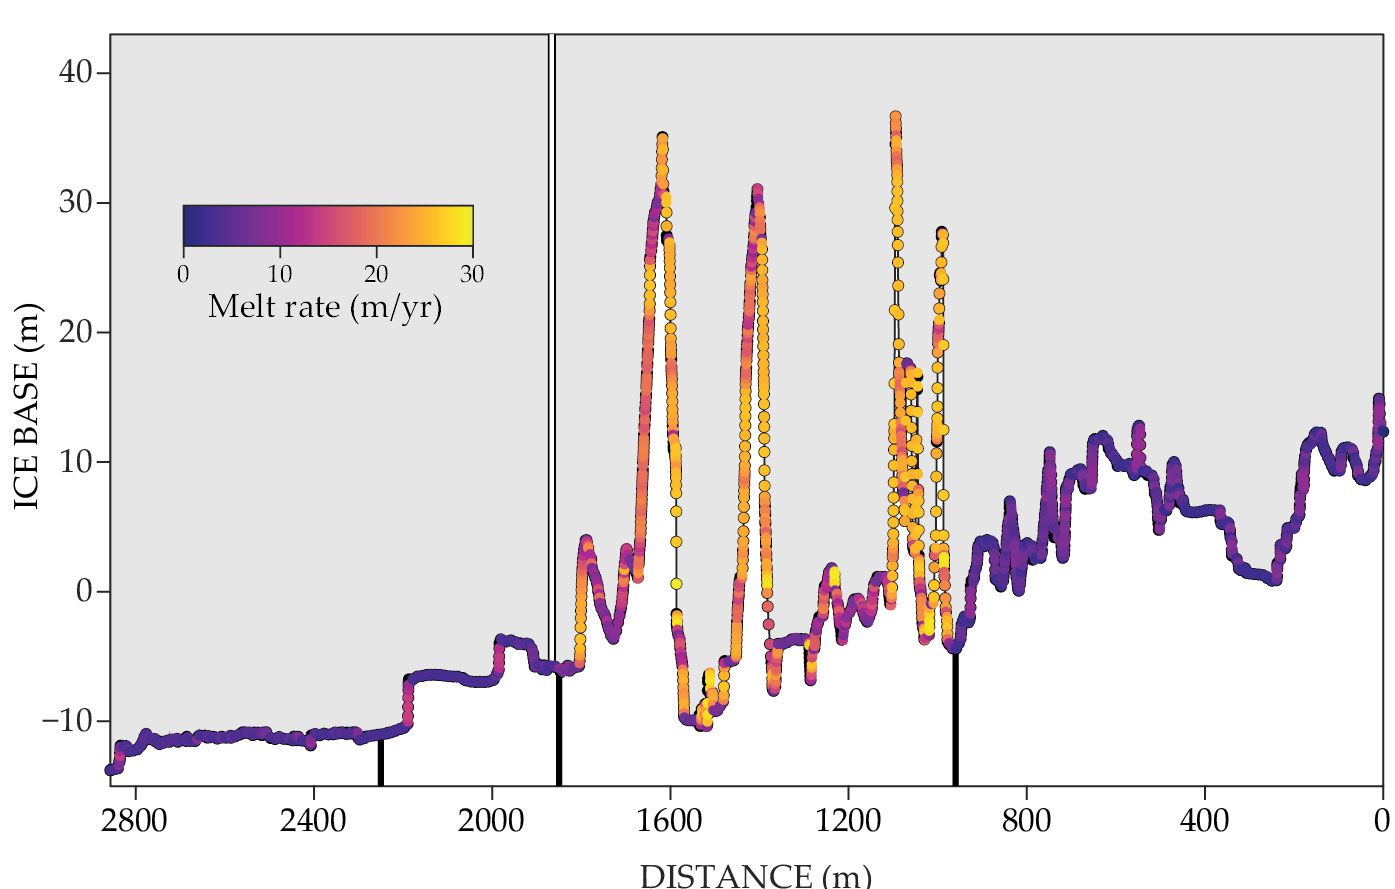
The highest melt rates were measured along some of the steep ice faces found in crevasses, as shown in figure
Figure 2.

Thwaites Glacier is melting at its base, but the rate varies substantially depending on the underside’s topography. The steep, near-vertical faces of large crevasses are melting more quickly than steplike terraces and flat regions of the ice base because of more mixing of warm, salty ocean water with cold freshwater from the ice. (Adapted from ref.
Models need improvement
Not only do the observations reveal heretofore unseen topography of Thwaites Glacier, but they also act as critical benchmarks for evaluating ice models. In the absence of concrete data on the glacier’s basal conditions, modelers simulated melting ice by assuming the presence of turbulent, well-mixed water, which was found only in the areas with steep ice faces. In that turbulence regime, melting rates—and by extension, sea-level projections—depend on a combination of the water’s flow velocity and its thermal forcing on the ice.
Under those assumptions, models predicted that Thwaites Glacier is melting at a rate of 14–32 m/yr, which is an order of magnitude higher than the 2–5 m/yr observed for the flat parts of the ice base by the new papers. Davis and colleagues argue that the discrepancy arises because the models didn’t account for the observed density stratification in the ocean beneath the flat regions on the underside. 4
“Unfortunately, we cannot consider our results to be ‘good news’ or optimistic,” says Davis. “The grounding line is still retreating rapidly, and our results don’t change that fact. Instead, they show that grounding-line retreat beneath Thwaites can be driven by weaker basal melting than previously expected.”
Atmospheric convection, turbulence, ocean heat transport, and other complexities that affect glaciers and sea ice have made it difficult to model the climate of polar regions. (See the article by Tapio Schneider, Nadir Jeevanjee, and Robert Socolow, Physics Today, June 2021, page 44 .) With observations from the new work and other studies, though, models should soon be more representative of real-world processes and capable of offering more precise estimates of future sea-level rise.
References
1. A. G. C. Graham et al., Nat. Geosci. 15, 706 (2022). https://doi.org/10.1038/s41561-022-01019-9
2. H. Yu et al., Geophys. Res. Lett. 46, 14539 (2019). https://doi.org/10.1029/2019GL084066
3. B. E. Schmidt et al., Nature 614, 471 (2023). https://doi.org/10.1038/s41586-022-05691-0
4. P. E. D. Davis et al., Nature 614, 479 (2023). https://doi.org/10.1038/s41586-022-05586-0
More about the authors
Alex Lopatka, alopatka@aip.org


