In the Great Lakes, heat waves and cold spells are on the rise
DOI: 10.1063/pt.usyu.seby

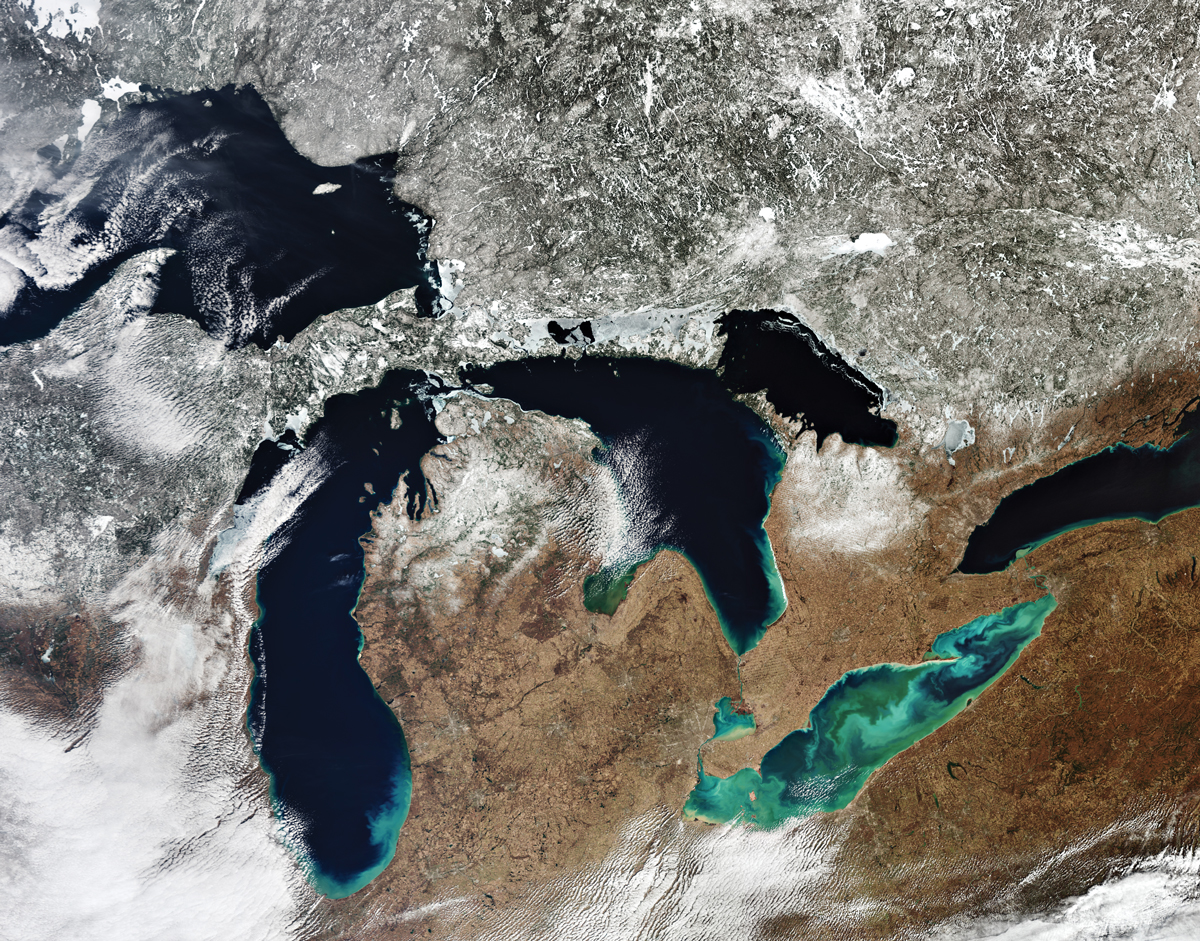
Figure 1.

The five Great Lakes, captured in this satellite image from 15 March 2020, form the largest lake system in the world, and they exert considerable influence over the regional climate. Analysis of long-term climate data reveals that large-scale ocean circulation patterns, including El Niños, have driven changes in the temperatures of the inland lake system. (Image created from modified Copernicus Sentinel data and processed by the European Space Agency/CC BY-SA 3.0 IGO .)
A record-setting cold snap hit portions of North America in the first few months of 2014 when a disruption of typical atmospheric circulation patterns extended the range of the polar vortex southward. The prolonged cold spell lowered the surface temperatures of the Great Lakes (shown in figure
Extreme temperature events leave less time for adaptation than do incremental changes, and they can have radiating effects on water levels, regional climate, and fishery and ecosystem health. Those widely felt impacts motivated Hazem Abdelhady, of the Cooperative Institute for Great Lakes Research at the University of Michigan, and colleagues to take a deeper look at how climate change has affected the frequency and intensity of extreme events.
Comprehensive lake surface temperature data collected by satellites go back only to 1995, so Abdelhady and colleagues turned to another dataset that goes back to 1940. Produced by the European Centre for Medium-Range Weather Forecasts, the ERA5 dataset assimilates historical weather and climate data into physics-based models to estimate historical weather conditions and fill in gaps in global coverage. The dataset was the input to a 3D model of the Great Lakes that accounts for hydrodynamics of the lakes and atmosphere, heat fluxes, ice formation, and albedo changes.
With their model, Abdelhady and colleagues compiled a detailed estimate of lake surface temperatures going back eight decades, as shown in figure
The researchers’ analysis revealed connections to distant, larger-scale climate systems. Lake Erie and Lake Ontario both shifted to a phase of greater cold extremes in the mid 1970s, corresponding to a major shift in Pacific Ocean temperature patterns in 1976 that yielded two decades of warmer water off the northwest coast of North America. And all the lakes moved into a phase of more intense heat waves starting in the 1990s. The researchers attribute that phase shift to a record-setting El Niño event in 1997–98.
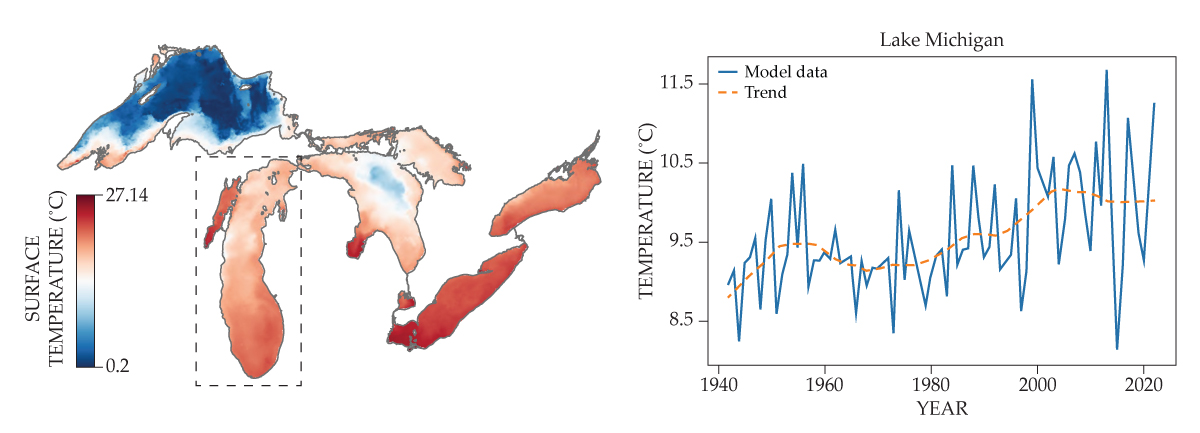
Figure 2.

A snapshot of lake surface temperatures from 18 July 2018 (left) from the hydrodynamic–ice model used by researchers to reconstruct the past eight decades of Great Lakes water temperatures. A graph of the average lake surface temperatures for Lake Michigan over the past 80 years (right) shows both extreme events and a longer-period trend. (Figure adapted from H. U. Abdelhady et al., Commun. Earth Environ. 6, 375, 2025 .)
“The Great Lakes got very, very warm, and they stayed warm all the way until that Arctic polar vortex in 2014,” says Andrew Gronewold, who leads the Global Center for Climate Change and Transboundary Waters and was part of the research team.
“It gets at this idea that some of the changes we experience in the Great Lakes as a consequence of global warming are happening in abrupt shifts rather than as a long-term trend,” says Gronewold. “From a management and adaptation perspective, that makes a huge difference for our lives, for our safety, and for ecological health.” Funding and using forecasts of such shifts could provide guidance for policymakers to inform adaptation strategies for future changes. (H. U. Abdelhady et al., Commun. Earth Environ. 6, 375, 2025 .)
This article was originally published online on 2 July 2025.
More about the authors
Laura Fattaruso, lfattaruso@aip.org


