Gamma-Ray Images Uncover Solar Flare Surprises
DOI: 10.1063/1.1620822
Though they didn’t know it at the time, Galileo and his 17th-century rivals were the first to observe the sites of solar flares. What they saw through their crude telescopes were sunspots—dark patches on the solar disk where intense magnetic fields smother the upwelling of bright hot plasma.
Flares erupt near sunspots and hurl electrons and ions into the Sun’s atmosphere. When viewed with modern instruments in the UV and soft x-ray wavebands, sooty sunspots blaze in roiling turmoil.
According to decades of observation and theory, flares are fueled by twisted magnetic fields that snap into untwisted, lower-energy configurations (see Eugene Parker’s article in Physics Today, June 2000, page 26 ). But how pent magnetic energy propels electrons and ions remains a puzzle. Solar physicists expect a flare’s initial impulse to show up as gamma rays. Only recently, thanks to the launch last year of NASA’s Reuven Ramaty High-Energy Solar Spectroscopic Imager (RHESSI), could images of the Sun be obtained at such high energies.
On 23 July 2002, the Sun flared so brightly that a team led by Gordon Hurford of the University of California, Berkeley, was able to map the electrons’ and ions’ separate contributions to the gamma-ray emission. Hurford’s analysis of the maps has sent solar theorists back to their blackboards, notepads, and computers: Against expectations, the emission regions don’t coincide. 1
Spectroscopic imaging
Reflecting telescopes can’t focus gamma rays. Even at grazing incidence, optical surfaces absorb rather than reflect high-energy photons. To map the Sun at high energies, RHESSI relies on rotating modulation collimators.
An RMC is a pair of widely separated coaligned grids that rotates over the field of view. RHESSI has nine RMCs, each with a different grid spacing, or pitch. Together, their angular resolution ranges stepwise from 2.3 to 183 arcseconds. (The Sun is 1900 arc-seconds across.) The rotation comes from the spacecraft itself, which spins on its axis 15 times a minute.
To see how an RMC generates positional information, look at figure 1. Consider radial position first. The spot on the solar disk marked with a square is farther from the grid’s axis of rotation than the spot marked with a circle. When the grid makes one rotation—which you can mimic by running your finger along the dashed circles—the grid’s slats shadow the circle 7 times and the square 11 times: a telltale difference.

Figure 1. A rotation modulation counter yields positional information because of differences in the way the opaque grids shadow locations on the Sun.
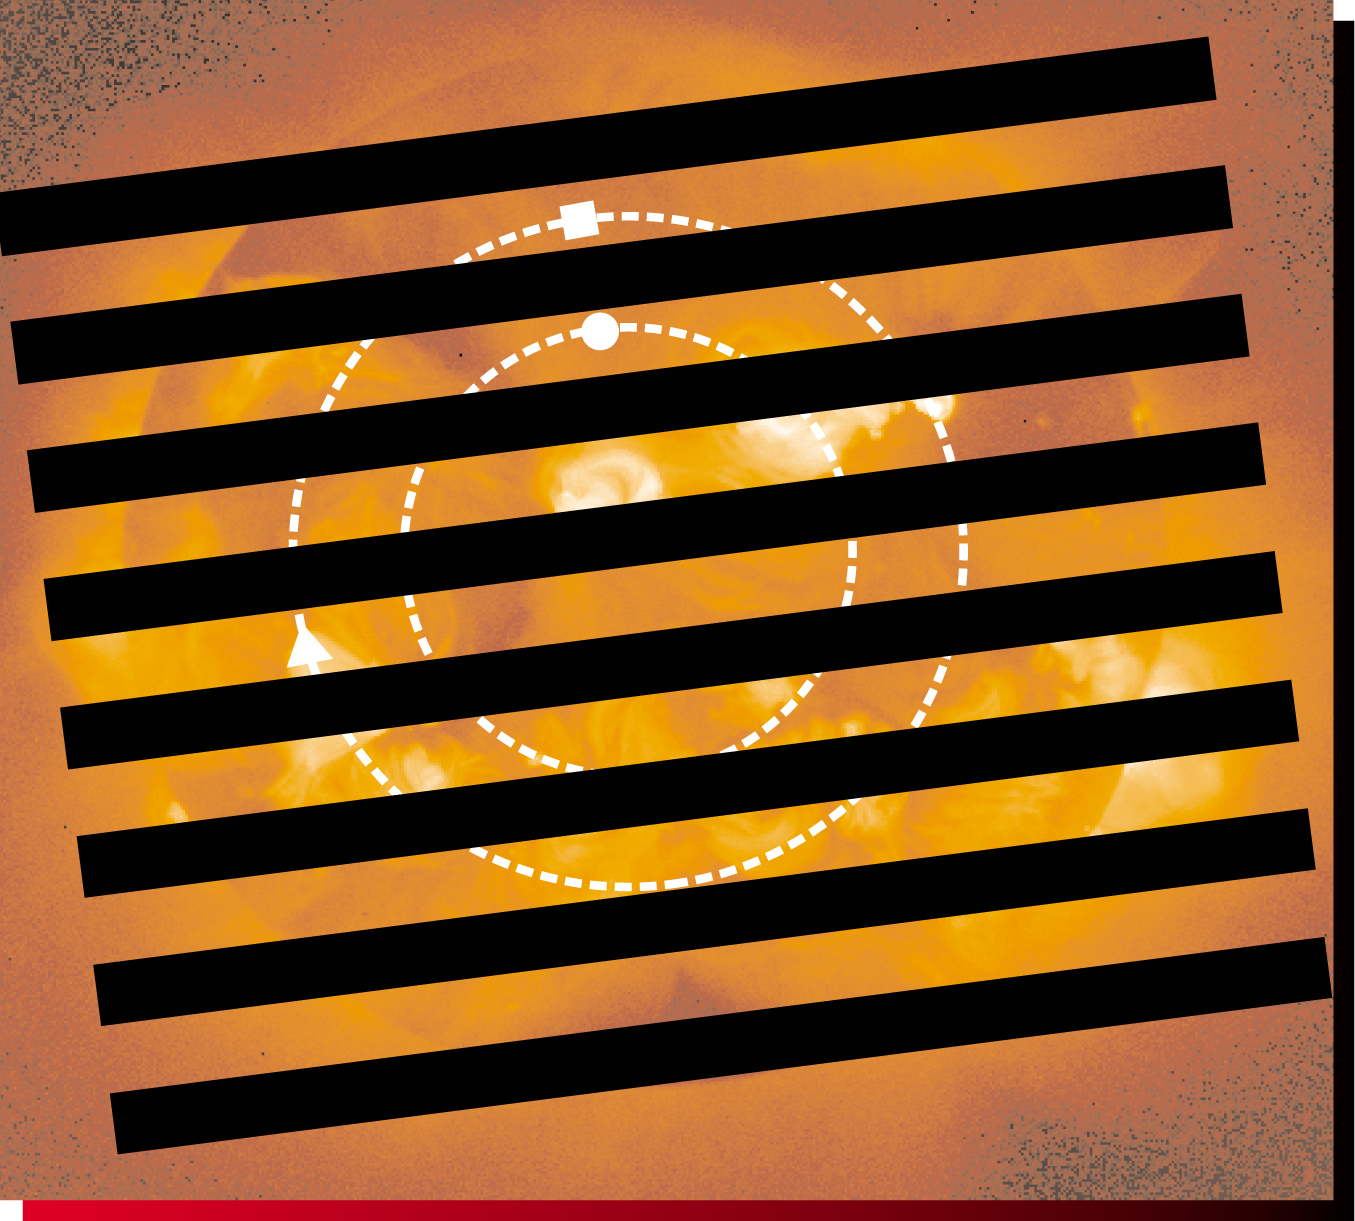
For azimuthal position, compare the square with the triangle. Both spots are at the same radial distance, but at the rotation phase in the figure, the square remains unshadowed for longer: another telltale difference.
Figure 1 doesn’t tell the whole imaging story. A square-spot photon has a different incident angle from a circle-spot photon. Whereas both photons may pass through the front grid, one, both or neither may be blocked by the coaligned back grid. As the grids rotate, photons from a particular spot pass through both grids with an oscillating likelihood.
The detectors that sit behind RHESSI’s RMCs record each photon’s energy and arrival time. The resulting data can therefore be treated as the sum of light curves whose peaks vary in number, amplitude, and phase. Drawing a map from such data entails creating a probability distribution of where, given the location of the grids, each spot could be. Fourier analysis yields a map, whose intrinsic artifacts are removed by applying image-cleaning algorithms borrowed from radio astronomers.
RHESSI’s passband extends from 3 keV to 17 MeV. Over that range, a flare’s photon flux plummets by 12 orders of magnitude. Determining even a continuum slope requires high spectral resolution, which RHESSI achieves with detectors based on ultrapure crystalline germanium.
When photons are absorbed by the germanium, they generate a number of electron–hole pairs proportional to their energy. An electric field of 30 kV/m accelerates the charges to create a measurable current. Cooling the germanium to 75 K lowers the noise and boosts the sensitivity.
With a resolution of around 0.1% in the MeV range, RHESSI can resolve the intrinsic widths of individual gamma-ray lines. It can also map the lines—which is how RHESSI made its discovery.
Seeing electrons and ions
A large flare lasts several hours, extends over 108 meters, and dumps 1025 joules of energy into the Sun’s corona. In the flare’s initial impulsive phase, much energy goes into rapidly accelerated electrons and ions. When the electrons slam into ambient plasma, they lose most of their energy to Coulomb collisions. Minutes to hours later, the collisonal energy emerges as thermal radiation.
The rest of the electrons’ energy—a mere hundred thousandth—promptly appears as high-energy nonthermal bremsstrahlung. This radiation offers the best opportunity for seeing what the electrons are up to during the impulsive phase.
Like the electrons, the accelerated ions slam into ambient plasma and undergo Coulomb collisions. But they don’t make much observable bremsstrahlung. The best way to catch the ions in the early phase of a flare is through their gamma-ray line emission.
When RHESSI researchers analyzed the spectrum of the 23 July flare, they found that nonthermal electron bremsstrahlung predominated in the 0.3–0.5 and 0.7–1.4 MeV bands. In other gamma-ray bands, they found a mix of electron and ion emission.
They also saw a bright narrow line at 2.223 MeV. This line, predicted to occur in flares by RHESSI’s dedicatee, Reuven Ramaty, is an aftereffect of ionic collisions. Accelerated ions knock out neutrons from ambient ions. Once slowed by thermalization, ejected neutrons can be captured by ambient protons to make deuterium ions and 2.223-MeV gamma rays. Although the thermalization is somewhat slow, the line serves to locate the impulsively accelerated ions because the neutrons don’t stray far. Filtering RHESSI data through a narrow energy window of 2.218–2.228 MeV yields a rich, barely adulterated clutch of capture-line photons.
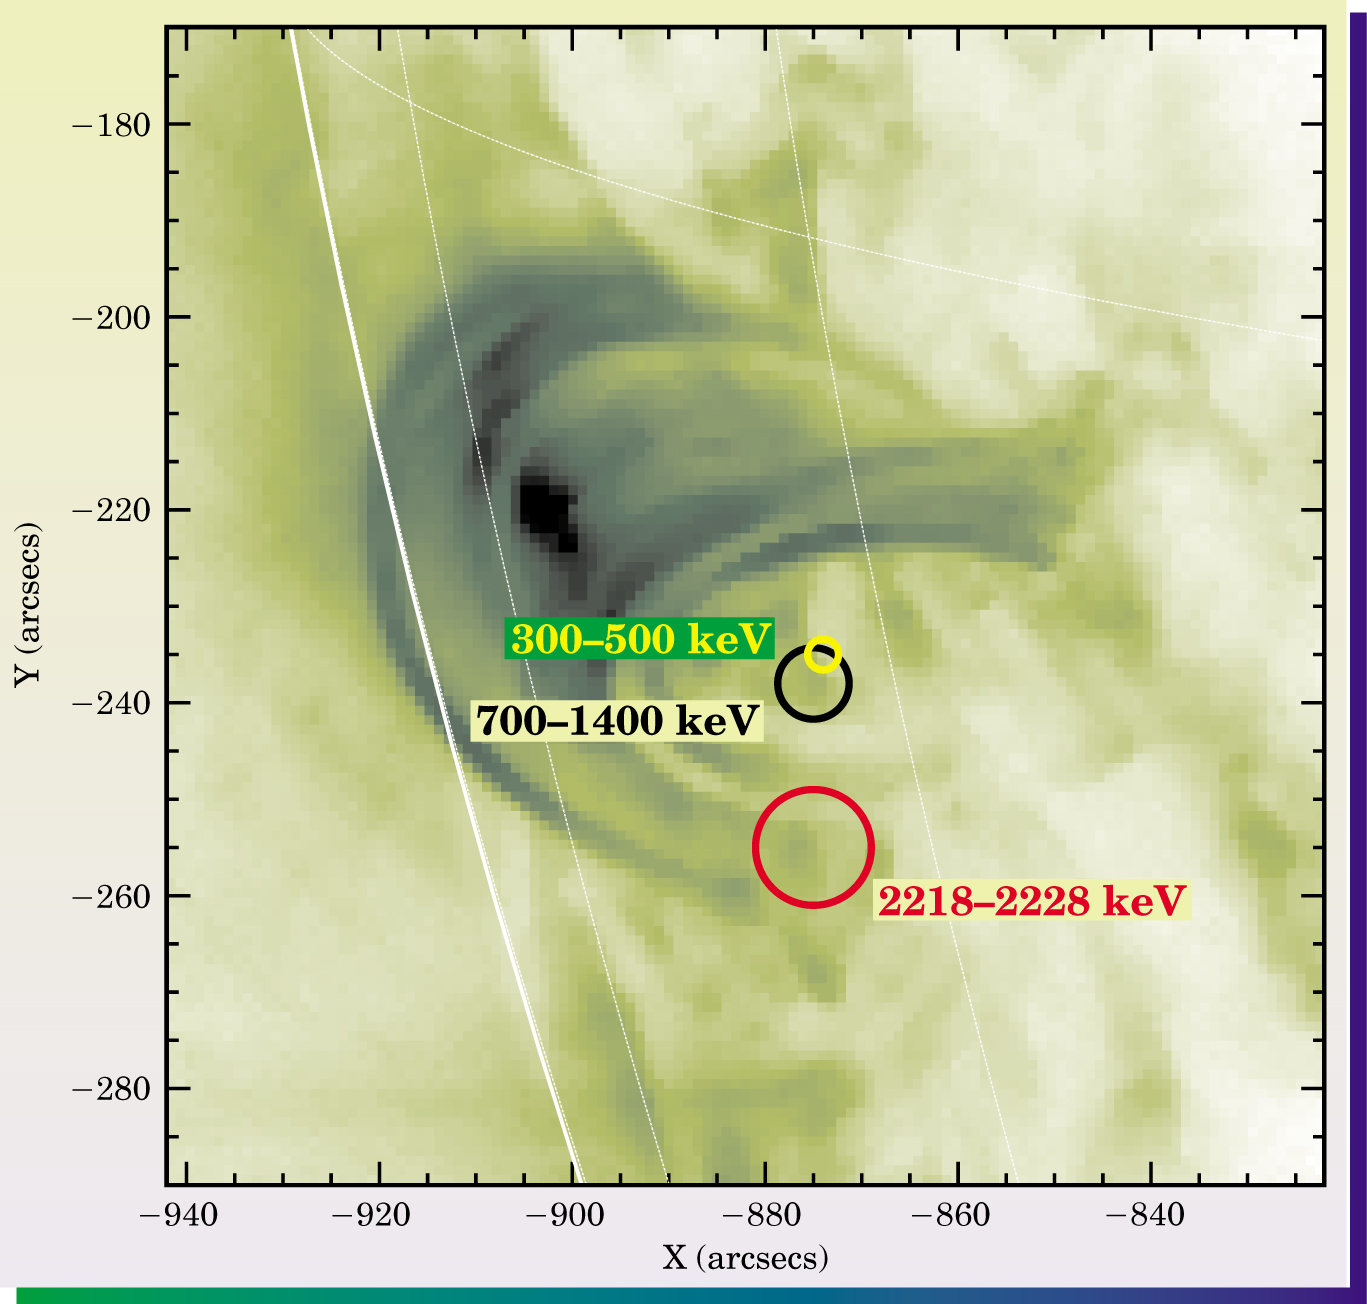
Figure 2 shows RHESSI’s view of the 23 July flare in three energy bands: the deuterium neutron capture line (red) and two bands that pick out the electrons’ nonthermal brems-stralung (yellow and black). Appearing in the background is a UV image of the flare taken by TRACE, another NASA observatory.

Figure 2. The 23 July 2002 flare as seen in gamma rays by RHESSI (colored circles) and in the UV by TRACE (background image). Also shown are lines of solar latitude and longitude (thin white lines) and the Sun’s edge, or limb (thick white line). The separation of the red circle from the yellow and black circles indicates that ions and electrons were accelerated at different locations during the flare’s impulsive phase.
(Courtesy of Sam Krucker and Gordon Hurford, University of California, Berkeley.)
Only two of RHESSI’s RMCs—those with resolutions of 35 and 183 arcseconds—are thick enough to block gamma rays. Even so, RHESSI could show, with high confidence, that the sites where accelerated electrons and ions first radiate are spatially distinct.
Short and long loops
Although RHESSI is the first spacecraft to image solar gamma rays, previous observations revealed that emission from electrons and ions has similar temporal behavior, which suggests a common acceleration mechanism. What could it be?
One clue comes from the looping magnetic fields that reach high into the corona. The fields are so strong that they forcibly entrain not only ambient plasma, but also the accelerated particles that hit and heat it. If the acceleration mechanism is a DC electric field, electrons and ions will set off in opposite directions along the same magnetic field lines. The corresponding emission regions won’t be in the same location, but they will be threaded by the same magnetic loop.
The loops in the TRACE image follow the flare’s magnetic field lines, but not until 90 minutes after the initial impulse when the kinetic energy of the accelerated particles emerges in the UV. Loops do move during flares, but not always by much. If the TRACE image reflects the loop configuration during the impulsive phase, then the electrons and ions don’t belong to the same loop.
If not DC acceleration, then what? Gordon Emslie and Jim Miller of the University of Alabama in Huntsville think a stochastic mechanism could be at play. Turbulent, magnetohydrodynamic jostling can accelerate electrons and ions alike, but at different rates. Miller’s numerical models, which predate the 23 July flare, suggest that ions are more favorably accelerated in long, high loops, whereas electrons prefer short, low loops.
Observing more gamma-bright flares could settle the issue, but time is running out. The Sun is already halfway toward reaching the minimum of its 11-year sunspot cycle.
References
1. G. J. Hurford et al., http://sprg.ssl.berkeley.edu/~ghurford/Gammaimage.pdf This, and other RHESSI papers, will appear in a special issue of Astrophysical Journal Letters.


