Flows of volcanic rock and gas ride a carpet of air
DOI: 10.1063/PT.3.4221

Mount Vesuvius erupted in 79 CE with little warning. The volcano’s pyroclastic flows—hot avalanches composed of air, ash, and rock—obliterated everything in their path. The Roman cities of Pompeii and Herculaneum and the remains of about 1500 people were later excavated from under several meters of ash. In contrast to the viscous, ambling lava flows of other volcanoes, such as Mauna Loa in Hawaii, pyroclastic flows cruise across land at speeds of about 10–30 meters per second for tens of kilometers without slowing down.
Pyroclastic flows have long perplexed volcanologists. Given volcanic particles’ high static friction, they should stay put on slopes of up to 35–45°. But scientists have observed pyroclastic flows traveling over land surfaces with average slopes of just 8° and sometimes even upslope for short distances.
Volcanologists can’t easily measure the physical properties of pyroclastic flows in the environment because of the danger to people and the destruction of field instruments. Instead, researchers turn to numerical models. For a few decades, high pore pressure—that is, the pressure in the space between particles—was suspected of modifying frictional forces. But without a clear understanding of how pyroclastic flows generate and sustain pore pressure, scientists couldn’t conclusively test the hypothesis. Rather than explicitly simulate the dynamical evolution of pyroclastic flows, modelers had to resort to using empirically derived friction coefficients to fit models to observations.
Now Gert Lube of Massey University in New Zealand, Eric Breard of the University of Oregon, and their colleagues have identified the source of pyroclastic flows’ friction-defying capability. In New Zealand, Lube oversees a laboratory facility known as PELE—for pyroclastic flow eruption large-scale experiment—that can safely create large flows. The researchers discovered a low-pressure, dilute air layer at the base of pyroclastic flows that reduces internal and ground-surface friction. 1
Paying tribute to PELE
Before PELE, researchers built miniature volcanic eruptions in the lab. Volcanologists at the University of Clermont Auvergne in France sent volcanic ash deposits down a 3 m flume to measure particle velocities. 2 At the University of Bari Aldo Moro in Italy, gas and ash erupted out of a human-made volcanic chimney. 3 Those and other, similar experiments have helped uncover the turbulent dynamics of pyroclastic flows, but challenges in scaling from real life to the benchtop have limited what scientists can learn about the friction-defying capability of pyroclastic flows. To understand how flows modify friction on a downscaled system, says Lube, “you need to make sure the balance of forces is on the same range as they would be in nature.”
Another problem that researchers have had with laboratory-scale eruption analogues is with measuring certain flow properties, because they use less material over shorter distances than nature. The pressure in the flow, for example, can diffuse too fast for sensors to measure it. After some earlier small-scale efforts, says Lube, “it was clear in the volcano community that we needed to do our experiments at a large scale.”
So in 2011 Lube and some collaborators began designing a larger facility at Massey. Breard joined the team as a graduate student in 2012 when the construction started. PELE operates by combining air, heated up to 130 °C, with 1000–1300 kg of rock and ash collected from the last eruption of New Zealand’s Taupo volcano, more than 1800 years ago. The mixture falls freely down a 9 m vertical column to a chute that creates 10-m-high pyroclastic flows that can run horizontally for 25 m. Using high-speed cameras, pressure sensors, and load cells along the chute, Lube and Breard can capture the time-evolving velocity, pore pressure, and mass of the experimental flows.
“We were surprised when these flows moved out like a liquid,” says Lube. “We knew from that moment that we have this process, and now we just need to look inside and measure it.” By assuming that a flow’s mass and volume are conserved over distances of a few centimeters, Lube, Breard, and their colleagues could analyze variations in the flow’s kinetic and potential energy by measuring its height and velocity. With that information, they calculated the time-varying effective friction coefficient that represents both the internal friction between particles in the flow and the friction between the flow and the bottom of the chute.
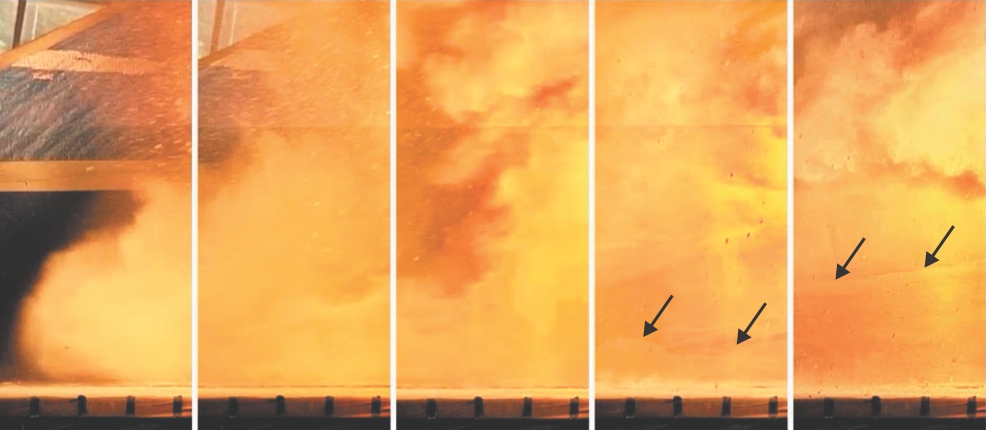
PELE produces two-layer pyroclastic flows consisting of a denser particle layer overridden by a dilute, turbulent layer. The series of images in figure
Figure 1.

The volcano eruption simulator facility at Massey University in New Zealand produces experimental pyroclastic flows—hot avalanches composed of air, ash, and rock—that allow the study of their dynamical behavior. In this series of images spanning about a second, the bottom meter of a two-layer flow passes a fixed observation point. The arrows denote the boundary between a denser particle layer overridden by dilute, turbulent ash.
A mechanism revealed
Breard recounts an idea from coauthor Jim Jones, a chemical engineer at Massey, that led the team to consider how an air layer could act as a lubricant for a pyroclastic flow: “When we discussed changes in particle concentration, he thought we needed to discuss how shear changed through the flow.” A pyroclastic flow tends to behave like a fluid. Normally in a fluid, the air moves parallel to the flow direction, and high pressure at the base eventually forces the less dense air up and out of the two-phase flow, stopping the fluid in its tracks. But in a pyroclastic flow, shearing can stall that process.
If the shear rate changes with depth and keeps the air longer in the flow, the pressure gradient can change too. In that situation, a low-pressure air layer develops at the base and drives air downward while solid material hovers above. As figure
Figure 2.

Pyroclastic flows glide across the ground surface on hot air. The blue, red, and green lines denote the flow properties at 380 ms, 690 ms, and 1290 ms, respectively, at a static observation point. The measured shear rate (a) varies with the height of the flow by three orders of magnitude and (b) forms a pressure maximum a few centimeters above the flow’s base. The resulting pressure gradient (c) moves air downward toward the lower-pressure area, effectively lowering the particle concentration and decreasing friction so that pyroclastic flows can travel at high speeds for long distances.
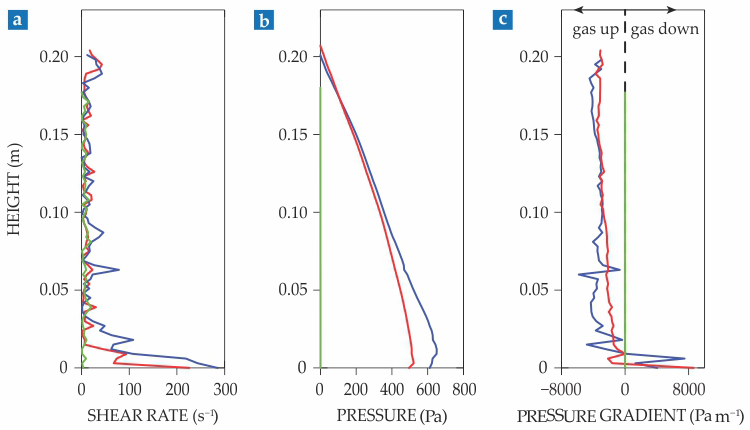
In particle–gas flows, the gas responds more quickly to pressure gradients than the particles do. As the pressure gradient drives the air toward the lower-pressure basal layer as shown in figure
“The role of air was proposed decades ago based on studies where air is injected into the base,” says Olivier Roche, a volcanologist at the University of Clermont Auvergne. The novelty of this study, he says, “is the demonstration that pore-gas pressure can arise in the experimental flow.” Such results would not have been seen without the high velocities and shear rates produced by the large-scale experiments.
Now that volcanologists understand the main physical process for how pyroclastic flows affect friction, natural-hazard modelers may be able to develop better simulations. “More complex models showing the formation of pore pressure and how long it can be sustained should be more accurate” than earlier models, says Breard. Where a pyroclastic flow goes depends mostly on the topography, but Breard says that new models that incorporate the air-layer mechanism may be able to make more precise estimates of the distances that pyroclastic flows travel.
Volcanoes in Chile, Nicaragua, and other places in Central and South America pose dangerous hazards. The 3 June 2018 eruption of Volcán de Fuego in Guatemala produced pyroclastic flows that buried nearby towns, killing and injuring dozens of people. With improved numerical models, “you can train people to use them and convey to people the information in the danger area,” says Breard. “Those hazard models are used by researchers who ought to ensure that populations living in these volcanically active areas know about them and their predictions.”
References
1. G. Lube et al., Nat. Geosci. 12, 381 (2019). https://doi.org/10.1038/s41561-019-0338-2
2. L. Girolami et al., Bull. Volcanol. 72, 747 (2010). https://doi.org/10.1007/s00445-010-0356-9
3. P. Dellino et al., J. Geophys. Res. Solid Earth 112, B04202 (2007). https://doi.org/10.1029/2006JD007501
More about the authors
Alex Lopatka, alopatka@aip.org


