A close-up look at an unusually powerful gamma-ray burst
DOI: 10.1063/PT.3.2261
Gamma-ray bursts (GRBs) that signal the explosive collapse of distant, very massive stars are detected almost daily by a variety of orbiting telescopes. But last April’s GRB 130427A, first spotted by NASA’s Fermi Gamma-Ray Space Telescope, was extraordinary in two respects. Its total radiant output ranks it among the half dozen most energetic GRBs ever recorded. And, more important, its surprisingly modest redshift (z = 0.34) places it a mere 5 billion light-years away. It was five times closer than a typical GRB and was, by far, the closest of the hyperenergetic ones.
That happy coincidence—estimated to occur only once or twice a century—has allowed only Fermi and a number of x-ray and optical telescopes to examine the initial burst and its afterglow in unprecedented detail. The observations, recently reported in five papers, 1 , 2 , 3 , 4 , 5 suggest that GRB 130427A is not atypical among hyperenergetic GRBs. But the serendipitous close-up looks have revealed details that challenge the prevailing scenario of how GRBs generate their prompt and longer-term emissions across the electromagnetic spectrum.
Spectacular collapses
Except for a minority subclass characterized by ultrashort burst duration, every GRB is thought to manifest a stellar collapse that results in the creation of a black hole and explosive outward flow of high-energy radiation and ionized material (see Physics Today, August 2005, page 21 ).
A GRB’s output in gamma-ray, x-ray, and optical photons can roughly be divided into two phases—one or more prompt pulses followed by smoothly decaying afterglows. The prompt output reflects interactions within the collapsing system itself: quasithermal radiation from the initial fireball, sporadic accretion onto the new black hole, and interactions of jets of relativistic plasma and high-energy photons that have been collimated by the black hole’s accretion disk.
The afterglows, by contrast, are thought to begin when the shock fronts of the jets first reach the parent star’s boundary with the interstellar medium (ISM). Only after that emergence are the highest-energy gamma-ray photons generated, with energies exceeding 1 GeV.
A GRB is detected only if one of its jets points roughly in the observer’s direction. Two different detector systems aboard Fermi are specialized for detecting, respectively, a GRB’s prompt and afterglow gamma radiation. 1 The Gamma Burst Monitor (GBM) is a set of crystal scintillation detectors arrayed around the spacecraft to continually monitor the entire sky for sudden profusions of photons with energies from 10 keV to 10 MeV.
It was the GBM that first recognized GRB 130427A. Its signal automatically triggered a spacecraft-slewing maneuver that locked Fermi’s Large Area Telescope (LAT) onto the new GRB. Fermi’s principal instrument, LAT detects gamma rays by the electron–positron pairs they create. Its effective collecting area is about a square meter, sensitive to photon energies from 20 MeV to 300 GeV. (See the article by David Thompson, Seth Digel, and Judith Racusin in Physics Today, November 2012, page 39 .)
The highest-energy photons
Figure 1a shows the energy fluxes recorded by the GBM and LAT as a function of time since GRB 130427A’s trigger. For the first 20 seconds, the spiky, episodic GBM signal of relatively low-energy gammas dominated the energy outflow. Then, presumably marking the emergence of the shock front, came the peaking and gradual decay of the energy outflow via the high-energy gammas recorded by LAT. Because the GRB was so energetic and so close, LAT was able to follow its gamma-ray afterglow for an astonishing 20 hours—with interruptions when the GRB was occulted by Earth. The previous record was less than two hours.

Figure 1. Evolution of the gamma-ray and x-ray output of the gamma-ray burst GRB 130427A. (a) Shown are fluxes of photons recorded in the indicated energy ranges by the Fermi Gamma-Ray Space Telescope’s Gamma Burst Monitor (GBM) and Large Area Telescope (LAT), and by the Swift x-ray telescope. The x-ray and LAT afterglows, which begin around 20 s, have similar decay rates, interrupted near 200 s by a transient reactivation of the GRB’s central engine. (b) Individual energies and arrival times recorded by LAT are plotted for the roughly 200 photons with energies above 100 MeV. Red data points indicate the highest-energy photon in each time bin. Several of those violate the standard theory’s time-dependent upper limit on GRB photon energies. (Adapted from ref.
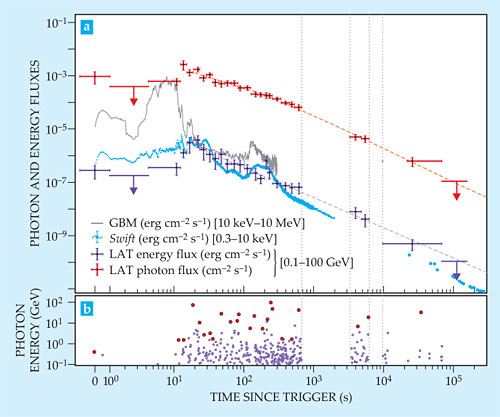
LAT records individual high-energy photons. Figure 1a displays its measurement of GRB 130427A’s photon-number flux. But the GRB’s biggest single surprise is reserved for figure 1b, which shows the energies and times of the several hundred photons recorded by LAT.
Until GRB 130427A came along, the nonthermal gamma-ray, x-ray, and optical afterglows of “classical” GRBs—that is, all but the short-burst subclass—had been adequately described by a standard scenario: When the jet shock fronts emerge into the ISM, their turbulent magnetic fields, carried along by the highly relativistic plasma, can raise ambient electrons to very high energies by Fermi acceleration—iterative boosts by repeated bouncing across the advancing shock front. The subsequent helical motion of the accelerated electrons in the magnetic fields generate photons with energies ranging from eV to GeV by synchrotron radiation.
The stepwise Fermi acceleration and subsequent energy loss by synchrotron radiation occur on the same time scale—namely, the electron’s Larmor orbital period in the magnetic field B. That period is inversely proportional to B. But the equality of the presumed acceleration and deceleration time scales makes it possible to calculate, without knowing B, a time-dependent theoretical upper limit on the photon energies that can be generated by the standard scenario.
For GRB 130427A’s afterglow profile, that theoretical upper limit falls from about 40 GeV at 10 seconds after the trigger to 4 GeV at 24 hours. Those limits are most strikingly violated by two entries in figure 1b: a 95-GeV photon recorded at 244 seconds and a 32-GeV photon recorded at nine hours (3.2 × 10⁴ seconds).
”So something’s wrong with the standard synchrotron-radiation scenario,” says Fermi-team theorist Charles Dermer (US Naval Research Laboratory). “But we don’t want to scrap entirely a model that has explained so much GRB data in the past and still explains this one’s x-ray afterglow and most of its afterglow in gammas.”
Theorists are considering additional mechanisms that might generate the “forbidden” afterglow-photon energies. Perhaps, for example, some electrons are being accelerated on faster scales by the slingshot effect of magnetic flux-line recombination. Another possibility is that the highest-energy photons are decay products of mesons created by ultrahigh-energy protons from the GRB.
It’s not only the afterglow measurements that benefit from GRB 130427A’s fortuitous proximity. The evolving spectrum of its initial three-second pulse was measured by the GBM and LAT’s low-energy subsystem (sensitive down to 10 MeV) with previously unavailable time resolution. 2 Analysis of those data reveals puzzles that existing models of prompt GRB radiation cannot explain: As the burst’s luminosity rises in the first second, the spectral-peak photon energy falls steadily to about 1 MeV. And over the next two seconds, the luminosity’s decay rate is inconsistent with the standard picture of faster jets running into slower ones before they break out into the ISM.
X-ray observations
The x-ray afterglow of GRB 130427A was recorded for about a week by two NASA satellites: Swift at photon energies 0.3–10 keV and NuSTAR at 3–80 keV. The Swift light curve is plotted with Fermi’s in figure 1a. A common uptick in the x-ray, LAT, and GBM curves near 200 s, well after the afterglows began, appears to indicate a brief reactivation of the collapsed system’s central engine—perhaps a late spike of accretion onto the black hole.
On the whole, the Swift team, comparing its new observations with the spacecraft’s x-ray measurements of more than a thousand GRBs since its launch in 2004, concludes that GRB 130427A is a fairly typical hyperenergetic GRB; its surprising revelations at gamma-ray energies were simply gifts of its proximity. 3 In the past, some had argued that finding the most energetic GRBs only at very large distances might be a consequence of cosmological evolution.
NuSTAR, a hard-x-ray focusing telescope launched in 2012, fills in an important spectral gap above 10 keV in which GRB afterglows had not previously been studied. With that hard-x-ray gap now bridged, the NuSTAR team concludes that the gamma-ray, x-ray, and optical observations of GRB 130427A “unambiguously establish a single afterglow spectral component from optical to multi-GeV energies . . . which is almost certainly synchrotron radiation.” 4 That conclusion would seem to narrow down the question of the highest-energy LAT photons to, How can the synchrotron radiation evade its theoretical energy limit?
Optical data
The decay of radioactive nuclei created in a GRB collapse should also produce a supernova visible after the GRB for several weeks. But supernovae cannot be seen at the great cosmological distances of most GRBs. And even those associated with more local ones are at first obscured by the glare of the GRB’s own optical afterglow. It had been suggested that the absence of observable supernovae accompanying the earlier hyperenergetic GRBs implied some sort of energy-budget tradeoff between a GRB and the luminosity of its supernova. That conjecture has now been put to rest by the discovery of GRB 130427A’s supernova.
The principal measurements of the GRB’s direct optical and IR outputs in its first few hours were made by the RAPTOR network of small, automated telescopes. 5 Figure 2a compares the temporal shapes of the optical, x-ray, and high-energy-gamma outputs in the first 90 seconds. “The similar delayed peaking of the optical and LAT signals,” argues RAPTOR leader Thomas Vestrand (Los Alamos National Laboratory), “suggests that, unlike the prompt x-ray burst, they’re both predominantly afterglows cogenerated by the same mechanism.”

Figure 2. Comparing the light curves of GRB 130427A measured by the RAPTOR network of optical telescopes with those of the GRB’s higher-energy photons. (a) RAPTOR’s initial light curve is plotted together with renormalized x-ray and gamma-ray curves measured by the Swift and Fermi orbiters. The delayed onsets of the optical and gamma-ray curves suggest that both are dominated very early on by afterglows. (b) The similarly waning afterglows at optical and gamma-ray energies suggest to the RAPTOR team that both are generated by a common mechanism that involves an unexpected transition at around 3000 seconds. (Adapted from ref.
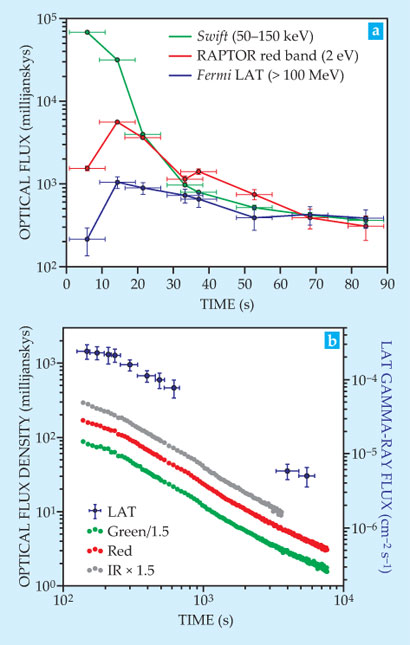
Figure 2b shows the continuing similarity of the waning RAPTOR and LAT afterglows over the next two hours. GRB 130427A is the first GRB for which the optical and gamma-ray afterglows have both been seen with such clarity. The RAPTOR team’s best model fit to the data yields a surprising and somewhat controversial conclusion: “For about the first 3000 seconds,” says Vestrand, “a reverse shock front reflected off the ISM back into the relativistic burst ejecta seems to be doing most of the Fermi acceleration that yields the synchrotron radiation at optical and gamma-ray wavelengths.” The team takes the slight flattening of the curves after 3000 seconds to signal the onset of dominance by the conventional forward-shock mechanism. Reverse shocks were thought to contribute to optical afterglows. But until now they hadn’t been implicated in gamma-ray afterglows.
So far, there’s no consensus model. “The variety of revelations and conclusions from the different observing modes is reminiscent of the proverbial six blind sages probing different parts of the elephant,” says Dermer. “This burst has not yet been put to bed.”
References
1. M. Ackermann et al. ( Fermi collaboration), Science 343, 42 (2014). https://doi.org/10.1126/science.1242353
2. R. Preece et al. ( Fermi collaboration), Science 343, 51 (2014). https://doi.org/10.1126/science.1242302
3. A. Maselli et al. ( Swift collaboration), Science 343, 48 (2014). https://doi.org/10.1126/science.1242279
4. C. Kouveliotou, et al. (NuSTAR collaboration), Astrophys. J. Lett. 779, L1 (2013).https://doi.org/10.1088/2041-8205/779/1/L1
5. W. T. Vestrand et al. (RAPTOR collaboration), Science 343, 38 (2014).https://doi.org/10.1126/science.1242316


