The fundamental physical constants
DOI: 10.1063/1.2761803
The Committee on Data for Science and Technology (CODATA) was established in 1966 as an interdisciplinary committee of the International Council of Scientific Unions (now the International Council for Science). Three years later CODATA created the task group on fundamental constants to periodically provide the scientific and technological communities with a self-consistent set of internationally recommended values for the basic constants and conversion factors of physics and chemistry. Under the auspices of the CODATA task group, we have completed a new least-squares adjustment of those values—termed the 2006 adjustment—that takes into account all relevant data available through 31 December 2006. The tables accompanying this article online (available at http://www.physicstoday.org ) give the 2006 CODATA recommended values resulting from that adjustment, except for some specialized x-ray-related quantities and various natural and atomic units.
The complete 2006 CODATA set of more than 300 recommended values, together with a detailed description of the data and their analysis, is in preparation and will be posted on arXiv.org and submitted for publication later this year. All of the values, as well as the correlation coefficients between any two constants, are available online in a searchable database provided by the NIST fundamental constants data center. The URL is http://physics.nist.gov/constants .
The new set of recommended values replaces its immediate predecessor, which resulted from the 2002 adjustment, 1 also carried out under the auspices of the task group. Although only four years have elapsed between the 31 December 2002 and 31 December 2006 closing dates of the two adjustments, a number of advances in experiment and theory have led to significant improvements in our knowledge of the values of the constants.
The new information includes the results on nuclidic masses in the 2003 Atomic Mass Evaluation from the Atomic Mass Data Center in Orsay, France; a significantly improved experimental value of the electron magnetic moment anomaly a e with a relative standard uncertainty (that is, relative estimated standard deviation) u r = 6.5 × 10⁻¹⁰ from measurements on a single electron in a cylindrical Penning trap (see figure 1 and Physics Today, August 2006, page 15 ); better measurements of the relative atomic masses of 2H, 3H, and 4He; improved measurements of the nuclear magnetic resonance (NMR) frequencies of the deuteron (d) and proton (p) in the hydrogen–deuterium (HD) molecule and of the triton (t) and proton in the hydrogen–tritium molecule (HT); and a highly accurate value of the product

Figure 2. Moving-coil watt balance at NIST. By comparing mechanical power measured in terms of the meter, kilogram, and second to electrical power measured in terms of the Josephson and quantum Hall effects, watt-balance experiments have provided the best value for the Planck constant h. Richard Steiner is shown here placing a 1-kg test mass onto the mass pan.
ROBERT RATHE
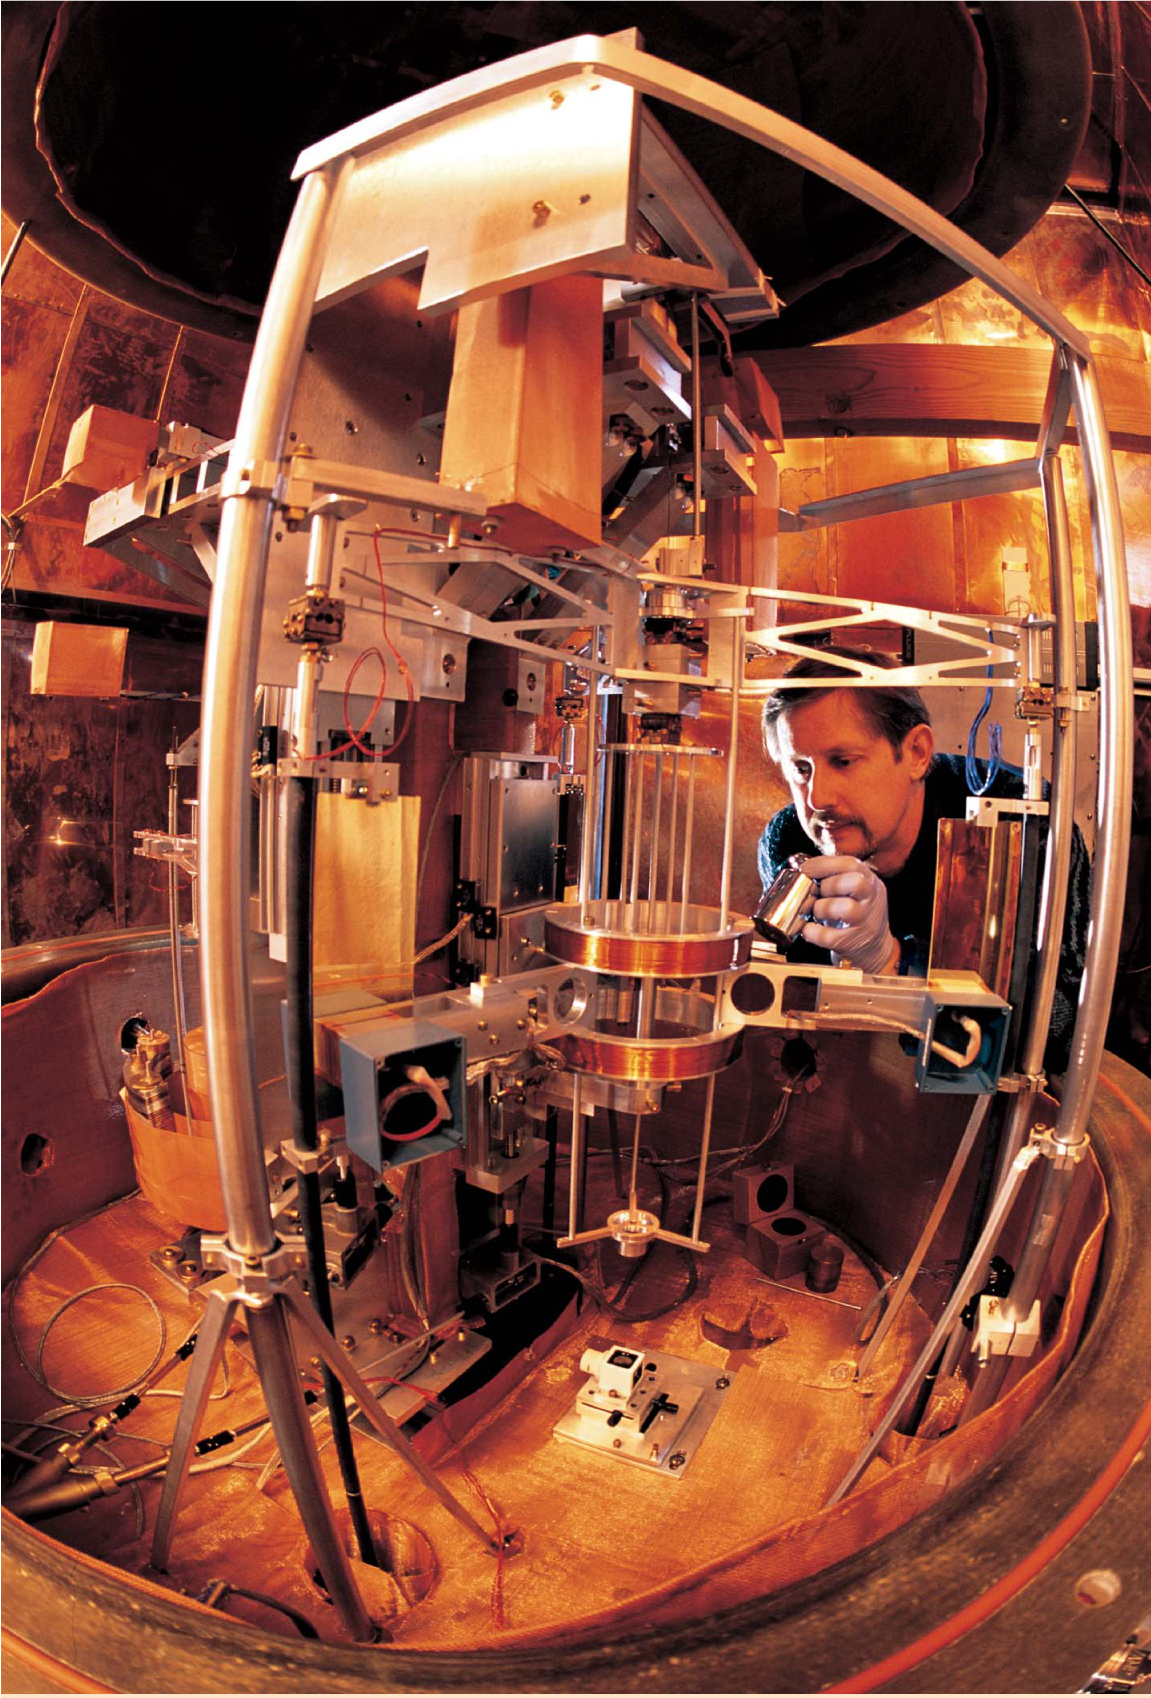

Figure 1. (a) A new measurement of the electron’s anomalous magnetic moment a e by Gerald Gabrielse’s group at Harvard University significantly improves on the 1987 measurement done at the University of Washington. (b) The new value of a e is the key input datum for determining the fine structure constant α. Shown here are the values of α–1 calculated from the a e measurements using current quantum electrodynamics theory, along with the values determined from atomic recoil experiments with rubidium and cesium and the recommended value from the 2002 and 2006 CODATA adjustments.
(Adapted from B. Odom ,
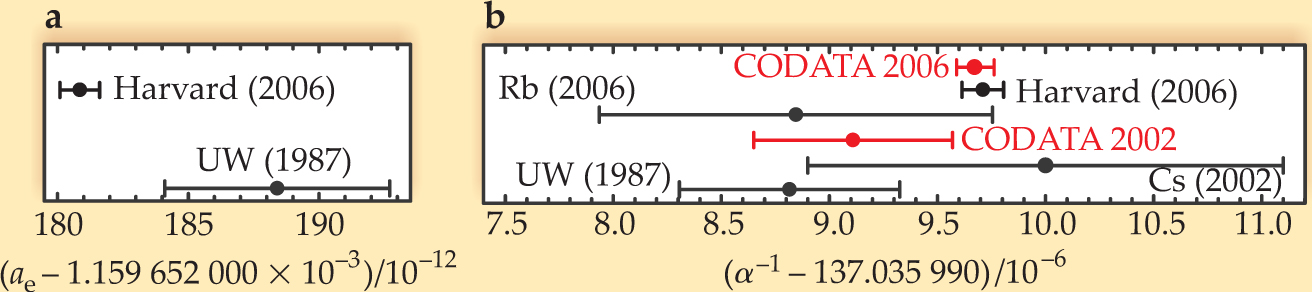
Equally significant, the new information also includes an accurate value of the quotient h/m(87Rb) obtained by measuring the recoil velocity of a rubidium-87 atom of mass m(87Rb) when it absorbs or emits a photon—a result that provides, with a relative uncertainty of 6.6 × 10⁻⁹, a value of the fine-structure constant α independent of quantum electro-dynamic (QED) theory; combined x-ray and optical interferometer (XROI) results for d 220, the {220} lattice spacing of highly pure, nearly crystallographically perfect single crystals of silicon; measurements of transition frequencies in antiprotonic helium that, together with theoretical expressions for the frequencies, provide a value of the relative atomic mass of the electron, A r(e); improved theoretical expressions for H and D energy levels; and an improved theoretical expression for a e.
Consequences of new results
The new information available to the task group led to significant changes in both the values and uncertainties of many of the fundamental constants. A few highlights follow.
▸ The reduction from 0.038 to 0.0035 of the uncertainty of the eighth-order coefficient
▸ The new NMR measurements on HD have led to a reduction in the uncertainty of the recommended values of the deuteron–electron and deuteron–proton magnetic moment ratios μd/μe and μd/μp. Further, the improved measurements of the relative atomic mass of 3H and the new NMR measurements on HT have for the first time led to the inclusion of recommended values in the CODATA listing for quantities associated with the triton, including the triton–electron and triton–proton magnetic moment ratios μt/μe and μt/μp.
▸ The experimental problems thought to be present in two of the three XROI determinations of d 220 for three different silicon crystals considered for inclusion in the 2002 adjustment have been clarified. Although the three values had been included in the 1998 adjustment, 2 only one was an input datum in the 2002 adjustment. As a result of the new work, which includes additional d 220 determinations, four d 220 XROI values were available for inclusion in the 2006 adjustment. However, although three agree among themselves, one disagrees with them but is in reasonable agreement with the value implied by the accurate x-ray measurement of h/(m n d 220), where m n is the neutron mass. Some details about the disagreement and how it is dealt with are presented below.
▸ The availability for the 2006 adjustment, as for the 2002 adjustment, of a credible result for the molar volume of highly pure, nearly crystallographically perfect silicon, V m(Si), that disagrees with five other credible results for other constants, including the product
Data analysis
The 2006 adjustment is similar to the 2002 adjustment in many key respects. First, we treated all of the input data on an essentially equal footing. Doing so allowed us to properly consider all components of uncertainty and all significant correlations among the data. It also eliminated any arbitrary division of the data into different categories—such divisions generally occurred in adjustments before that of 1998.
Second, to analyze the data we used the standard least-squares algorithm rather than an extended algorithm that tries to take into account the “uncertainty of the uncertainty” assigned to an input datum. An extended algorithm was applied as part of the 1986 adjustment, 3 but the complexity of the measurements and calculations in the field of fundamental constants makes it difficult enough to evaluate uncertainties in a meaningful way, let alone the uncertainties of those uncertainties.
Third, we continued to use an innovation from the 1998 adjustment to properly take into account the uncertainties of various theoretical expressions—for example, the energy levels of H and D required to obtain the Rydberg constant R ∞ from measurements of transition frequencies in those atoms. Thus we employed once again an additive correction δ i for each such expression, included those corrections among the variables of the least-squares adjustment, and took their estimated values as input data. The best a priori estimate of each δ i was zero but with an uncertainty equal to the uncertainty of the theoretical expression as obtained from estimates of the magnitudes of the uncalculated terms.
Fourth, we analyzed the data using the method of least squares for correlated input data. Although the need to consider correlations among the input data in the evaluation of the fundamental constants was first emphasized well over half a century ago, the 1998 adjustment was the first time it was actually done.
As in the 2002 adjustment, the analysis of the input data proceeded in several stages. First, we compared the directly measured values of the same quantity, for example, the five calculable capacitor measurements of R K. Next, by comparing values of a common inferred constant, principally α or h, we examined whether measured values of different quantities were consistent. Finally, we used the least-squares method as described above to carry out a multivariate analysis of the data. The focus of all these investigations was the compatibility of the data and the extent to which a particular datum would contribute to the 2006 recommended values of the constants.
The final least-squares adjustment used 135 of the 150 input data that were initially considered and 79 variables or adjusted constants whose values were determined by the least-squares algorithm. The input data included, for example, 23 H and D transition frequencies and frequency differences. Among the adjusted constants were R ∞, α, h, and A r(e). Although a number of the recommended values were adjusted constants, most were calculated from the adjusted constants. For example, the elementary charge follows from the expression
Discrepant data
The data analysis uncovered two major inconsistencies with the input data, as mentioned above. One of the d 220 absolute values disagrees with the other three but agrees with an implied value from h/(m n d 220). And the measured value of the molar volume of silicon, V m(Si), disagrees with five measurements involving the Josephson constant K J = 2e/h and the von Klitzing constant
To that end, as in the 2002 adjustment, we temporarily assumed
Comparison of the 2006 and 2002 CODATA recommended values of various constants
| Relative standard uncertainty u r | ||||
|---|---|---|---|---|
| Constant | 2006 | 2002 | Ratio | D r |
| α | 6.8 × 10⁻¹⁰ | 3.3 × 10⁻⁹ | 4.9 | –1.3 |
| a 0 | 6.8 × 10⁻¹⁰ | 3.3 × 10⁻⁹ | 4.9 | –1.3 |
| λC | 1.4 × 10⁻⁹ | 6.7 × 10⁻⁹ | 4.9 | –1.3 |
| h | 5.0 × 10⁻⁸ | 1.7 × 10⁻⁷ | 3.4 | –0.3 |
| N A | 5.0 × 10⁻⁸ | 1.7 × 10⁻⁷ | 3.4 | 0.3 |
| e | 2.5 × 10⁻⁸ | 8.5 × 10⁻⁸ | 3.4 | –0.3 |
| R | 1.7 × 10⁻⁶ | 1.7 × 10⁻⁶ | 1.0 | 0.0 |
| k | 1.7 × 10⁻⁶ | 1.8 × 10⁻⁶ | 1.0 | 0.0 |
| σ | 7.0 × 10⁻⁶ | 7.0 × 10⁻⁶ | 1.0 | 0.0 |
| G | 1.0 × 10⁻⁴ | 1.5 × 10⁻⁴ | 1.5 | 0.1 |
| R ∞ | 6.6 × 10⁻¹² | 6.6 × 10⁻¹² | 1.0 | 0.0 |
| m e/m p | 4.3 × 10⁻¹⁰ | 4.6 × 10⁻¹⁰ | 1.1 | 0.2 |
| A r(e) | 4.2 × 10⁻¹⁰ | 4.4 × 10⁻¹⁰ | 1.0 | –0.1 |
The relative standard uncertainty of y is defined as
Comparison of the 2006 and 2002 CODATA recommended values of various constants
α |
6.8 × 10⁻¹⁰ |
3.3 × 10⁻⁹ |
4.9 |
–1.3 |
a 0 |
6.8 × 10⁻¹⁰ |
3.3 × 10⁻⁹ |
4.9 |
–1.3 |
λC |
1.4 × 10⁻⁹ |
6.7 × 10⁻⁹ |
4.9 |
–1.3 |
h |
5.0 × 10⁻⁸ |
1.7 × 10⁻⁷ |
3.4 |
–0.3 |
N A |
5.0 × 10⁻⁸ |
1.7 × 10⁻⁷ |
3.4 |
0.3 |
e |
2.5 × 10⁻⁸ |
8.5 × 10⁻⁸ |
3.4 |
–0.3 |
R |
1.7 × 10⁻⁶ |
1.7 × 10⁻⁶ |
1.0 |
0.0 |
k |
1.7 × 10⁻⁶ |
1.8 × 10⁻⁶ |
1.0 |
0.0 |
σ |
7.0 × 10⁻⁶ |
7.0 × 10⁻⁶ |
1.0 |
0.0 |
G |
1.0 × 10⁻⁴ |
1.5 × 10⁻⁴ |
1.5 |
0.1 |
R ∞ |
6.6 × 10⁻¹² |
6.6 × 10⁻¹² |
1.0 |
0.0 |
m e/m p |
4.3 × 10⁻¹⁰ |
4.6 × 10⁻¹⁰ |
1.1 |
0.2 |
A r(e) |
4.2 × 10⁻¹⁰ |
4.4 × 10⁻¹⁰ |
1.0 |
–0.1 |
The relative standard uncertainty of y is defined as
The task group ultimately decided that, in the final least-squares adjustment from which the 2006 recommended values were to be obtained, the a priori assigned uncertainties of the input data involved in the two discrepancies would be weighted by the multiplicative factor 1.5. This weighting reduced the discrepancies to a level comfortably below two standard uncertainties. As a consequence, the uncertainty of the 2006 recommended value of h is larger by this factor than otherwise would be the case. Still, its u r of 5.0 × 10⁻⁸ is significantly smaller than that of the 2002 recommended value, u r = 1.7 × 10⁻⁷. There are comparable decreases in the uncertainties of the recommended values of other constants that depend strongly on h, such as e and the Avogadro constant N A. Reduction of the uncertainties of recommended values from one adjustment to the next due to new information is usually the case. The
Limited redundancy
Because there is little redundancy among some of the key input data, the 2006 CODATA set of recommended values, like its 2002 predecessor, does not rest on as solid a foundation as one might wish. The constants α and h and the molar gas constant R play a critical role in determining many other constants, yet the recommended value of each is largely determined by a severely limited number of input data. Moreover, some of those data have rather different uncertainties u and hence rather different weights 1/u 2.
The key input datum that determines α is the experimentally measured electron magnetic moment anomaly a e with u r = 6.5 × 10⁻¹⁰, which is significantly smaller than the uncertainty u r = 37 × 10–10 of the next most accurate experimental value of this important quantity. Furthermore, there is only a single value of the eighth-order coefficient
The watt-balance result for
For the molar gas constant R, the key input data are the two values based on speed-of-sound measurements in argon: One measurement used a spherical acoustic resonator; the other, an acoustic interferometer. The uncertainties of the two measurements differ by a factor of 4.7.
If our knowledge of the values of the constants is to advance, we need additional input data that can provide values for α, h, and R with uncertainties that, at the very least, are no larger than the current uncertainties.
Four-year cycle for adjustments
New experimental and theoretical data that influence our knowledge of the values of the constants appear nearly continuously. And thanks to the World Wide Web, it is easy to distribute new recommended values of the fundamental constants. Indeed, the first appearance of the 2007 CODATA recommended values was on the NIST fundamental constants data center’s website in March 2007. The Web has also engendered new modes of work and thought—users expect that the information they find online is up-to-date. For these reasons, the CODATA task group on fundamental constants decided at the time of the 1998 adjustment to take advantage of the high degree of computerization that had been incorporated in the 1998 compilation and to provide a new CODATA set of recommended values every four years: The 12–13 years separating the first CODATA set 4 of 1973 from the second set of 1986 and the 1986 set from the third set of 1998 was no longer acceptable. The 2006 set is the second one on the new schedule.
Based on the experience gained in the last eight years, we expect to maintain the new schedule in the future. The reader may therefore anticipate an updated fundamental constants article in Physics Today in four years.
This article is a contribution of NIST and is not subject to copyright in the US. NIST is an agency of the Technology Administration, US Department of Commerce.
References
1. P. J. Mohr, B. N. Taylor, Rev. Mod. Phys. 77, 1 (2005). https://doi.org/10.1103/RevModPhys.77.1
2. P. J. Mohr, B. N. Taylor, Rev. Mod. Phys. 72, 351 (2000). https://doi.org/10.1103/RevModPhys.72.351
3. E. R. Cohen, B. N. Taylor, Rev. Mod. Phys. 59, 1121 (1987). https://doi.org/10.1103/RevModPhys.59.1121
4. E. R. Cohen, B. N. Taylor, J. Phys. Chem. Ref. Data 2, 663 (1973). https://doi.org/10.1063/1.3253130
More about the authors
Peter Mohr (mohr@nist.gov ) is head of the fundamental constants data center of the atomic physics division of the NIST Physics Laboratory in Gaithersburg, Maryland. Barry Taylor (barry.taylor@nist.gov ) is a NIST scientist emeritus in the FCDC. David Newell (david.newell@nist.gov ) is a group leader in the quantum electrical metrology division of the NIST Electronics and Electrical Engineering Laboratory. All three are members of the CODATA task group on fundamental constants.
Peter J. Mohr, 1(mohr@nist.gov) NIST Physics Laboratory, Gaithersburg, Maryland, US .
Barry N. Taylor, 2(barry.taylor@nist.gov) NIST scientist emeritus, FCDC, US .
David B. Newell, 3(david.newell@nist.gov) NIST Electronics and Electrical Engineering Laboratory, US .


