Physics in Oil Exploration
DOI: 10.1063/1.1480782
Perhaps the most memorable movie scene depicting the oil industry is from the 1956 movie Giant, in which a gushing well sprays James Dean with oil. The oil surging from the well turns Dean’s character from a poor Texas ranch hand into a millionaire. The dramatic image of oil spraying from a well is so deeply imprinted in the public consciousness that it appears even now in TV documentaries on energy. It is a striking but inaccurate portrayal that reinforces the public’s misunderstanding of how one finds oil—drill until it spurts out of the ground. In fact, this approach to finding oil has not been used since the blowout preventer was introduced in the 1930s.
So how does one find oil without producing gushers? One possibility is to examine pulverized rock cuttings for traces of oil. However, accurately determining the depth from which the cuttings originated or how much oil they contain may be difficult. Another approach is to recover large pieces of rock taken with a specially designed coring drill, but that is a very expensive operation.
In 1927, a small geophysical research company founded by two French brothers developed a better approach. Conrad and Marcel Schlumberger, physicist and engineer respectively, demonstrated that electrical resistivity measurements could be made in a well and that the readings were different for different geological layers. Further investigation showed that formations saturated with oil had higher resistivities than ones saturated with saline water, so a high resistivity reading could indicate an oil-bearing formation. This discovery was so useful that, by 1935, 70 teams of engineers with resistivity-measuring equipment were deployed to oil-producing regions worldwide. Such was the birth of the “well-logging” industry, named for the strip of paper—the log—on which are recorded measurements as a function of depth beneath the surface. 1
Nowadays, oil and natural gas are located with the help of sophisticated physical measurements of subsurface formations. These measurements use electromagnetic fields and waves, acoustic waves, neutron scattering, gamma-ray radiation, nuclear magnetic resonance (NMR), infrared spectroscopy, and pressure and temperature sensors—all in a narrow (15- to 50-centimeter diameter) hole, thousands of meters deep, where the pressure and temperature are high and caustic fluids are present. No one measurement is adequate to define the structure and properties of an oil reservoir, and typically many measurements are made simultaneously by combinations of instruments. Significant advances have been made in instrumentation, modeling, and inversion techniques: only a few can be highlighted here. Using physics, the modern petroleum engineer can find smaller petroleum reservoirs in more remote, complex, and difficult geological settings than ever before.
Growing energy needs
A common misconception is that alternate energy sources will soon replace hydrocarbons. But, according to the US Department of Energy, 20 years from now, hydrocarbons will satisfy a greater percentage of the world’s energy demand than they do today. 2 As a consequence, there is a need to develop new technologies for finding and producing oil and natural gas. The DOE estimates that the world will need 59% more energy in 2020 than in 1999. This projected increase is due almost entirely to population growth and industrialization in developing nations. Between 1999 and 2020, oil production will have to increase by 60%, and natural gas production by 92%, to satisfy the world’s growing energy demands. Together, oil and natural gas supplied 63% of the world’s energy in 1999; they are projected to supply 68% by 2020. (For details, see the table and the figure on page 41 of this issue.)
Of perhaps equal significance is the uneven geographic distribution of oil and gas reserves. For example, in 2000, two-thirds of oil reserves were in the Middle East compared to 2% in the US. 3 In the future, the Middle Eastern nations’ share of the oil market will be even larger than it is today.
Increased energy demands and the asymmetric distribution of reserves present daunting challenges, especially given the world’s aging reservoirs and price fluctuations that tend to inhibit long-term investment. There is some debate as to when the production of conventional, relatively cheap oil will peak and begin to decrease: Some predict it will happen within a decade. 4 As oil becomes more expensive and difficult to find, new technologies become ever more essential.
Petrophysics
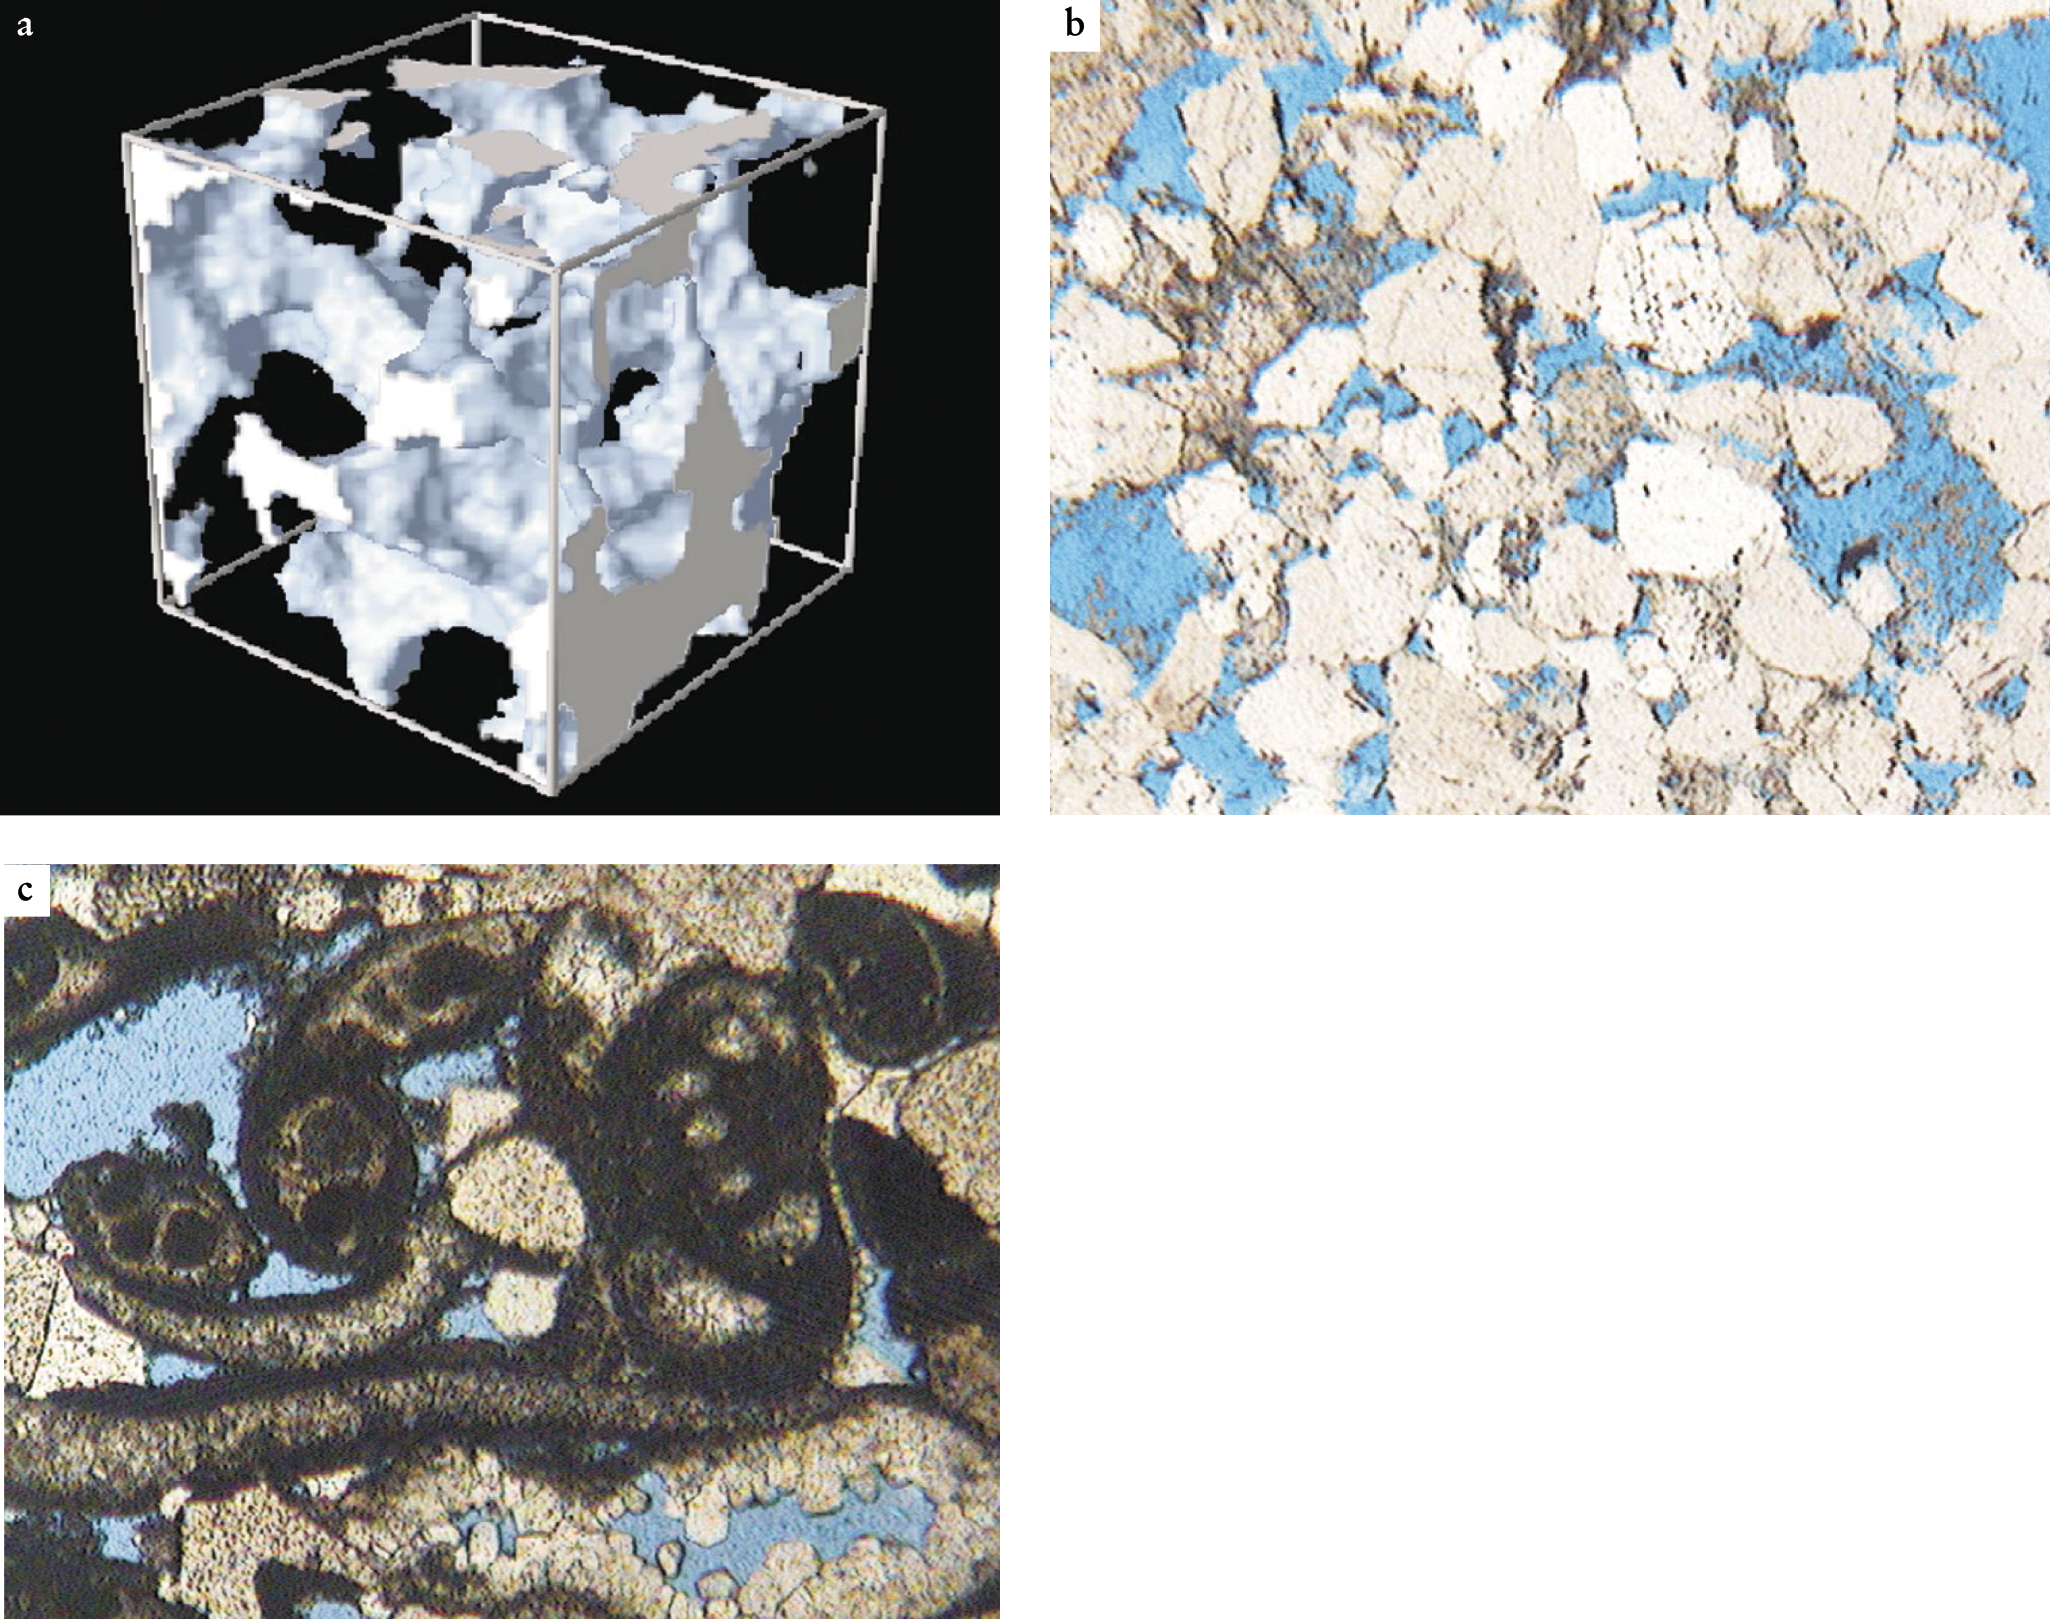
Petroleum is a mixture of gaseous, liquid, and solid hydrocarbons. The word derives from the Latin for rock “petra” and oil “oleum.” Petroleum is not located in underground caverns, but exists in the microscopic pores of sedimentary rocks. Petroleum-bearing rocks, such as those shown in figure 1, are heterogeneous and their origin, composition, and microgeometry vary widely. Many interesting physical quantities, including hydraulic permeability, resistivity, and grain size span several orders of magnitude. 5 (See the article by December 1988, page 24 .)

Reservoir rocks have a complicated distribution of grain and pore sizes. (a) An x-ray microtomograph of a piece of sandstone gives a three-dimensional image of its pore space. The edge length of the illustrated cube is 480 µm. (Adapted from ref.
(Photographs courtesy of Martin Hurlimann and Yi Qiao Song.)
Determining the relationships between macroscopic properties and the microscopic structure of rocks and their components has been difficult. Despite decades of study, researchers’ understanding is generally limited to empirical correlations based on laboratory measurements. Only recently have researchers been able to calculate a few of the macroscopic physical properties of rocks from first principles. 6
One common type of reservoir rock, depicted in figures 1, is quartz sandstone. Quartz grains, eroded by wind or water from existing rock, are transported to a sandbar, river channel, or beach, where they are buried and ultimately cemented together into an underground rock formation. A typical sandstone reservoir might have quartz grains 0.05–2 millimeters in diameter and a porosity (volume fraction of pore space) of 0.1–0.3. A wide distribution of grain sizes reduces the porosity, as does cementation or the inclusion of clay minerals in the pores.
Since petroleum can only occupy the pore space, determining the formation porosity is of primary importance. A number of techniques including neutron and gamma-ray scattering, acoustic propagation, and magnetic resonance have been developed to measure porosity. A widely used well-logging instrument exploits Compton scattering. Gamma rays emitted from a cesium-137 source are scattered by the rock formation before reaching scintillation detectors located 5 to 30 cm away in the borehole. Attenuation increases with electron density. The electron density contrast between pore liquids on one hand and quartz on the other makes the computation of porosity from attenuation straightforward in many cases.
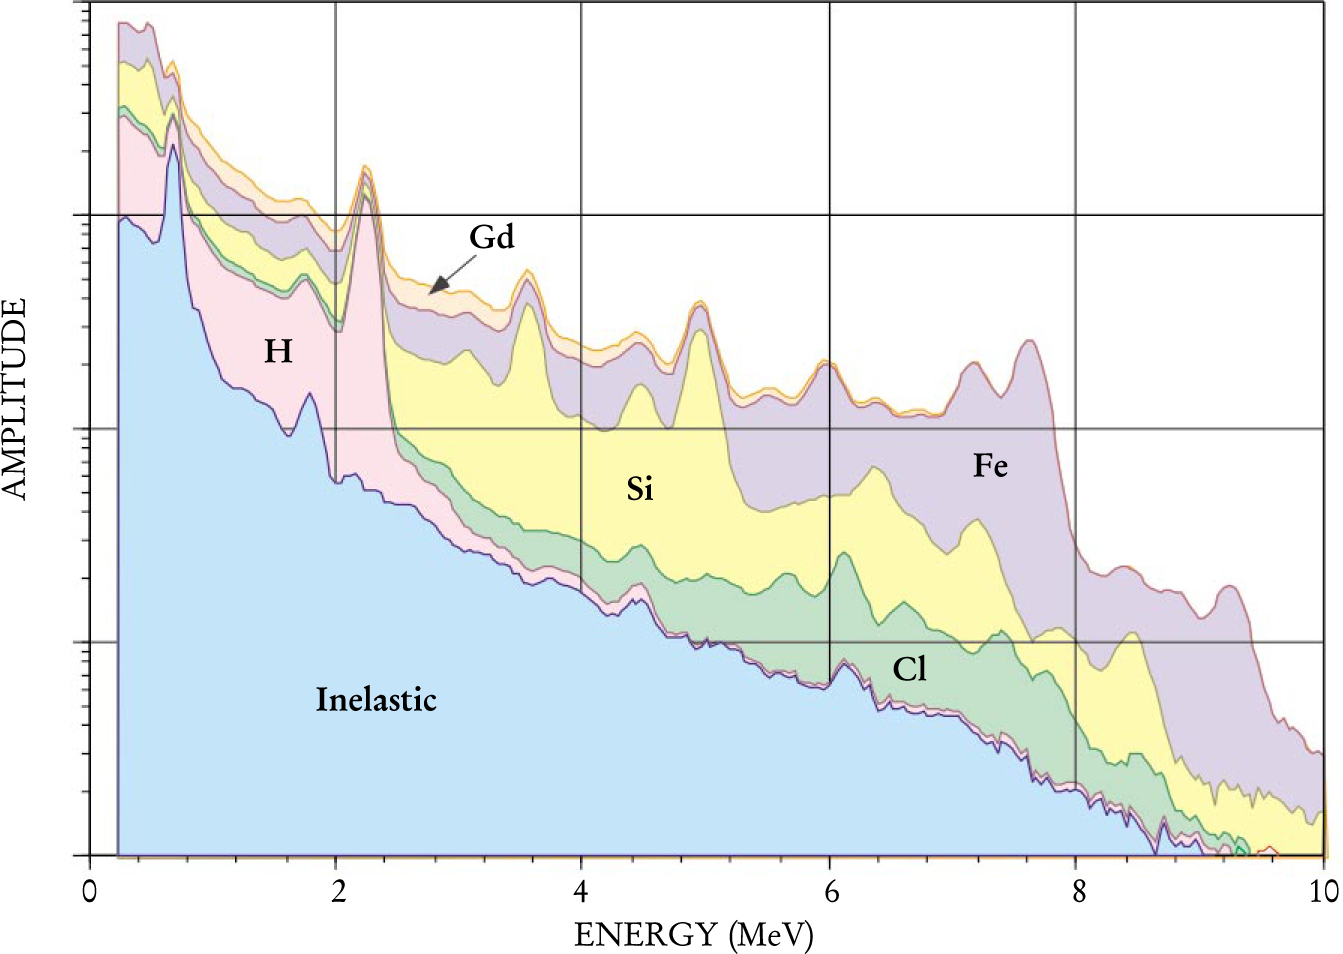
Carbonate (typically CaCO3) is another type of porous rock that can hold petroleum. Carbonate rocks often contain fossils, shells, and microscopic exoskeletons such as corals, making the microgeometry much more varied than that of quartz sandstone, as one can see by comparing figures 1. Determining the mineral content of a rock formation is useful in a variety of ways. For example, it defines the electron density of the grain space, a key parameter of the gamma-ray porosity measurement. A number of techniques are sensitive to mineralogy. 7 These include spectroscopy of gamma rays arising from the inelastic scattering and capture of neutrons, as illustrated in figure 2; spectroscopy of naturally occurring gamma rays; and the observation of photoelectric absorption of gamma rays.

Mineral content of rock formations can be determined using gamma-ray spectroscopy. Gamma rays are produced when 4 MeV neutrons from an americium–beryllium source interact with formation nuclei by inelastic scattering or via neutron capture. The resulting gamma-ray energy spectrum is obtained downhole with a bismuth germanate scintillation detector. The spectrum can be resolved to yield the concentrations of hydrogen, chlorine, silicon, iron, and gadolinium, whose spectra are known. Those elemental concentrations can, in turn, be related to the formation’s mineral content.
(Adapted from ref. 14.)
Water is always present in the pores of sedimentary rocks, which are formed by rivers, lagoons, lakes, and oceans. Water found well below Earth’s surface is generally much more saline than seawater and therefore electrically conductive. Oil and gas are insulators, so a hydrocarbon-bearing rock formation has a relatively high electrical resistivity. Sedimentary rocks can have resistivities ranging from 0.1 ohm-m to greater than 20 000 ohm-m depending on their porosity, the proportions of hydrocarbons and water, and the salinity of the water.
Many techniques have been developed for measuring resistivity. The three most common methods used today are based on focused electrode arrays, electromagnetic induction and electromagnetic propagation. Electrical anisotropy, the invasion of drilling fluids into the rock formation, the presence of geological bed boundaries, laminations with sizes smaller than the spatial resolution of the measurement, and other factors all complicate the determination of resistivity. Solving Maxwell’s equations in complex formation geometries, developing efficient inversion techniques, and designing new hardware remain very active research areas. With new techniques, it is possible to measure formation resistivities of 100 ohm-m through steel casings having resistivities of 2 × 10⁻⁷ ohmm. 8 Such measurements are used to search for bypassed oil in old fields and to detect water replacing oil outside the well casing during production.
Electrical resistivity does not distinguish between oil and natural gas, but neutron scattering does. Neutrons produced either by an americium–beryllium source (4 MeV) or from an accelerator-induced deuterium–tritium reaction (14 MeV) reach thermal energies primarily by elastic scattering from hydrogen atoms. As the density of hydrogen atoms increases, thermalized neutrons have a greater chance of being absorbed, and so the count rates in thermal neutron detectors located in the borehole 10–70 cm from the source decrease. While water and oil have roughly the same hydrogen atom density, gas has a much lower density, so neutron scattering differentiates between oil and gas. common rock solids such as quartz and limestone do not scatter neutrons strongly, but interstitial water in clay does, thereby interfering with the measurement.
Hydraulic permeability is another key physical feature of a reservoir rock. The larger the hydraulic permeability, the easier it is to extract petroleum from the formation—obviously an important consideration. For simple porous media, including some quartz sandstones, the hydraulic permeability is approximately proportional to the square of pore size (the length scale associated with the smallest dimension of the pore). Pore sizes can range from 0.1 to 100 micrometers. If there is clay in the pore space, the permeability will be significantly reduced.
Petroleum geology
Petroleum accumulates in geological structures that are porous, permeable, and capped by an impermeable barrier. Natural gas and oil are less dense than water, and migrate upward through faults, fractures, and permeable formations until they are prevented from rising farther. Petroleum traps have permeability barriers on their sides as well as above, and may be structural (for example, folds or faults) or stratigraphic (for example, river channels overlaid with shale).
Satellite images and surface measurements of Earth’s magnetic and gravitational fields are used to locate favorable areas for petroleum traps, but seismic reflection surveys are the most important technique for locating potential reservoirs.
9
Acoustic energy in the bandwidth from 10 to a few hundred Hertz is transmitted into the earth, and waves reflected from subsurface structures are collected by large arrays of surface sensors. The collected data yield three-dimensional images mapping a volume that may extend many kilometers deep and cover an area of hundreds of square kilometers. Image resolution, however, is limited by the acoustic wavelength to approximately 10 meters. Series of seismic surveys taken over time (called four-dimensional seismic surveys) show how reservoirs evolve. Such surveys may be used to locate bypassed pockets of oil for later access by additional drilling. As discussed in
Once a potential petroleum trap has been identified, a well must be drilled to determine if the structure actually contains hydrocarbons. Hydrocarbon-bearing zones vary in thickness from a few centimeters to hundreds of meters. The thickest reservoirs, which tend to be in the Middle East, are very economical to exploit. Most reservoirs, however, are 1–10 m thick, though with much greater lateral extent. Producing oil or gas from such thin, pancake-shaped formations has not been particularly efficient; recovery efficiencies of 30% or lower are quite common.
Various factors control recovery efficiency, one being reservoir geometry. Often distinct layers of gas, oil, and water, stratified by density, are present in a single permeable formation. Once brought to the surface, oil is easily transported and is a versatile material for fuel or chemical refining. It is therefore more profitable to produce than gas, which provides less energy per liter extracted and requires a pipeline or chilled tanker for transportation. Highly saline water is considered a hazardous waste, and therefore must be properly disposed of if brought to the surface. Hence, energy companies generally try to produce oil while leaving gas and water in place. Steel casing is cemented into the borehole to isolate gas, oil, and water from each other. Shaped explosive charges similar to those used in armor-piercing ordnance perforate the casing in the oil layer and allow oil to flow into the well. Initially, mostly oil is produced. But as the pressure in the oil layer decreases near the well, water and gas begin to move into the low-pressure zone. Eventually, more distant oil cannot reach the well, and water, gas, or both, are produced instead. The presence of gas and water layers in a formation thus limits the oil drainage to a circular area surrounding the well.
Microscopic processes also limit recovery. For example, capillary forces between water and rock can effectively close off small throats in a rock formation (such as that seen in figure 1) so that oil cannot pass through them. Oil in large pores may be extracted, but oil in smaller pores is blocked; eventually only water is produced.
Environmental monitoring with seismic surveys
Time-lapse seismic surveys show how reservoirs change over time. Such surveys can be used for environmental monitoring, as illustrated by the figure at right, which shows carbon dioxide migration in the Sleipner oil field in the Norwegian North Sea. 11

The Norwegian state-owned energy company Statoil has been separating CO2 from natural gas at its Sleipner field since 1996 and injecting it into the Utsira formation—a saline aquifer that could store hundreds of years’ worth of CO2 emissions from Europe’s power plants. In 1994, before injecting any CO2, Statoil acquired the baseline seismic survey shown in the left panel. The yellow and green lines indicate the aquifer’s top and bottom surfaces, corresponding to high seismic amplitudes (more intense colors). The right panel shows a monitor survey taken in 1999, after 2 million tons of CO2 had been injected. The higher seismic amplitudes show where CO2 has displaced salt water. The CO2 plume is approximately 1200 m wide and 250 m high. The bottom of the aquifer (purple line) appears to have moved, but that is an artifact arising from the slowing down of seismic waves as they travel through the CO2 plume. Additional seismic surveys will closely monitor the progress of the CO2 plume and its confinement.
Drilling operations
Wells for fresh drinking water have been drilled to depths of a few hundred feet for hundreds of years. In 1859, the Pennsylvania Rock Oil Co of Connecticut drilled the first oil well, in Titusville, Pennsylvania, and struck the pay zone at 61 feet. The site was chosen based on surface oil seeps long known to Native Americans. Since that first well, almost every corner of the continental US has been explored, as have many other countries. The search for new petroleum reservoirs has now moved into deep offshore waters worldwide. Rigs in the Gulf of Mexico are drilling in water depths approaching 3 km, and then as much as another 10 km into the earth, where pressures can reach 200 MPa (30 000 pounds per square inch or 2000 atmospheres) and temperatures exceed 175°C. Capital and operating expenses of deepwater drilling rigs can reach several hundred thousand dollars per day, so every effort is made to ensure efficient, safe operations.
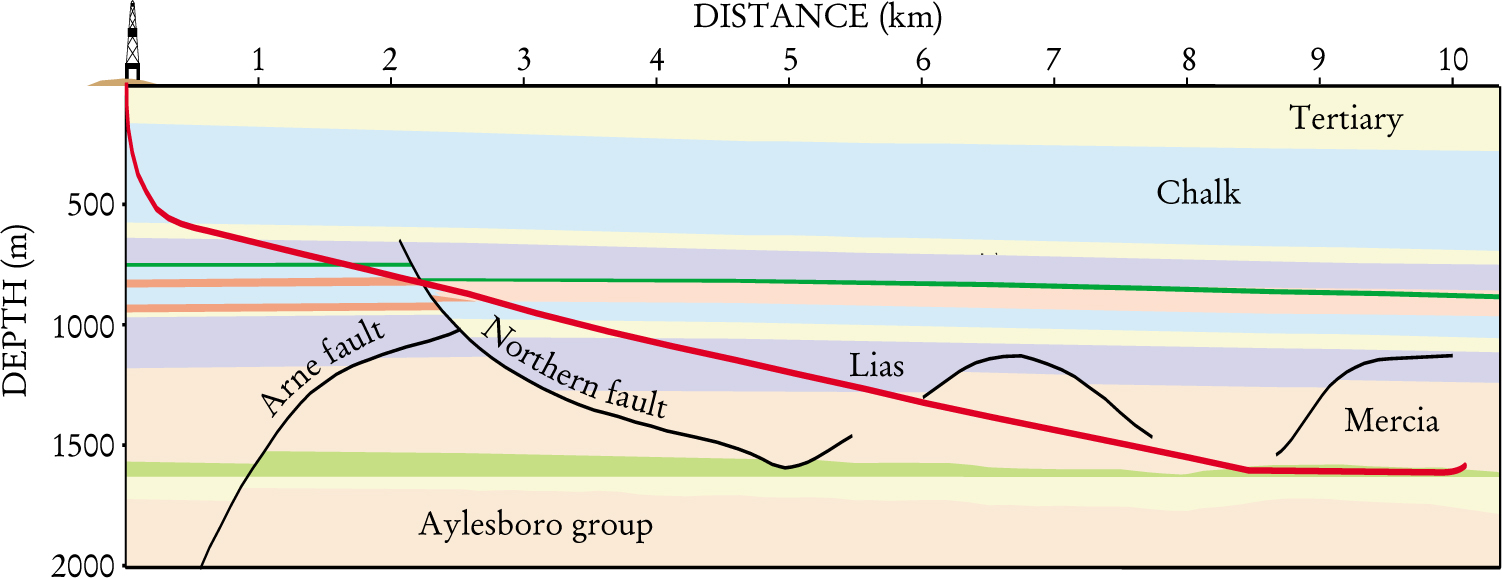
One of the most surprising developments is that wells are now being drilled horizontally. 10 An excellent illustration of so-called extended-reach horizontal drilling is in the British Petroleum (BP) Wytch Farm field, located in an environmentally sensitive area on the southern coast of England. Part of this field is onshore and has been exploited using vertical wells. However, a large portion of the field extends several kilometers offshore. An artificial island could have been built for drilling and production, but that would have been costly and environmentally controversial. Instead, extended-reach wells were drilled from existing, secluded onshore facilities. Using recent advances in drilling and logging technology, BP saved $180 million while minimizing visual impact. Figure 3 shows the profile of a recent Wytch Farm well.

Extended-reach well in the Wytch Farm field on the southern coast of England. The drilling rig is on shore, but most of the well (red) is under the sea. The well reaches a depth of 1.5 km before it terminates in sherwood sandstone, and has a lateral extent of about 10 km. The well trajectory passed through many geological formations and several faults before it reached the 20-meter-thick target stratum. Nonetheless, it arrived at the target stratum within a 2-m vertical window, a technical tour de force.
The drilling of extended-reach wells has many economic and environmental advantages. A vertical well can produce hydrocarbons only from a circular area of limited extent. A horizontal well may have to penetrate kilometers to reach hydrocarbons, but once it has reached the pay zone, increasing the drainage area is very cost effective. The ability to tap petroleum resources within a several-kilometer radius allows drilling and production facilities to be concentrated in one small area. Such a concentration is especially advantageous when drilling from an offshore platform, a very expensive installation, or in environmentally sensitive areas, such as Alaska’s North Slope.
The mechanical technology that allows engineers to drill great lateral distances while precisely steering the drill bit is evolving rapidly, but discussion of this topic is beyond the scope of this article. Instead, we focus on the key measurement technologies required to hit a small target zone and to maintain the well bore in a thin hydrocarbon layer.
Until the 1980s, wells were drilled blindly: Directly measuring properties of rock formations was impossible while the drill bit was in the hole. To locate hydrocarbons, it was necessary to remove the drilling assembly from the borehole and to lower well-logging equipment into place. This approach is suitable for vertical wells, but not for extended-reach or horizontal wells. Geological layers are rarely truly horizontal: Generally they are dipping or folded, have faults (as seen in figure 3), or are pinched off. Hence, keeping the well bore in a hydrocarbon layer requires continuous measurements of formation properties and fluid saturations.
The advent of microelectronics brought sophisticated electronics and sensors small enough to fit within the drilling assembly itself. The first measurements-while-drilling (MWD) system contained magnetometers to determine hole direction and accelerometers to determine hole inclination—information necessary for directing the drill bit.
MWD systems have to be entirely self-contained. They derive power from batteries or turbines; have sensors, electronics, acquisition systems, microprocessors, and memory; perform data processing; and have unique telemetry systems. There are no electrical connections to the surface. Instead, MWD tools transmit data to the rig using pressure pulses in the fluid column inside the drill pipe, or by sending low frequency electromagnetic waves through the earth. The maximum data rate is a few bits per second, so a high level of signal processing and data compression must be done downhole by the MWD apparatus.
MWD systems must maintain their accuracy for hundreds of hours, while exposed to shocks exceeding 100 g; abrasion by rock as they rotate at 100–200 RPM; pressures up to 170 MPa (25 000 psi or 1700 atm); and temperatures up to 175°C. The equipment must transmit extremely high torsional and axial loads to the drill bit, and must, without being eroded, provide a passageway for high-velocity drilling fluids.
By the early 1990s, MWD technology used electromagnetic propagation to measure resistivity, along with Compton scattering to measure porosity and neutron scattering to differentiate oil from gas. The MWD measurements, made by sensors located near the drill bit, are similar to measurements developed for conventional well logging but are adapted for the much harsher drilling environment. Information gleaned from MWD measurements is transmitted to the surface in real time and allows a horizontal well to be steered to hit a thin hydrocarbon layer and then stay within it.
A closer look at borehole NMR
Nuclear magnetic resonance techniques are now being used in boreholes to locate hydrocarbon-bearing zones; to measure porosity, hydraulic permeability, and hydrocarbon viscosity; and to determine the fraction of water bound by capillary forces in small pores. 12
Performing downhole NMR measurements is difficult. Unlike in a laboratory, where high magnetic-field strengths and extremely uniform fields are possible, in a borehole, magnetic fields are weak (typically 15–50 millitesla) and highly inhomogeneous. These weak, inhomogeneous fields are consequences of inserting the well-logging apparatus into the sample—Earth—instead of inserting the sample into the apparatus. In addition, a well-logging NMR tool must move during the measurement, preferably at speeds greater than 10 cm/s, to minimize drilling rig expenses, which can run up to hundreds of thousands of dollars per day. Temperatures can reach 175°C and the radio-frequency antenna is remote from the protons, so the signal-to-noise ratio is low. Despite these challenges, several different downhole NMR instruments have been built. 12
Although these instruments are limited to measuring proton relaxation of fluids in rock, they provide valuable information. One important relaxation mechanism is controlled by hyperfine interactions between protons in the pore fluid and unpaired electrons at the grain surface. 13 The resulting relaxation rate is proportional to the surface-to-volume ratio of the pore space. This ratio is controlled by the smallest dimension of the pore; therefore it is often said that the relaxation time, T 2, depends on the pore size.
Since sedimentary rock has a distribution of pore sizes, it has a corresponding distribution of relaxation times. Each pore contributes to the overall time-dependent amplitude of Carr-Purcell-Meiboom-Gill spin-echoes, which can be written as a sum of exponentials:
In practice, pores are not considered individually. Instead, all pores having similar surface-to-volume ratios are grouped together so that the sum has a manageable number of terms. The grouping allows one to think of amplitude as being a function of relaxation time, as in the T 2 distribution shown at the bottom of the page for a typical water-saturated sandstone. The plot shows that, as with most petrophysical properties, T 2 can vary over several orders of magnitude. The mineral-dependent relationship between pore size and T 2 is indicated on the upper axis of the graph, assuming cylindrical pores. Large pores offer less resistance to fluid flow than small pores, and so T 2 distributions can be used to estimate hydraulic permeability.

Data from NMR and other instruments are presented to geologists and petroleum engineers in the form of well logs—essentially strip-chart recordings of simultaneous measurements. A portion of a typical well log is shown in the figure to the left. Depth increases as one moves down the log; the figure shows a 15-meter extract of a much longer record.
The left panel is an electrical image of the borehole wall, the horizontal scale being the azimuth from 0° to 360°. The image is a conductivity map derived from electrical impedance measurements of numerous 5-mm diameter electrodes mounted on four pads pressed against the borehole wall. The vertical gray stripes show where there are gaps between the pads. The stripes change azimuth as the measuring tool slowly rotates while moving up the borehole. Conductive bodies are shown as dark brown, and relatively resistive bodies are shown as light brown. The high-resolution conductivity map is useful for defining very thin beds, fractures, and other fine geological features a geologist would look for at an outcrop.
The right panel is a sequence of T 2 distributions like that shown in the plot at the bottom of the page. Rocks with small pores have distribution peaks to the left, while rocks with large pores have peaks to the right. There is a clear, if imperfect, correlation between conductive formations, which appear dark brown in the left track, and fine pores. The conductive, fine-grained layers are rich in clay. The bottom of the log shows an exception to the correlation just noted: The light to very light bands indicate rocks with low conductivity while the NMR data indicate small pores, typical of many rock bodies that have low porosity and no clay.
A geologist studying a well log can get a very clear and detailed impression of the sedimentary history of the subsurface; a petroleum engineer studying the same log can make a quantitative estimate of the well’s productive potential.
Challenges
Most giant oil fields, those containing more than 5 × 10⁸ barrels of oil, were discovered between 1950 and 1970. Fields discovered in the past 30 years or so have tended to be small, geologically complex, or in remote or difficult environments such as in the Arctic or below deep water. Hence, improving the recovery factor in existing fields is crucial. Physics will play an increasingly important role in optimizing production, through such techniques as borehole NMR (see
Illumination of the reservoir regions between well bores will be essential for understanding the complex formations whose exploitation is becoming increasingly common. Breakthroughs in measurement techniques and signal processing will be needed before hydrocarbon accumulations can be mapped in three dimensions with high spatial resolution. Significant advances in the understanding of both multicomponent flow in porous media and the physics of wettability are crucial for the development of technology to minimize bypassed oil.
Well-logging instruments, which give snapshots of fluid distributions when a well is first drilled and then infrequently thereafter, will be supplemented by permanently implanted sensors. Sensor arrays, some of which will be based on fiber optics, will provide spatially and temporally continuous data streams. That information will be used to control downhole valves that regulate the rate and location of fluid extraction from the reservoir. Simple versions of such arrays have already been tested, at Wytch Farm and other places.
As the supply of cheap oil and gas is depleted and the remainder is increasingly concentrated in the Middle East, consumer nations may need to develop local resources, even if they are of lower grade. Japan seeks to exploit gas hydrates, a form of ice containing methane. Gas hydrates are abundant below the sea floor near Japan’s population centers. Canada has made major investments in the development of tar sands, a plentiful, low-grade resource. New ways of thinking about reservoir characterization and production will be needed to efficiently utilize such resources.
References
1. J. Hearst, P. Nelson, F. Paillet, Well Logging for Physical Properties: A Handbook for Geophysicists, Geologists and Engineers, 2nd ed., Wiley, New York (2000).
S. M. Luthi, Geological Well Logs: Their Use in Reservoir Modeling, Springer-Verlag, New York (2001).2. Energy Information Administration, Office of Integrated Analysis and Forecasting, International Energy Outlook 2001, rep. no. DOE/EIA-0484(2001), US Department of Energy, Washington, DC (March 2001), available online at http://www.eia.doe.gov/oiaf/ieo/index.html .
3. Energy Information Administration, Office of Energy Markets and End Use, International Energy Annual 1999, rep. no. DOE/EIA-0219(99), US Department of Energy, Washington, DC (February 2001). Data on reserves by region are available online at http://www.eia.doe.gov/emeu/international/petroleu.html .
4. C. J. Campbell, J. H. Haherrere, Sci. Am. March 1998, p. 78.
5. A. H. Thompson, A. J. Katz, C. E. Krohn, Adv. Phys. 36, 625 (1987).
6. F. M. Auzerais et al., Geophys. Res. Lett. 23, 705 (1996).
7. D. V. Ellis, Science 250, 82 (1990).
8. A. A. Kaufman, Geophysics 55, 29 (1990).
9. R. E. Sheriff, L. P. Geldart, Exploration Seismology, Cambridge U. Press, New York (1995).
10. G. A. Cooper, Sci. Am. May 1994, p. 82.
11. O. Eiken, “Seismic Monitoring of a Unique CO2 Injection Site at Sleipner”, online at http://www.physicstoday.org/vol-55/iss-4/pdf/Eiken.ppt .
12. R. L. Kleinberg, in Encyclopedia of Nuclear Magnetic Resonance, vol. 8, D. M. Grant, R. K. Harris, eds., Wiley, New York (1996), p. 4960.
13. S. Godefroy, J.-P. Korb, M. Fleury, R. G. Bryant, Phys. Rev. E 64, 021605 (2001).
14. J. S. Schweitzer, in Remote Geochemical Analysis: Elemental and Mineralogical Composition, C. Pieters, P. Englert, eds., Cambridge U. Press, New York (1993).
More about the authors
Brian Clark is a physicist with Schlumberger in Sugar Land, Texas. Robert Kleinberg is a physicist with Schlumberger–Doll Research in Ridgefield, Connecticut Both are Schlumberger Fellows.
Brian Clark, 1 Schlumberger, Sugar Land, Texas, US .
Robert Kleinberg, 2 Schlumberger–Doll Research, Ridgefield, Connecticut, US .


