Living with a Variable Sun
DOI: 10.1063/1.1996472
Although Earth and the Sun are separated by 150 million km, they are inextricably linked by an energy flow that both sustains and imperils life. A 15.8-million-K nuclear furnace in the innermost one-third of the Sun is the source of this energy, which photons, particles, and fields disseminate throughout the solar system. Figure 1 depicts major components of the Sun–Earth system, and figure 2 summarizes the energy flow.

Figure 2. The energy flow from the Sun to Earth roughly maps corresponding regions of the respective atmospheres. Visible radiation connects the surfaces of the Sun and Earth; UV radiation connects their atmospheres. Particles and the plasma wind connect the outer solar atmosphere primarily with Earth’s magnetosphere and high-latitude upper atmosphere. For photons in four different wavelength bands, energetic particles, and the plasma wind, the numbers give the approximate average energy fluxes and variations during an 11-year solar activity cycle. On the right are approximate temperature profiles of the solar and Earth atmospheres.
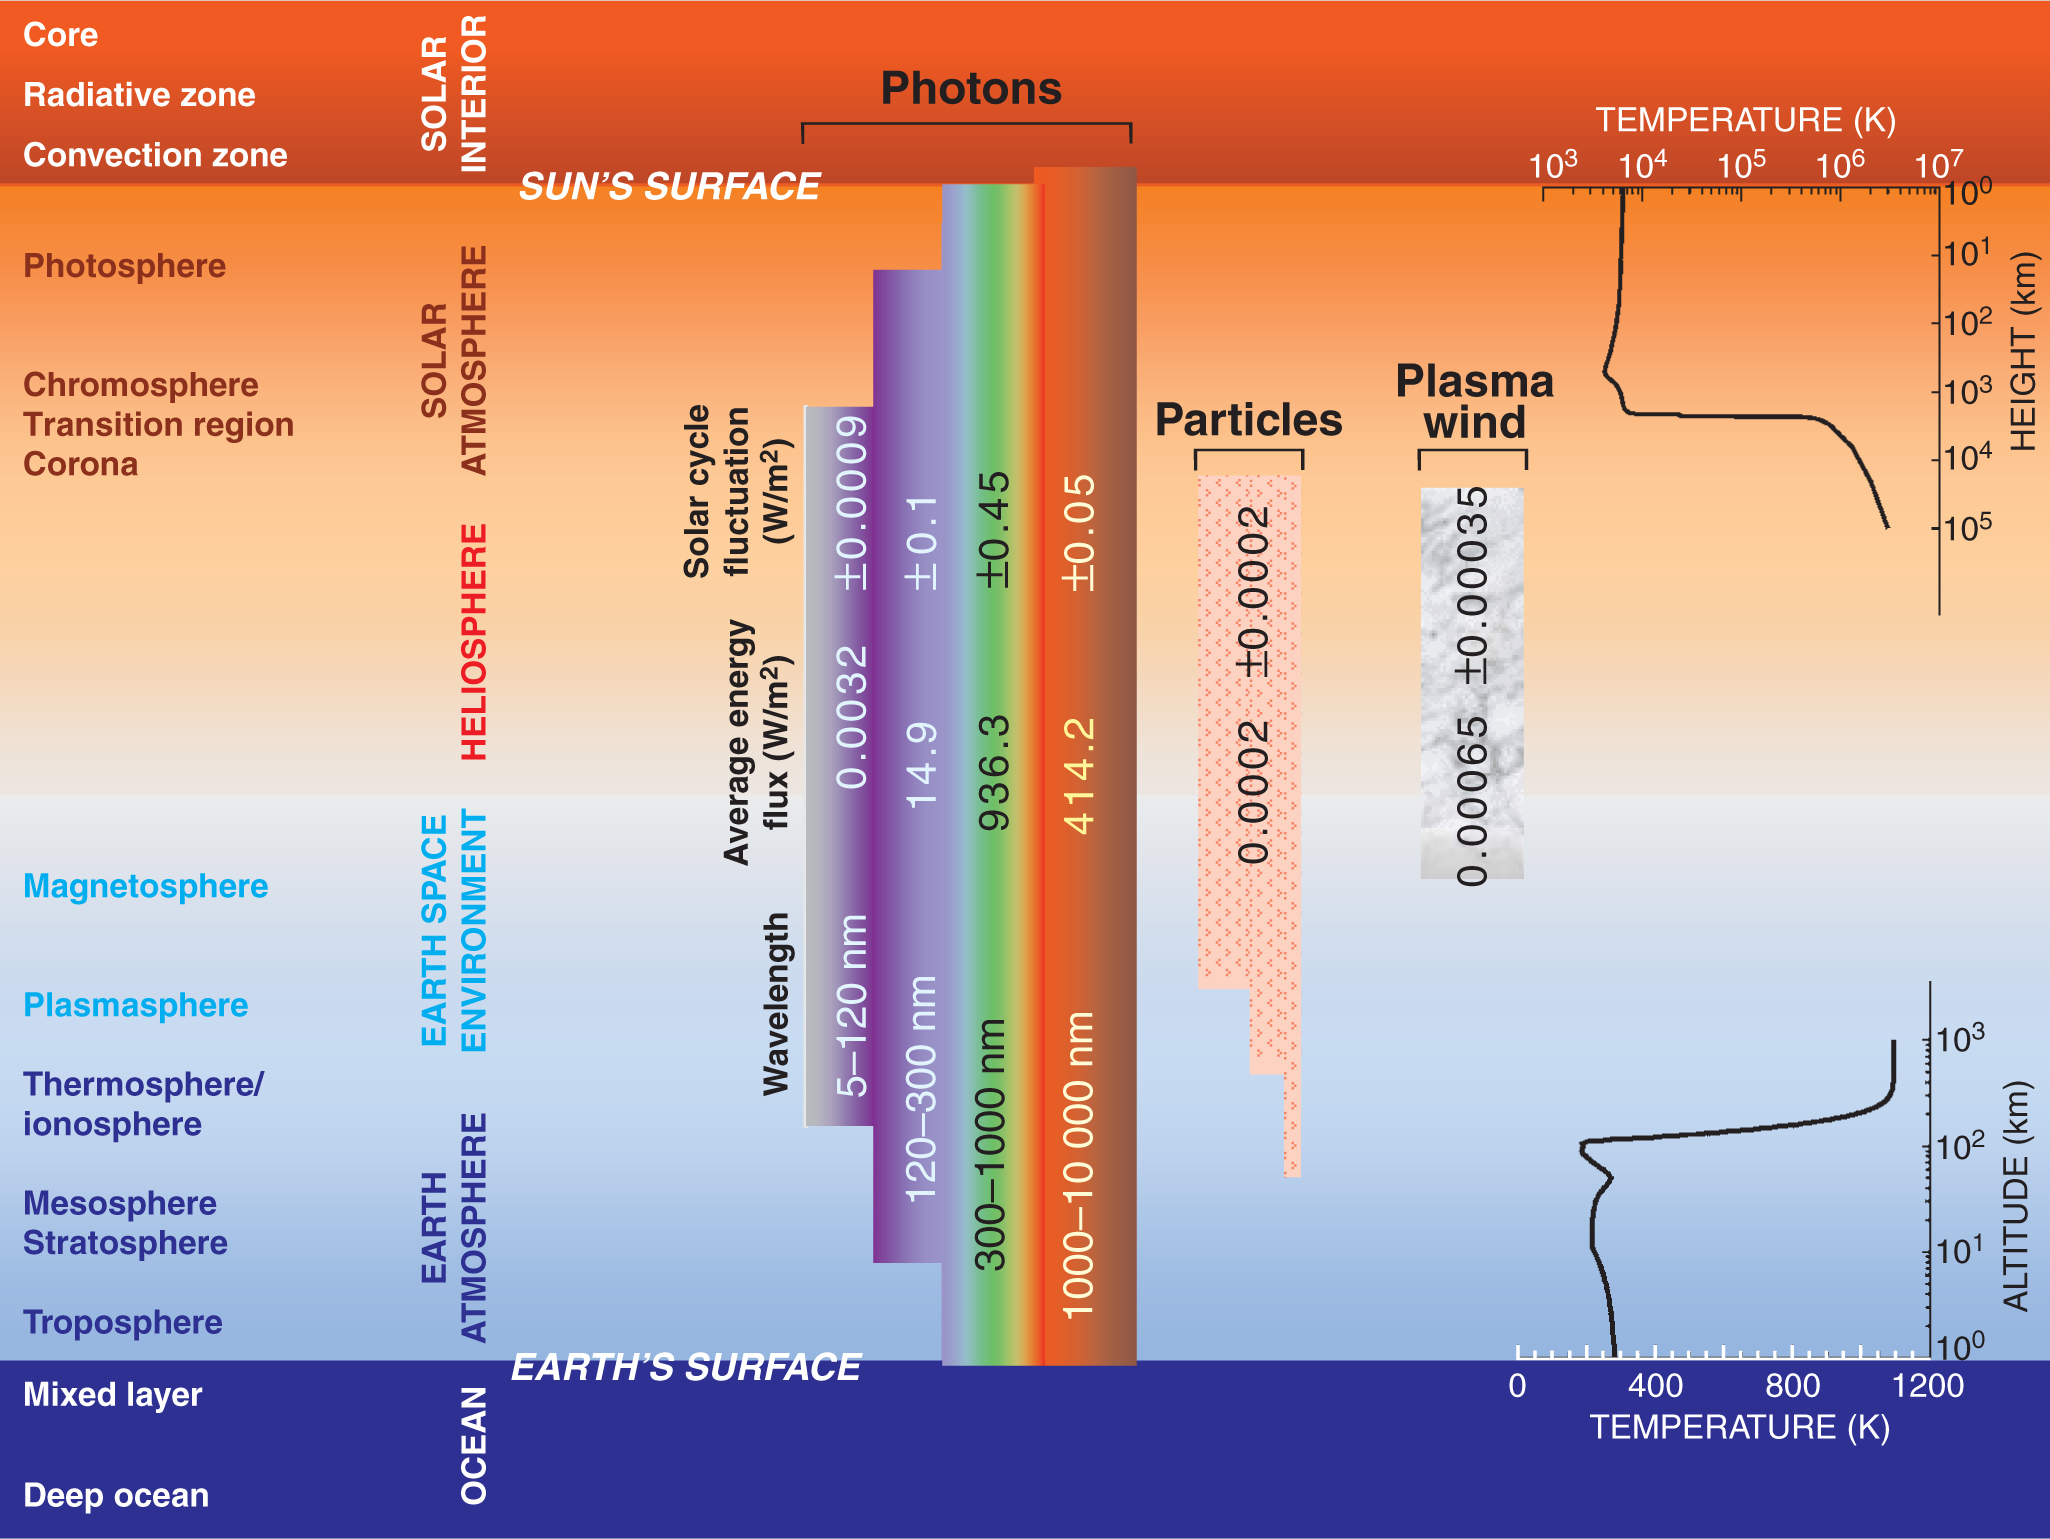

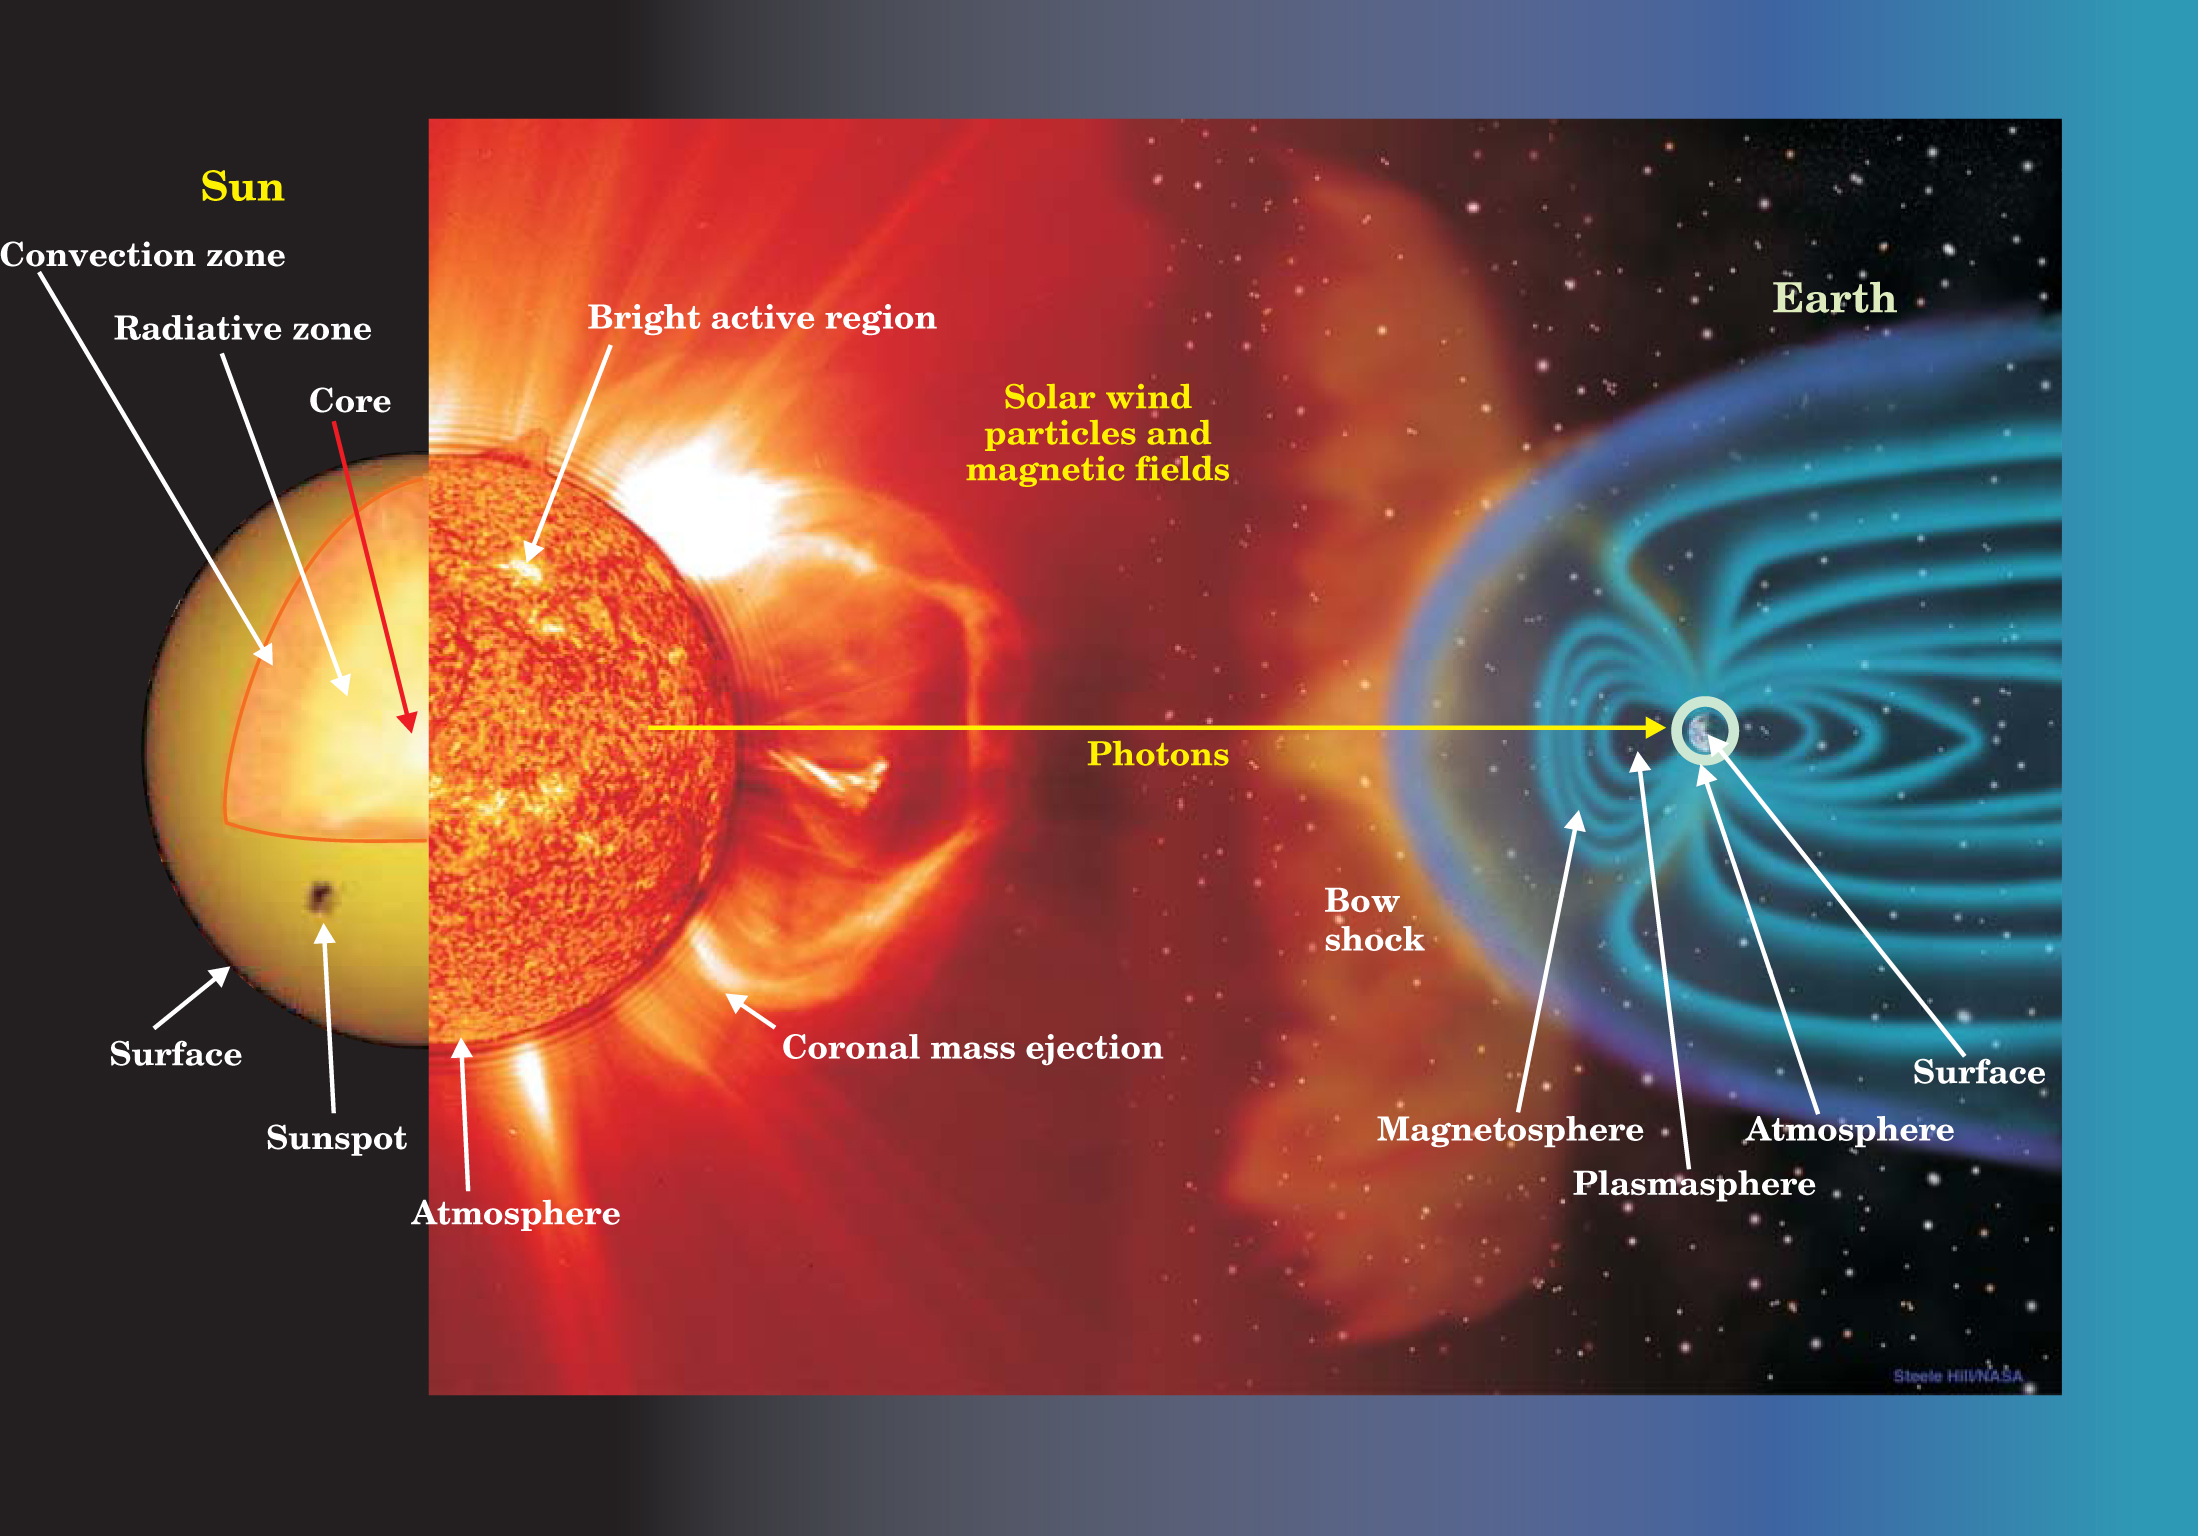
Figure 1. The Sun-Earth system. Energy in various forms is constantly flowing from the Sun to Earth. Dynamo action in the convection zone drives variations in this energy flow by producing sunspots and bright active regions. Photons from the Sun’s surface and atmosphere reach Earth’s surface and atmosphere, but particles and fields that together form the solar wind are intercepted by the magnetosphere (blue). Eruptive events such as coronal mass ejections, shown emerging from the Sun’s atmosphere into the solar wind, perturb the magnetosphere and allow energetic particles to penetrate Earth’s atmosphere in the polar regions, where the magnetic field lines are anchored.
(Figure not to scale.)
Radiative and convective processes transfer energy from the Sun’s core to its surface, a gaseous shell that radiates electromagnetic energy primarily at visible wavelengths. Solar photons reach Earth in eight minutes, where most are absorbed and reflected near the surface. This dominant energy flow from the Sun’s surface to Earth’s enables life by heating our planet, fueling photo-synthesis, and powering the interactions among oceans, land, and atmosphere that generate weather and climate. 1
Encapsulating Earth’s thin life-sustaining surface region is an atmosphere of mainly nitrogen and oxygen gases, itself enveloped by belts of magnetic field anchored at Earth’s poles. Ultraviolet photons emitted from the Sun’s atmosphere are absorbed and scattered in Earth’s atmosphere and establish the primary thermal structure there. 2 A supersonic wind stretches the Sun’s outer atmosphere throughout the solar system, confining and deforming the outer regions of Earth’s magnetic field to create an elongated region called the magnetosphere (see figure 1), which in turn traps impinging particles. 3 Although of much smaller magnitude, the aggregate energy from short-wavelength photons, particles, and fields maintains an infrastructure within the Sun–Earth system that protects the ecosphere from deleterious radiations and that both enables and affects advanced global technologies on which society increasingly relies.
The physical Sun–Earth system is sufficiently stable to have hosted some form of life for a few billion years. 1 By astrophysical standards, the Sun is hardly dynamic at all. 4 So assured was its quiescence that the total solar radiative output used to be called the solar constant, even though a prominent 11-year cycle in the dark sunspots appearing on the solar disk (see figure 1) forewarned of its inconstancy. Extensive solar observations made in the past few decades, primarily from space, reveal a breadth and complexity of the Sun’s variability that Galileo could scarcely have imagined when observing sunspots in 1613.
Similarly, those who, for more than a century, uncovered correlations of sunspots with such events as changes in grain prices, or famine in India, could not have envisioned the ensuing controversies their early evidence presaged. Dismissed as recently as 1978 as experiments in autosuggestion, Sun–climate connections are newly apparent in a plethora of high-fidelity paleoclimate indicators and in the contentious but unlikely claim that the Sun, rather than human-produced greenhouse gases, is the cause of global warming in the past century.
On shorter time scales, the raw power of the Sun to disrupt human endeavor was witnessed as early as 1859, when a solar eruption induced ground currents that burned US telegraph wires and caused large fires; in March 1989, a major solar storm again induced ground currents that triggered a blackout of northeastern North America and disrupted spacecraft orbits and operations. Today, a century after Marconi first used the ionosphere in 1901 to bounce radio waves around the globe, sophisticated space-based navigation, communication, and defense systems harness the Sun–Earth system for human advantage. The radio waves that transit the space environment near Earth, and the hardware assets that reside there, are still susceptible to solar-driven space “weather” cycles and storms.
Heating from electromagnetic radiation
Paramount for sustaining our habitat is the photon energy transfer that establishes Earth’s surface temperature as a balance between incoming radiation (with peak flux near 500 nm) from the Sun’s 5770-K surface and outgoing radiation (with peak flux near 10 µm) from Earth’s much cooler surface. 1 The Sun’s total radiative output of approximately 1365 W/m2 delivers a globally averaged 341 W/m2 to Earth, which then reflects some 31% of it. Absorption of the remaining radiation heats the surface and lowest atmosphere. Warmed to 255 K, Earth’s surface then emits IR photons that atmospheric gases such as carbon dioxide absorb and reradiate. This greenhouse effect traps additional energy that raises the surface temperature to a more hospitable global average of 288 K.
Atoms in the Sun’s atmosphere imprint upon the emergent blackbody spectrum signatures of hydrogen, helium, and a host of minor heavier elements in various states of ionization. 4 Densely packed absorption lines, identified by Joseph von Fraunhofer in 1817, deplete the Sun’s surface radiation, whereas hot ionized gases emit thousands of lines and a few weak continua and raise the extreme ultraviolet (EUV) flux of photons by many orders of magnitude above that of a 5770-K blackbody. At a few thousand kilometers above the Sun’s surface, the million-kelvin corona sustains a shroud of highly ionized gases whose emissions crowd the EUV and x-ray regions of the solar spectrum.
Solar UV and x-ray photons link the atmosphere of the Sun with that of Earth (see figure 2). Photon energy at wavelengths shorter than 300 nm is only about 1.5% of the Sun’s total radiative output, yet that energy is the primary source of heating for the entire terrestrial atmosphere at altitudes above 10 km. The energy transfer approximately maps increasingly higher layers of the Sun’s atmosphere to increasingly higher altitudes of Earth’s: Photons with wavelengths between 170 and 300 nm are emitted from the Sun’s photosphere and absorbed in Earth’s stratosphere and mesosphere, where they produce the ozone layer; photons at wavelengths shorter than 125 nm, emitted from the Sun’s chromosphere and corona, are absorbed in Earth’s thermosphere and create within it layers of ionized gases that compose the ionosphere.
Atoms and molecules in Earth’s atmosphere control the deposition of solar UV photon energy. Molecular oxygen plays a singularly important role in the process because it absorbs photons with energies greater than 5 eV (wavelengths below 242 nm) over a wide range of terrestrial altitudes. 2 The ensuing photodissociation produces atoms that combine with other oxygen molecules to create ozone at altitudes between 15 and 50 km. Ozone’s absorption of solar UV radiation at wavelengths between 200 and 300 nm heats the atmosphere, reversing its cooling trend away from the surface (figure 2) and driving radiative and dynamical processes that couple the middle and lower atmospheres.
At altitudes above about 100 km, the absorption of solar photons by both molecular and atomic oxygen and by molecular nitrogen heats the entire thermosphere. Additionally, photons with energies greater than about 12 eV (wavelengths less than about 100 nm) ionize these gases. Conducting ionospheric layers of electrons and ions are embedded in the neutral upper atmosphere from 50 to 1000 km; outward-flowing ions populate the plasmasphere, an intermediary between Earth’s ionosphere and magnetosphere that extends outward to a few Earth radii (figure 1). 3
Particles and fields
Charged particles with energies in the range of a few to billions of electron volts and magnetic fields with strengths from a few to tens of nanotesla populate space between the outermost atmospheres of the Sun and Earth. Interactions of the magnetic fields, which originate within both the Sun and Earth, structure geospace for hundreds of Earth radii, and they guide and contain the charged particles, which also have both solar and terrestrial origins. 3
A wind of mainly protons flows from the Sun’s continually expanding outer atmosphere. At a typical speed of 450 km/s, the particles reach Earth in about four days. They exit large dark “holes” in the Sun’s corona where magnetic fields extend into space instead of looping back to the solar surface. 4 This “open” magnetic flux is frozen into the low-density solar-wind plasma, which carries it past Earth. In deflecting the solar wind, Earth’s dipole magnetic field distorts to form the magnetosphere around the cooler plasmasphere. Sunward of Earth, the magnetosphere is a compressed bulge terminated around 10 Earth radii by the bow shock (figure 1); downwind it forms the magnetotail, a stretched teardrop extending for many hundreds of Earth radii. Although the solar wind typically transports less than one-millionth of the Sun’s electromagnetic energy (figure 2), it transfers to the magnetosphere and ionosphere hundreds of billions of watts a day, an amount comparable to human power generation. 3
Within the magnetosphere, two concentric doughnut-shaped belts of magnetic field surround Earth. Named after James Van Allen, who discovered them in 1958, the belts are populated with charged particles of much higher energies than those in the solar wind. Many of the particles are protons ejected by collisions of galactic cosmic rays with atmospheric gases; others are produced from the ionization of Earth’s neutral atmosphere by solar EUV photons; still others come from the outer solar atmosphere. 3 Solar and magnetospheric particles can deposit their energy in collisions with gases in Earth’s atmosphere, mostly in the vicinity of 100–400 km at high latitudes where magnetic field lines connect the magnetosphere to the denser lower thermosphere. The collisions excite oxygen and nitrogen molecules that then decay, emitting auroral light. 2,3 Very energetic particles—of both solar and galactic origin—can penetrate to Earth’s lower atmosphere, where they alter the chemistry of stratospheric and tropospheric gases, and thus deplete ozone and produce isotopes of many species. 3 On reaching Earth, galactic cosmic rays initiate a complex chain of interactions that produce the isotopes carbon-14 and beryllium-10, whose concentrations in, respectively, tree-rings (as 14CO2) and ice (from aerosol precipitation) contain information about the local space environment. 5
Variability in modern times
Fluctuations in the Sun’s energy ceaselessly agitate the Sun–Earth system with a fundamental cadence near 11 years. 4 This quasiperiodic forcing arises from the significant photon and plasma changes that accompany cycles in solar activity, which in turn relate intimately to variations in magnetic flux in the Sun’s atmosphere. The driver of solar activity—and hence of Sun–Earth system variability—is a dynamo near the bottom of the outer one-third of the Sun’s interior (see the article by Eugene Parker in June 2000, page 26 ). The rate at which the Sun’s layers of ionized gases rotate varies with latitude and radius, and the strong magnetic fields generated by the differential rotation rise buoyantly to the Sun’s surface. Coriolis forces impart to this emerging active-region flux a north–south component, the direction of which alternates from one solar cycle to the next. A combination of turbulent convection and meridional flow then transports the active-region fields poleward, which leads to a reversal of the polar fields. The cycle period is related to the global meridional circulation, which is directed poleward at the solar surface but toward the equator at the bottom of the convection zone.
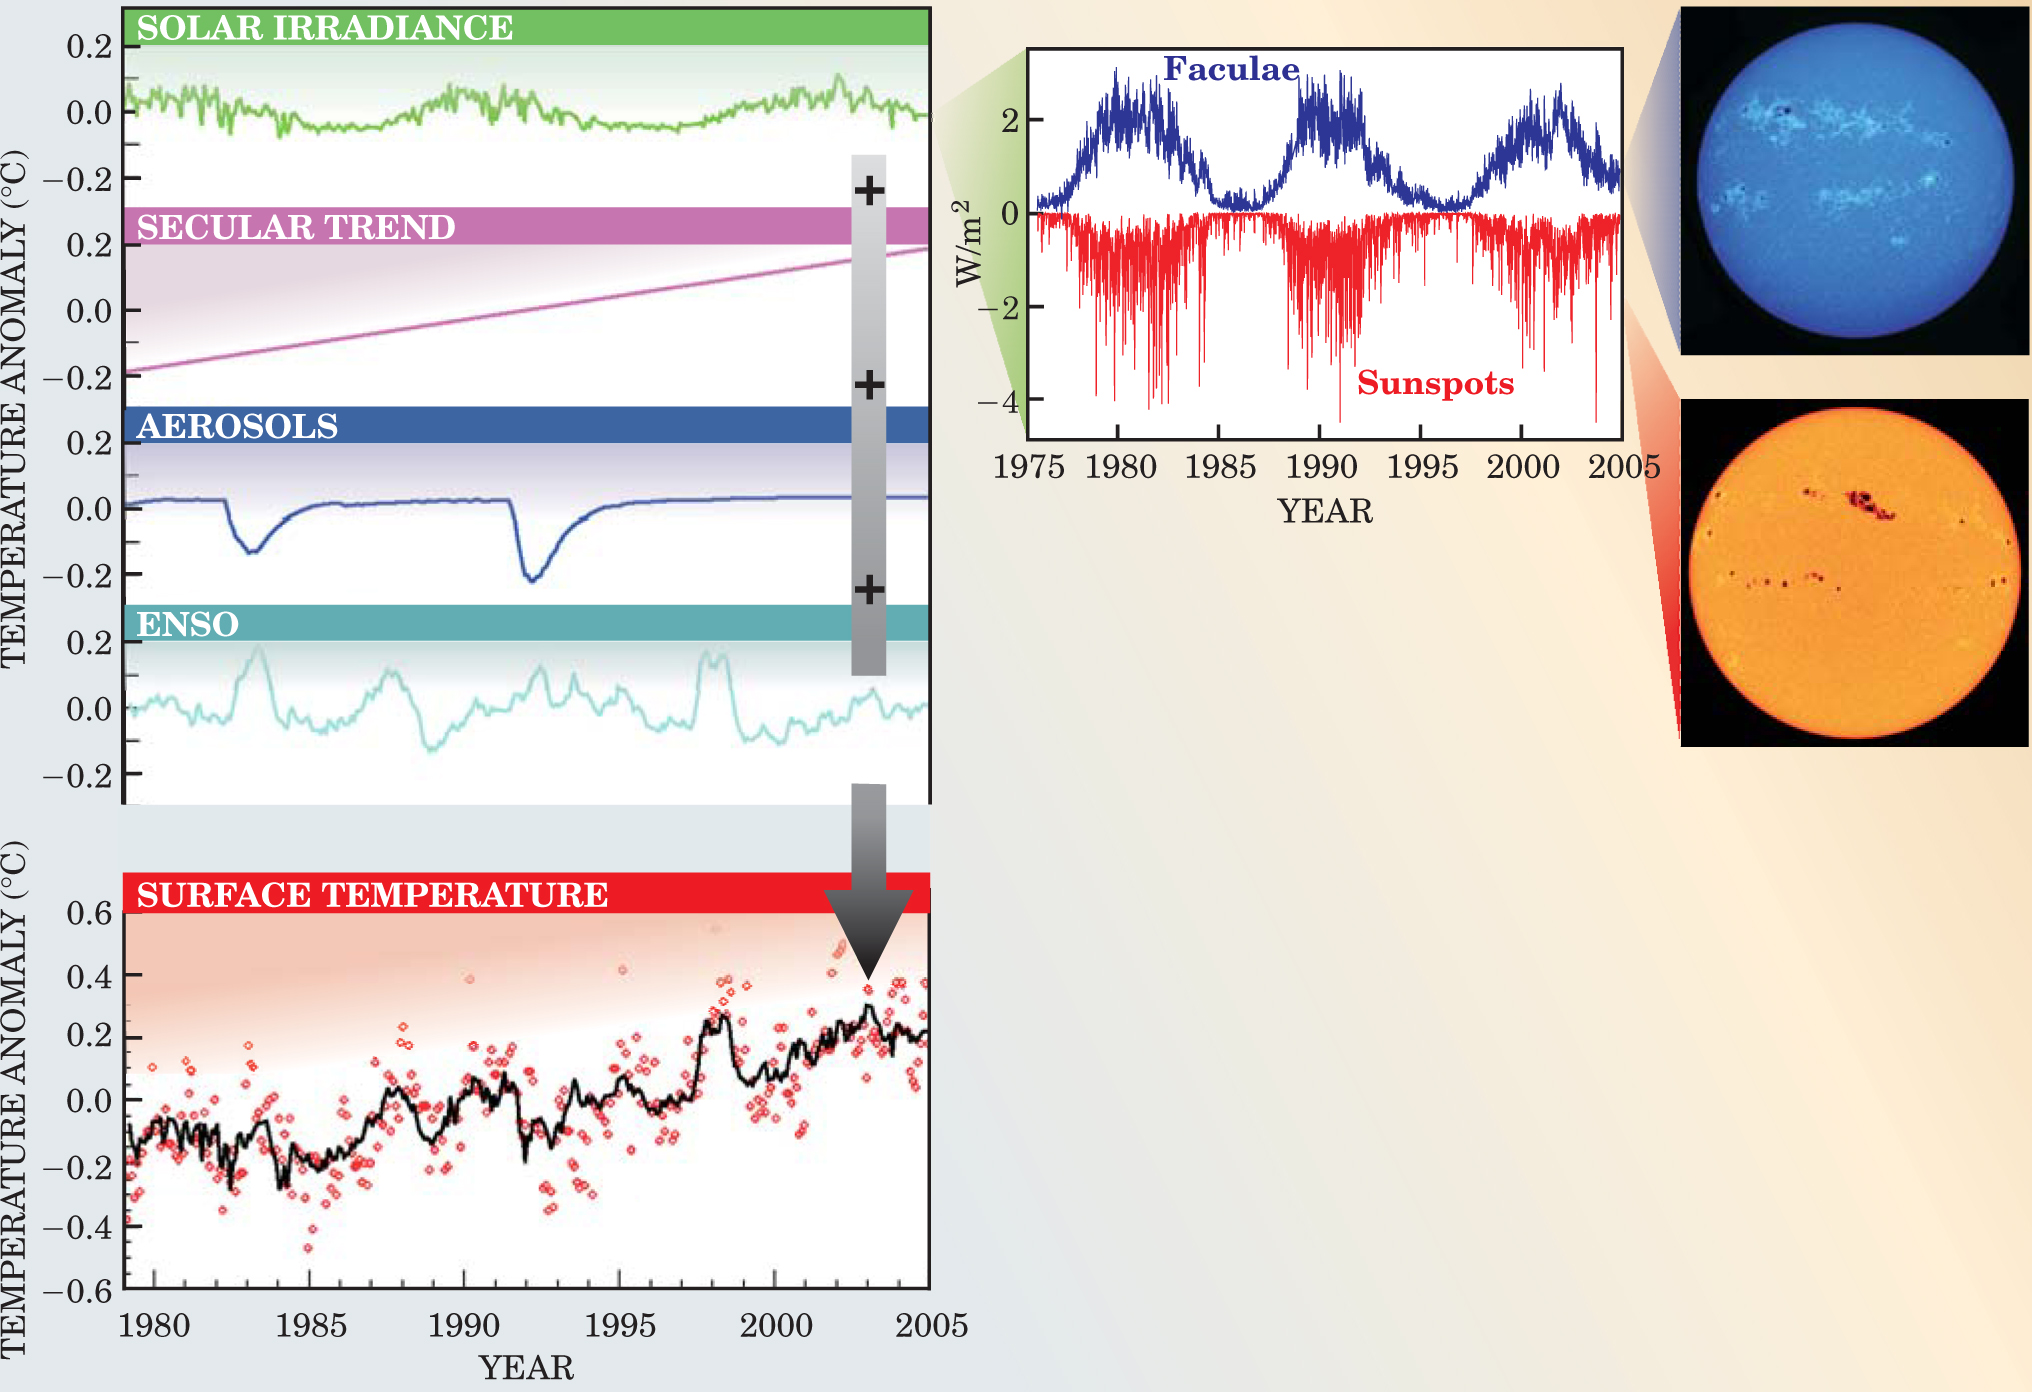
Magnetic flux is not distributed smoothly over the Sun’s surface or through its atmosphere. Rather, it is concentrated in discrete structures that modify the local temperature and density, thereby altering the Sun’s radiative output. 4 Space-based radiometers record a net increase of 0.1% in total solar brightness during activity maxima, the result of a 1 W/m2 reduction by dark sunspots and a 2 W/m2 enhancement due to bright photospheric features called faculae. 6 Figure 3 illustrates these competing effects in recent times. Because of enhanced emission in active regions overlying faculae, UV radiation also increases when solar activity is high. The impact of active regions on the Sun’s photon output increases with height of the photon production in the solar atmosphere: Upper-photospheric radiation at 200 nm increases by 8% during the 11-year activity cycle, whereas coronal x rays increase by more than an order of magnitude. 4,6

Figure 3. The variation in Earth’s monthly mean global surface temperature is shown in the bottom panel by the red symbols. A statistical multiple regression model, shown by the black line, reproduces significant temperature variance by combining variations in solar irradiance (top panel); a secular trend, possibly anthropogenic (second panel); volcanic aerosols (third panel); and a measure of the El Niño Southern Oscillation (fourth panel). ENSO and volcanoes cause changes of 0.2–0.3 K on time scales of months, whereas solar irradiance is associated with a 0.1-K decadal cycle. The irradiance cycle arises from the competing effects of sunspots and bright areas called faculae; the two features are evident in the solar images on the right and produce the effects on daily irradiance shown above.
Terrestrial responses to solar activity increase with altitude, eventually dominating other natural and anthropogenic influences. The temperature near Earth’s surface increases by less than 0.1 K in response to a 1 W/m2 increase in total solar brightness. 7 Figure 3 illustrates an empirical identification of this modest solar component in the past 26 years, in comparison with a secular trend (attributed to changing concentrations of greenhouse gases and industrial aerosols), volcanic aerosols, and the El Niño Southern Oscillation (ENSO)—a source of natural climate variability (see the article by J. David Neelin and Mojib Latif in December 1998, page 32 ). An order-of-magnitude larger cycle of UV radiation initiates still modest but definitive temperature changes that reach 1 K at an altitude of 50 km. 7 Solar-induced stratospheric ozone changes are a few percent, comparable to a secular decrease (primarily from increasing chlorofluorocarbon concentrations) and natural variations driven by oscillating equatorial stratospheric winds. 8 Near 500 km, the temperature increases a dramatic 500 K in response to fluctuations of a factor of two or more in EUV and x-ray photons. 9 The accompanying increases in neutral density are an order of magnitude or more, greatly exceeding the decrease of a few percent per decade associated with cooling due to increased greenhouse-gas concentrations. 9 Identifying and quantifying the diverse causes of contemporary change throughout the Sun–Earth system are ongoing challenges.
Rapid variations and space storms
Sporadic solar energy outbursts punctuate quasicyclic changes and can modify the Sun–Earth system rapidly and substantially, especially in the regime where the extended atmosphere of the Sun connects with the space environment near Earth. 10 Such events occur when coronal magnetic fields abruptly reconnect, typically in sites overlying large dynamic sunspots, and are possibly instigated by the motions of the foot points that anchor the fields to the Sun’s surface. The flux of high-energy photons from the Sun’s atmosphere then rapidly increases by large factors and causes the electron densities in Earth’s atmosphere to rapidly increase by many tens of percent. Ejected coronal mass propels billions of tons of charged particles through the solar wind at three to four times the wind’s normal speed. This fast-moving plasma drives shocks that produce near-relativistic energetic particles that reach Earth within an hour, followed a day or so later by the shock and its driver plasma.
Substantial magnetic field reconnection occurs again, this time near Earth. The reconfiguration of solar and terrestrial magnetic fields initially erodes the upwind magnetosphere, then the geomagnetic fields reconnect to restore the magnetosphere’s pre-storm configuration. The rapid motions of the fields accelerate particles toward Earth, where their precipitation produces aurorae and heating in polar regions and depletes ozone. The localized heating migrates to lower latitudes over a period of hours to days, altering both neutral and ion densities on global scales. In recent years, an unprecedented suite of spacecraft has traced the energy flow from the Sun to Earth during some of the most severe storms of the space age. Ongoing analyses of the “Bastille Day” (July 2000) and “Halloween” (October 2003) events are revealing new insights into processes that drive abrupt changes in the Sun–Earth system. 11
Modeling the variations
Agreement between observations and model simulations of Sun–Earth system variability differs markedly among different regimes. A major enigma is that general circulation climate models predict an immutable climate in response to decadal solar variability, whereas surface temperatures, cloud cover, drought, rainfall, tropical cyclones, and forest fires show a definite correlation with solar activity. 12
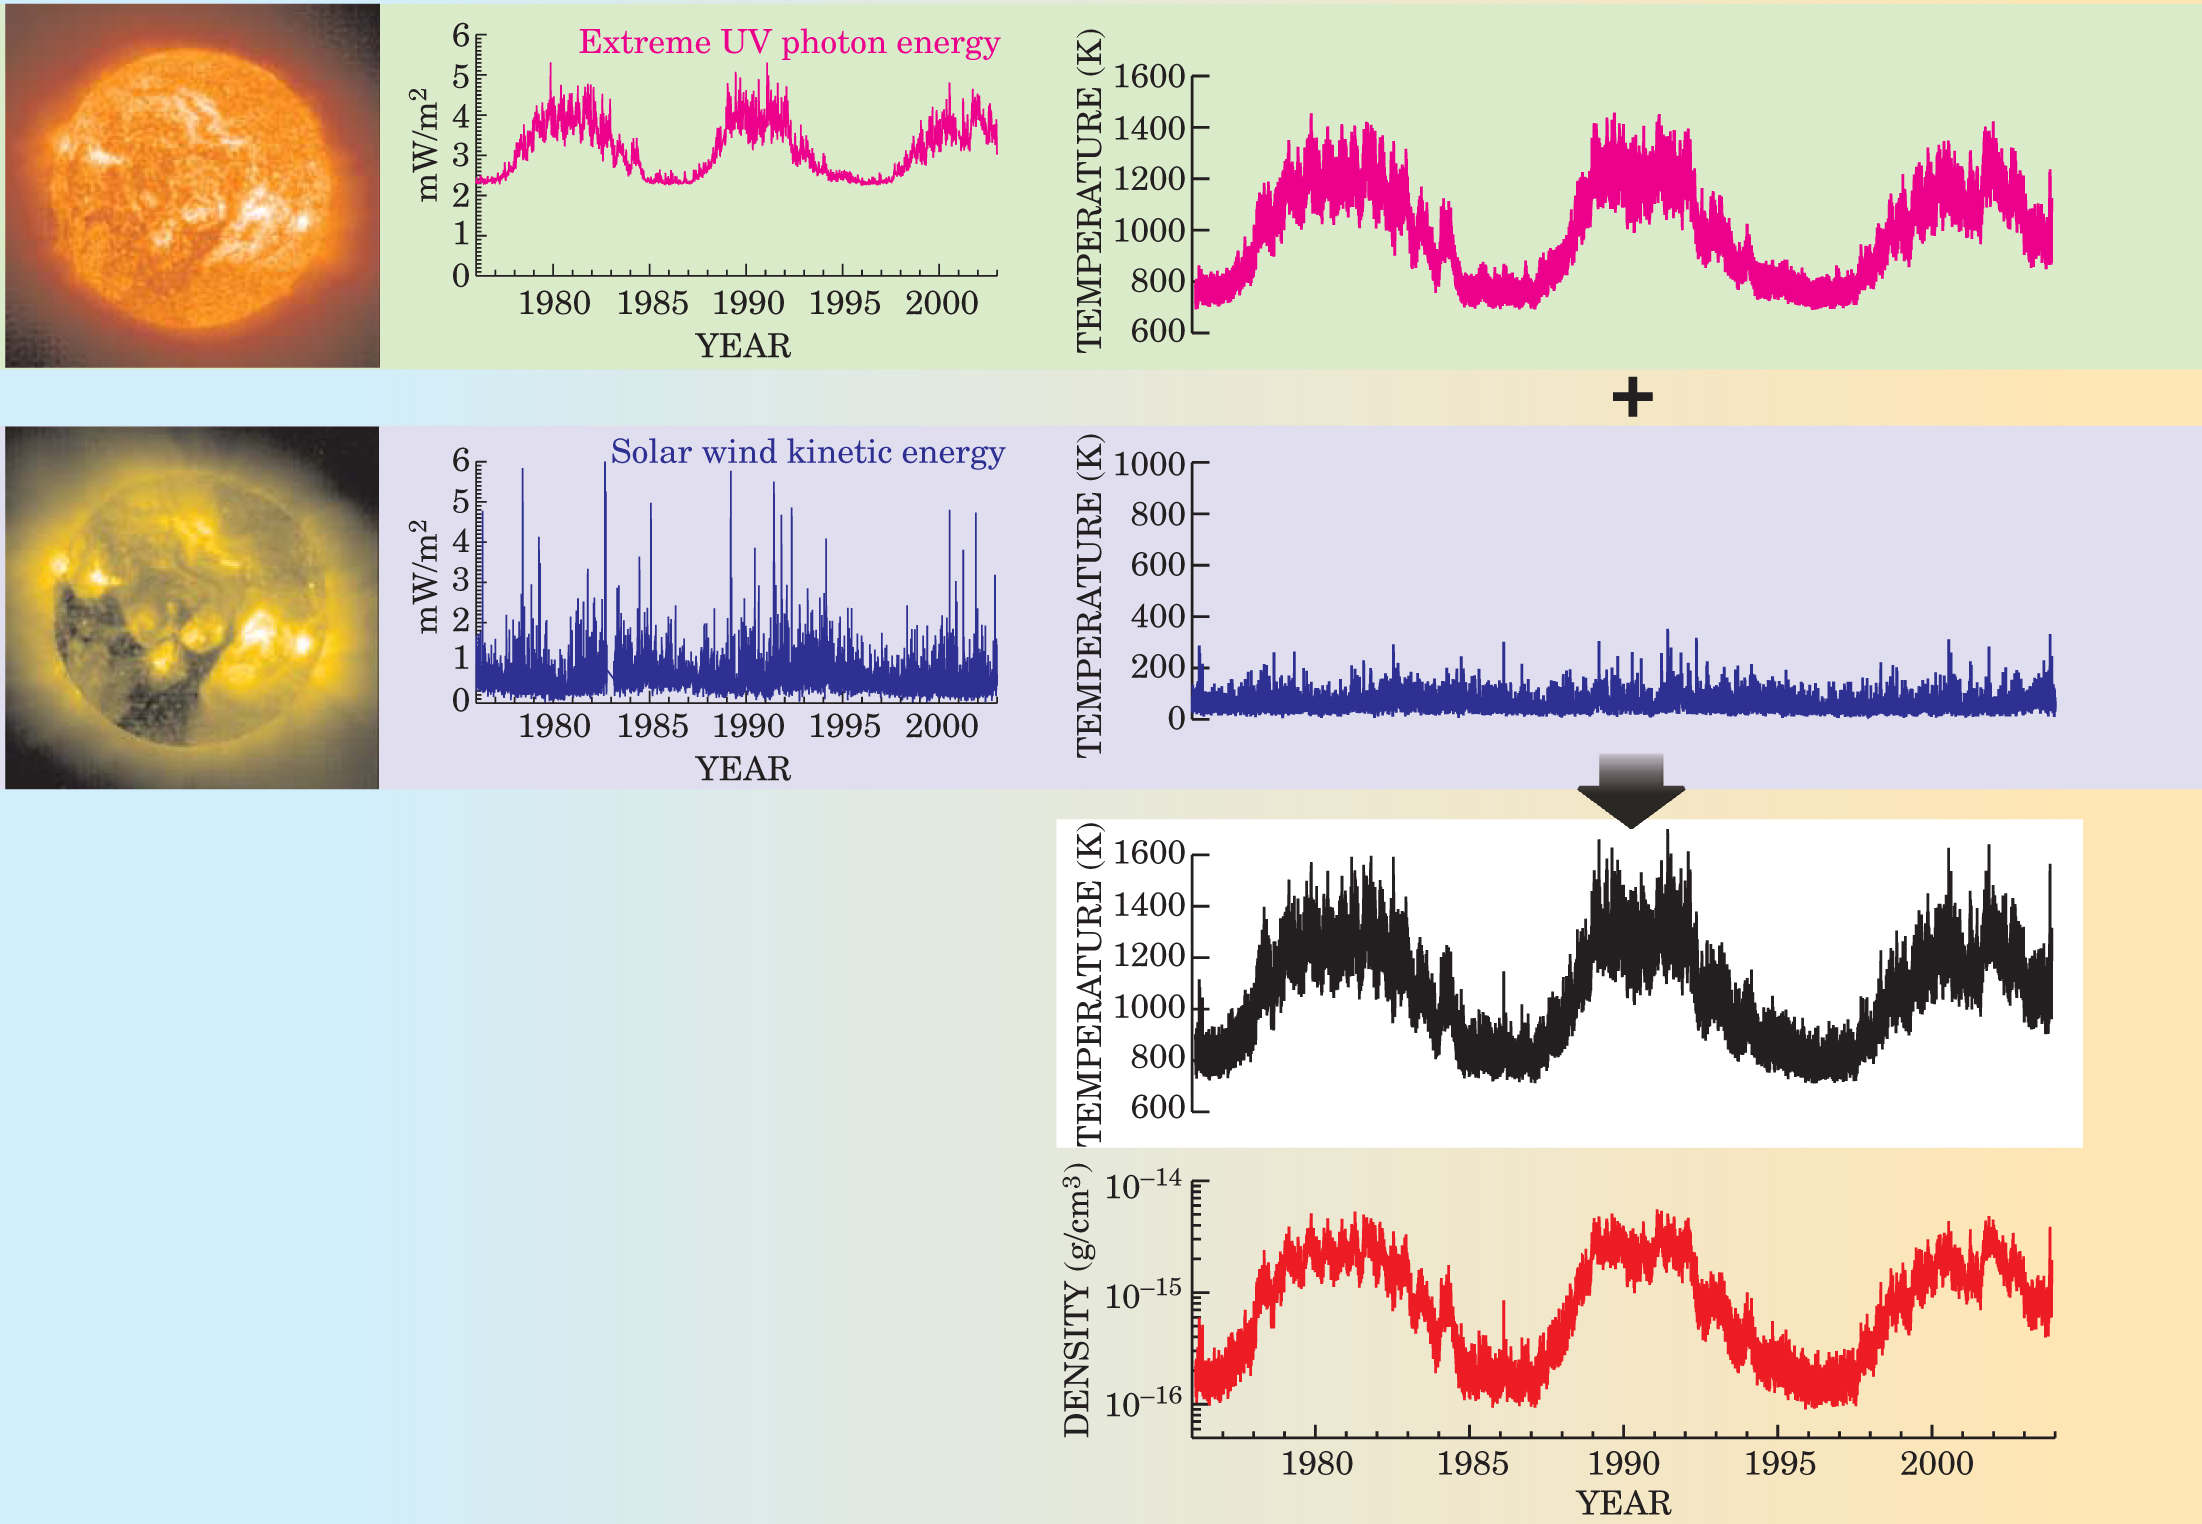
For example, when responses to the observed 11-year cycle in total radiative output are modeled, the resulting surface-temperature changes at Earth are a factor of five smaller than those deduced from empirical deconstruction of the surface-temperature record (figure 3). Either the empirical evidence is deceptive or the models are inadequate—in their parameterization of feedbacks such as cloud processes and atmosphere–ocean couplings, for instance, or in their neglect of indirect responses by the stratosphere and amplification of naturally occurring internal modes of climate variability. In contrast, general circulation models of the coupled thermosphere and ionosphere predict dramatic responses to changing solar energy inputs (figure 4), but a lack of global datasets precludes comprehensive validation. 9

Figure 4. Fluctuations in Earth’s upper atmosphere at 500 km over Boulder, Colorado, at noon, as estimated by a semiempirical model.
Attempts are under way to model large fractions of the Sun–Earth system. General circulation models are being extended to cover Earth’s entire atmosphere from the surface to an altitude of a few hundred kilometers. Initial results demonstrate the importance of vertical coupling in propagating and amplifying forcing from below, by ENSO and by gravity and planetary waves, as well as from above, by solar flux. This “lifting the lid” of climate models is expected to improve our understanding of solar-induced stratospheric influences on the troposphere. Additionally, plasma models are integrating the environments of the solar wind, magnetosphere, and ionosphere. Ultimate integration of the atmosphere and plasma models promises a new quantitative depiction of the whole Sun–Earth system.
Understanding variability in the past
Since its formation about 4.5 billion years ago, the Sun–Earth system has evolved through epochs both warmer and colder than present. Earth’s changing aspect to the Sun generates so-called Milankovitch cycles of ice ages, evident in the past few million years by global temperatures 5–7 K cooler than the current interglacial epoch—the Holocene—that covers the past 10 000 years. 1 Various high-resolution paleoclimate records in ice cores, tree rings, lake and ocean sediment cores, and corals suggest that changes in the energy output of the Sun itself may have contributed to Sun–Earth system variability. 13 Many geographically diverse records of past climate are coherent over time, with periods near 2400, 208, and 90 years that are also present in the 14C and 10Be archives. Reconstructions of actual climate forcings and surface temperatures in the past millennium suggest that solar and volcanic activity produced changes of a few tenths of a kelvin and together account for significant preindustrial global surface temperature variance. 14
The most recent and best documented example of preindustrial climate response to solar and volcanic radiative perturbations is an epoch from 1450 to 1850, when temperatures were 0.3–1 K colder than at present. The beginning of this “Little Ice Age” coincided with anomalously low solar activity (the so-called Spörer and Maunder minima); the latter part coincided with both low solar activity (the Dalton minimum) and volcanic eruptions of Tambora in Indonesia (1815) and Coseguina in Nicaragua (1835). But many uncertainties preclude a definitive understanding of the Sun’s role in the Little Ice Age. 12 The actual reduction of total radiative output is uncertain; it perhaps was as small as 0.05%. Although cosmogenic isotopes were indeed elevated, indicating very low levels of solar activity, those levels are insufficient to account for the large cosmic-ray modulation suggested by 10Be. The overall cooler European temperatures suggest a solar-induced stratospheric influence on the naturally occurring pressure oscillation in the Arctic and North Atlantic regions (see the article by John M. Wallace and David W. J. Thompson in February 2002, page 28 ). Or might the Little Ice Age be simply the most recent cool episode of millennial climate-oscillation cycles?
Another puzzle of past climate is the apparent sensitivity of drought and rainfall to solar variability, especially in tropical locations vulnerable to altered circulation patterns. For example, high solar activity correlates with drier conditions in the Yucatan and equatorial East Africa 13 and with wetter conditions in Oman. Model simulations and analysis of contemporary climate do suggest that higher solar activity strengthens regional precipitation regimes, including the monsoons 15 (perhaps affecting famine in India). There may be other causes in addition to solar variability, since solar signals are absent in some climate records and intermittent in others. Nor are climate models generally able to reproduce the plethora of Sun–climate correlations. In fact, simulations with climate models yield decadal and centennial variability even in the absence of external forcing. Arguably, this very sensitivity of the climate system to unforced oscillation and stochastic noise predisposes it to nonlinear responses to small forcings such as by the Sun.
A crucial challenge for understanding the Sun–Earth system’s past is the correct interpretation of the 14C and 10Be cosmogenic isotopes, whose correlations with many paleoclimate records (see the article by Edouard Bard in December 2002, page 32 ) underpin the arguments for a Sun–climate connection in the Holocene. 5,13 The isotopes actually do not reflect the closed magnetic fields in sunspots and faculae that modulate irradiance but instead the solar-induced changes that impede the passage of cosmic rays through the plasma environment near Earth. 16 Some suggest that cosmic rays themselves cause climate change (for example, by affecting cloud nucleation sites), even though the energy change associated with cosmic-ray variability is one-millionth of the Sun’s electromagnetic energy change. Since climate itself can affect the deposition of the cosmogenic isotopes in ice and trees, the 14C and 10Be records may also indicate terrestrial variability rather than solar. Ultimately, a complete specification of the physical processes within the entire Sun–Earth system will be needed to resolve these issues.
Societal consequences
Perturbations to the Sun–Earth system are of practical concern when habitats are threatened by changes in both climate and the ozone layer 17 or when “weather” in the upper atmosphere and space environment interferes with society’s increasingly complex technological infrastructure. 18
Archaeological and paleoclimate records suggest that ever since the earliest civilizations formed around 12 000 years ago, climate change, possibly linked with the Sun, may have contributed to societal deterioration. For example, droughts in the Yucatan peninsula appear to have an approximate 208-year cycle in phase with decreased levels of cosmogenic isotopes, which indicate periods of higher solar activity. Along with famine and political unrest, drought may have contributed to the decline of the Mayan civilization around AD 800. Indigenous cultures in equatorial East Africa also prospered during wetter times that coincided with the Spörer and Maunder minima. 14
Contemporary habitat pressure is primarily from human activity rather than solar. The atmospheric concentration of CO2 has increased 31% since 1750. A doubling of greenhouse-gas concentrations is projected to warm Earth’s surface by 4.2 K. Solar-driven surface temperature changes are substantially less, unlikely to exceed 0.5 K and maybe as small as 0.1 K (see, for instance, figure 3). Nevertheless, they must be reliably specified so that policy decisions on global change have a firm scientific basis. Furthermore, climate encompasses more than surface temperatures, and future surprises, perhaps involving the Sun’s influence on drought and rainfall, are possible.
Chlorofluorocarbons, used as refrigerants and industrial solvents, are inert in the troposphere but are dissociated in the stratosphere by solar UV photons to produce radicals that deplete ozone. A thinning ozone layer from increasing levels of chlorofluorocarbons since the 1970s exposes biological organisms to increasing levels of UV–B radiation, which may increase skin-cancer and cataract rates and deplete immune systems. Ozone levels are expected to recover in about 50 years as a result of the reductions in chlorofluorocarbons specified by the Montreal Protocol in 1987. 17 The solar-driven ozone cycle, which is comparable in magnitude to the anthropogenic decline, complicates the early detection of this recovery. 8
Humans and hardware deployed beyond Earth’s surface are susceptible to more immediate effects of Sun–Earth system variability. 10,18 After solar eruptions, energetic particles can damage space-based technological systems and threaten the health of astronauts and aircraft passengers over polar regions when the particles penetrate Earth’s atmosphere. Induced ground currents can debilitate the electric grid, as happened in 1989. Solar cycles and eruptions also threaten human safety and national security when ionospheric disturbances interrupt wireless navigation and communication. Management of communication frequencies relies on knowledge of the electron density in the ionosphere, which depends critically on solar activity. Solar-driven atmospheric density fluctuations, illustrated in figure 4, can alter the orbits of the tens of thousands of objects in low-Earth orbit.
Scientific curiosity and societal utility both call for a robust understanding of the Sun–Earth system. How much of Earth’s recent surface warming is induced by solar rather than anthropogenic forcings? When will the recovery of the ozone layer be truly discernible against the backdrop of solar-induced changes? Will an eruptive solar event be benign or deadly for space instruments and astronauts alike? Might resultant effects on navigation, communication, and Earth-orbiting objects compromise security when their effects are mistaken for adversaries? Can we mitigate and predict these effects? In seeking answers to such questions, once-disparate fields are coalescing slowly and a new paradigm is emerging—of the Sun and Earth as one unified system, our home in space that extends well beyond the surface where we live.
Funding by NASA and the Office of Naval Research is gratefully acknowledged, as are interactions and collaborations with many Sun and Earth scientists, especially those in the Naval Research Laboratory’s space science division, and D. Rind at NASA’s Goddard Institute for Space Studies.
References
1. W. F. Ruddiman, Earth’s Climate: Past and Future, W. H. Freeman, New York (2001).
2. P. M. Banks, G. Kockarts, Aeronomy, Academic Press, New York (1973)
G. Brasseur, S. Solomon, Aeronomy of the Middle Atmosphere, Reidel, Boston (1984) https://doi.org/10.1007/978-94-009-6401-3 .3. J. K. Hargreaves, The Solar-Terrestrial Environment: An Introduction to Geospace—The Science of the Terrestrial Upper Atmosphere, Ionosphere, and Magnetosphere, Cambridge U. Press, New York (1992)
J. G. Lyon, Science 288, 1987 (2000) https://doi.org/10.1126/science.288.5473.1987 .4. P. V. Foukal, Solar Astrophysics, Wiley, New York (1990).
5. E. Bard, G. M. Raisbeck, F. Yiou, J. Jouzel, Earth Planet. Sci. Lett. 150, 453 (1997) https://doi.org/10.1016/S0012-821X(97)00082-4 .
6. C. Fröhlich, J. Lean, Astron. Astrophys. Rev. 12, 273 (2004).
7. D. Douglass, B. D. Clader, Geophys. Res. Lett. 29, 1786 (2002) https://doi.org/10.1029/2002GL015345
H. Gleisner, P. Thejll, Geophys. Res. Lett. 30, 1711 (2003) https://doi.org/10.1029/2003GL017129 .8. W. Steinbrecht, H. Claude, P. Winkler, J. Geophys. Res. 109, D02308 (2004) https://doi.org/10.1029/2003JD004284 .
9. J. M. Picone, A. E. Hedin, D. P. Drob, A. C. Aikin, J. Geophys. Res. 107, 1468 (2002) https://doi.org/10.1029/2002JA009430
D. J. Gorney, Rev. Geophys. 28, 315 (1990) https://doi.org/10.1029/RG028i003p00315
J. T. Emmert, J. M. Picone, J. L. Lean, S. H. Knowles, J. Geophys. Res. 109, A02301 (2004) https://doi.org/10.1029/2003JA010176 .10. M. J. Carlowicz, R. E. Lopez, Storms from the Sun, Joseph Henry Press, Washington, DC (2002).
11. R. R. Meier et al., Geophys. Res. Lett. 29, 1461 (2002) https://doi.org/10.1029/2001GL013956
C. H. Jackman, R. D. McPeters, G. J. Labow, E. L. Fleming, C. J. Praderas, J. M. Russell, Geophys. Res. Lett. 28, 2883 (2001). The American Geophysical Union is planning a joint special publication in three journals in 2005 on the Halloween storms https://doi.org/10.1029/2001GL013221 .12. J. Haigh, Science 294, 2109 (2001) https://doi.org/10.1126/science.1067013
D. Rind, Science 296, 673 (2002) https://doi.org/10.1126/science.1069562 .13. D. Verschuren, K. R. Laird, B. F. Cumming, Nature 403, 410 (2000) https://doi.org/10.1038/35000179
D. A. Hodell, M. Brenner, J. H. Curtis, T. Guilderson, Science 292, 1367 (2001) https://doi.org/10.1126/science.1057759
G. Bond, B. Kromer, J. Beer, R. Muscheler, M. N. Evans, W. Showers, S. Hoffmann, R. Lotti-Bond, I. Hajdas, G. Bonani, Science 294, 2130 (2001) https://doi.org/10.1126/science.1065680 .14. P. D. Jones, M. E. Mann, Rev. Geophys. 42, RG2002 (2004) https://doi.org/10.1029/2003RG000143 .
15. H. van Loon, G. A. Meehl, J. M. Arblaster, J. Atmos. Sol. Terr. Phys. 66, 1767 (2004) https://doi.org/10.1016/j.jastp.2004.06.003 .
16. Y.-M. Wang, J. L. Lean, N. R. Sheeley Jr, Astrophys. J. (in press).
17. J. T. Houghton et al., eds., Climate Change 2001: The Scientific Basis: Contribution of Working Group I to the Third Assessment Report of the Intergovernmental Panel on Climate Change, Cambridge U. Press, New York (2001)
World Meteorological Organization,Scientific Assessment of Ozone Depletion: 2002, Global Ozone Research and Monitoring Project—rep. no. 47, WMO, Geneva, Switzerland (2003).18. Committee for Space Weather, The National Space Weather Program: The Implementation Plan, 2nd ed., rep. no. FCM-P31-2000, National Space Weather Program Council, Washington, DC (July 2000), available at http://www.ofcm.gov/nswp-ip/tableofcontents.htm .
More about the authors
Judith Lean is a physicist at the Naval Research Laboratory’s E. O. Hulburt Center for Space Research in Washington, DC.
Judith Lean, Naval Research Laboratory’s, E. O. Hulburt Center for Space Research, Washington, DC, US .


