Imaging cancer with photoacoustic radar
DOI: 10.1063/PT.3.3554

Cancer is a classic example of a disease that must be diagnosed early to be effectively treated or cured. Responsible for one in every four American deaths, it is the second leading cause of death in the US and a major health problem worldwide. Technological advancement, increased cancer awareness, and an aging, increasingly susceptible population have spurred the development of a host of early detection modalities, including magnetic resonance imaging, ultrasound, positron emission tomography, x-ray imaging, and optical—or biophotonic—imaging. Yet current diagnostic imaging technologies are too complex and expensive for widespread use, expose patients to hazardous radiation, or aren’t sensitive enough to detect nascent tumors.
In the past decade, photoacoustic (PA) imaging, in which subsurface tissue is excited with light and then imaged with ultrasound, has emerged as a promising complement to those technologies. It lacks the hazardous high magnetic fields of MRI and the ionizing radiation of x-ray imaging and positron emission tomography; it can image several centimeters beneath the skin, well below the millimeter depths typical of purely optical methods such as optical coherence tomography; and it can distinguish between blood-rich tumors and normal tissue with a contrast of up to 450%—better than clinical ultrasound, MRI, and x-ray mammography. 1 , 2 (Contrast is the ability to differentiate between a feature and its surroundings, whereas resolution is the ability to differentiate between two closely spaced features.) No other imaging technology in use today is more sensitive to the presence of angiogenetic tumors—those that develop blood vessels to feed their growth.
PA imaging is not without its limitations, however. It lacks the spatial resolution and sensitivity of MRI. And it is largely reliant on bulky, expensive pulsed lasers marked by low pulse-repetition frequency—traits that could limit both its availability in remote communities and its use in clinical settings, which require real-time image generation.
A recent variation of PA imaging, currently in the preclinical phase, mitigates some of those shortcomings. Known as photoacoustic radar (PAR) imaging, it allows one to achieve resolution, contrast, and depth penetration similar to that of conventional PA imaging, except using inexpensive, continuous-wave diode lasers. The newly developed method draws inspiration from an unlikely source: the same technology used to track storms, detect missiles, and locate planes in the sky.
Getting under the skin
Biological tissue is notoriously difficult to image. It is profusely scattering and largely impenetrable by visible light. To make matters worse, optical imaging requires that photons complete a round–trip through the turbid medium, first into the tissue and then out to the detector, at the cost of heavy attenuation and loss of resolution. Imaging in the IR is no easier given that water, the primary component of living tissue, absorbs strongly in that waveband.
PA imaging largely skirts those problems by generating images by way of an optical-to-ultrasonic energy-conversion process. A light-absorbing feature—say, blood hemoglobin or bone—absorbs photons, heats, and thermoelastically expands, thereby launching ultrasonic waves. Those waves can then be detected by transducers not unlike the ceramic devices used to collect ultrasonic images of a beating heart or a developing fetus. As a result, photons need only survive a one-way trip into the tissue sample; the return leg is performed by phonons, which are less susceptible to attenuation.
Because the ultrasonic signals are generated only in response to absorption events, resolution isn’t diminished by optical scattering. High signal-to-noise ratios can therefore be achieved by confining the PA excitation wavelengths to a so-called optical window, between 650 nm and 900 nm, in which light is strongly scattered but weakly absorbed. In that window, signal baselines remain low—at the instrumentation noise level—even as the laser field is intensified to strengthen the signal. The technique therefore exhibits good signal dynamic range; that is, it can detect signals over a large range of amplitudes spanning as much as 10 orders of magnitude.
By encoding optical contrast into ultrasound waves, PA imaging achieves contrast comparable to optical imaging, at far greater penetration depths, and spatial resolution comparable to ultrasound imaging. At the same time, the technique’s spectroscopic nature allows significantly higher specificity than conventional ultrasonic imaging.
Figure

Figure 1. Photoacoustic tomography can be used to noninvasively image tissue deep beneath the skin of rats and other mammals. (a) In typical setups, a laser pulse irradiates a submerged target; blood hemoglobin and other chromophores in the biological tissue absorb laser light, thermoelastically expand, and generate ultrasound echo pulses; and an ultrasound transducer detects the echoes with delay times and phases that depend on the precise locations of the chromophores and the positioning of the transducer. (b) A 1-megapixel photoacoustic tomography image of a rat’s cerebral cortex—taken with the skin and skull intact—shows the same vasculature and superficial lesion as (c) a photograph taken after the skull was removed. (Adapted from X. Wang et al., Nat. Biotechnol. 21, 803, 2003, doi:10.1038/nbt839 .)
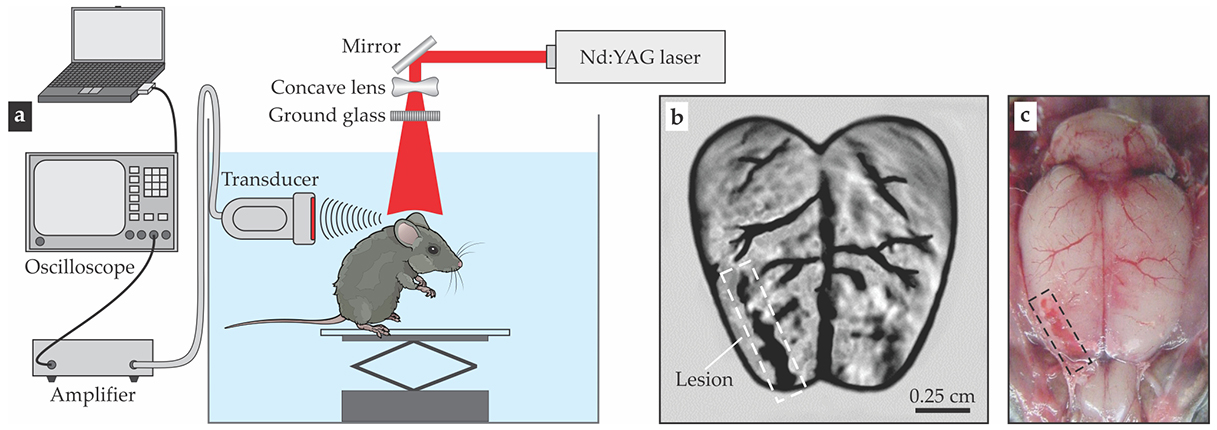
The PA image was obtained using a Q-switched, pulsed neodymium-doped yttrium aluminum garnet laser operating at 532 nm. (Although that wavelength lies outside the optical window, it nevertheless provides good penetrability through the skull.) Such lasers, with peak powers on the order of megawatts, are typical in PA imaging and are often combined with an optical parametric oscillator for wavelength tuning. They are preferred due to their high energy content and excellent signal-to-noise ratios, and their wavelength tunability allows for multispectral imaging. Pulse durations of Q-switched lasers are often less than 10 ns, short enough that one can safely ignore the effects of heat and stress diffusion on the thermoelastic energy-conversion process. The resulting reconstructed image can therefore be interpreted as a replica of the tissue’s optical absorption profile.
Although the durations of Q-switched laser pulses are short, the repetition rates are slow, typically 10–20 Hz. That cadence usually means only two or three scanned PA images can be generated per minute. That’s a major drawback in clinical settings, where in vivo imaging requires rates of roughly 20 images per second. 3 Recently, several groups have developed transducer-array-based cylindrical scanners that provide two-dimensional images at real-time frame rates. 4 Also, pulsed fiber lasers with kilohertz repetition rates, millijoule pulse energies, and pulse durations of 10–220 ns have become available commercially. 5 The fiber lasers can provide average powers of around 20 W and, because of their high beam quality, can produce PA images with lateral spatial resolution of less than 10 µm using pulse energies of just a few tens of microjoules—a safe exposure according to Laser Institute of America standards. 6
What’s old is new
A promising adaptation of PA imaging borrows from the principles and technology of radar. The word “radar” was originally an acronym, for radio detection and ranging, but the technology has become so widespread in the 80 years since it was introduced that much like “laser,” it is now a standard English noun. 7 Ultrasonic radars, used mainly underwater, have come to be known as sonars, for sound navigation and ranging.
The physical principles underlying radar are simple and are conveniently illustrated in the ultrasound case: A transmitter emits acoustic energy, some of which reflects off a target and returns as an echo to the source location, where it is picked up by a transducer array, hydrophone, or some other receiver. If the speed of propagation of the acoustic wave field is known, one can estimate the distance and the direction of the target based on the time
If the signal is a simple pulse, the technique closely parallels conventional PA imaging—except that in PA imaging, an optical signal returns as an acoustic echo. However, many radar and sonar technologies, such as early warning radar and radar altimeters used to guide landing aircraft, use continuous-wave sources with special modulation patterns involving multifrequency waveforms. Modulation strategies include signal phase manipulation, waveform-engineered pulses, and binary phase coding.
8
One can cross-correlate the detected ultrasound with the modulated signal to identify the true signal echo and the location of the target. That cross-correlation, or matched filtering, vastly increases the signal-to-noise ratio. (See the box on
Box. Matched filtering and pulse compression
Conventional photoacoustic imaging uses powerful lasers to locate light-absorbing structures in soft biological tissue by detecting the delay time
The cross-correlation function
The highest signal-to-noise ratio is achieved for time
A simple example of an encoded waveform is a linear frequency-swept modulation (LFM) pattern called a chirp, in which angular frequency gradually shifts from some starting value
The width of the chirp’s autocorrelation function
The

For 20th-century radar technologists, continuous-wave radar offered a strategic advantage: It made radar cheaper, less complicated to manufacture and operate, more compact, and portable. Applied to photoacoustic imaging, it has a similar upside. It allows one to achieve resolutions comparable to those of conventional PA imaging using signals that are more than three orders of magnitude weaker. 9 Submillimeter axial resolution—or range resolution, as it’s known in radar terminology—can be obtained with compact diode lasers having peak powers of 20 W or less compared with the megawatt outputs required of conventional PA imaging.
The cross-correlation processing greatly suppresses baseline noise and improves on PA imaging’s dynamic range. Noise due to tissue-scattered photons impinging on the transducer is largely absent from the PA radar response, because such an event would show up in cross-correlation with a delay time of
A major advantage of the frequency-domain character of the PAR signal is that the cross-correlation function
Another practical advantage of the frequency-domain character of PAR imaging is that image reconstruction can be done by algorithms similar to those of conventional clinical ultrasonic imagers. That adaptability simplifies the integration of PAR technology with commercial ultrasound systems. It also facilitates the coregistration, or superposition, of functional PAR images with ultrasound images. A PAR image showing, say, the presence of blood in a region or organ can be superimposed on an ultrasound image showing underlying structure to provide better spatial context and to more clearly delineate the boundaries of the blood-rich region.
However, the PAR technique isn’t immune to scattering. Above 5 MHz, ultrasound strongly attenuates in soft tissue, and therefore PAR imaging deeper than 1–2 cm can be performed only with modulation frequencies in the range of 1–5 MHz. Those frequencies produce relatively low resolution compared with high-frequency, near-surface PA applications and those that use multitransducer array detectors. Still, the image quality, spatial resolution, and contrast are comparable to those of similarly deep subsurface images produced with MRI and with pulsed-laser PA imagers such as the Twente Photoacoustic Mammoscope at the University of Twente in Enschede, the Netherlands. 10
Image reconstruction
The signal processing used to convert ultrasound transducer data into a PAR image is based on popular tomographic imaging methods.
11
It involves three steps. First, signal data are collected from the transducer array in a back-propagating, line-scanned signal collection procedure (B-mode) and stored in a computer memory. The array may be a single transducer scanned tomographically around the laser illuminated object or a collection of several transducers. Second, the complex-valued cross-correlation function
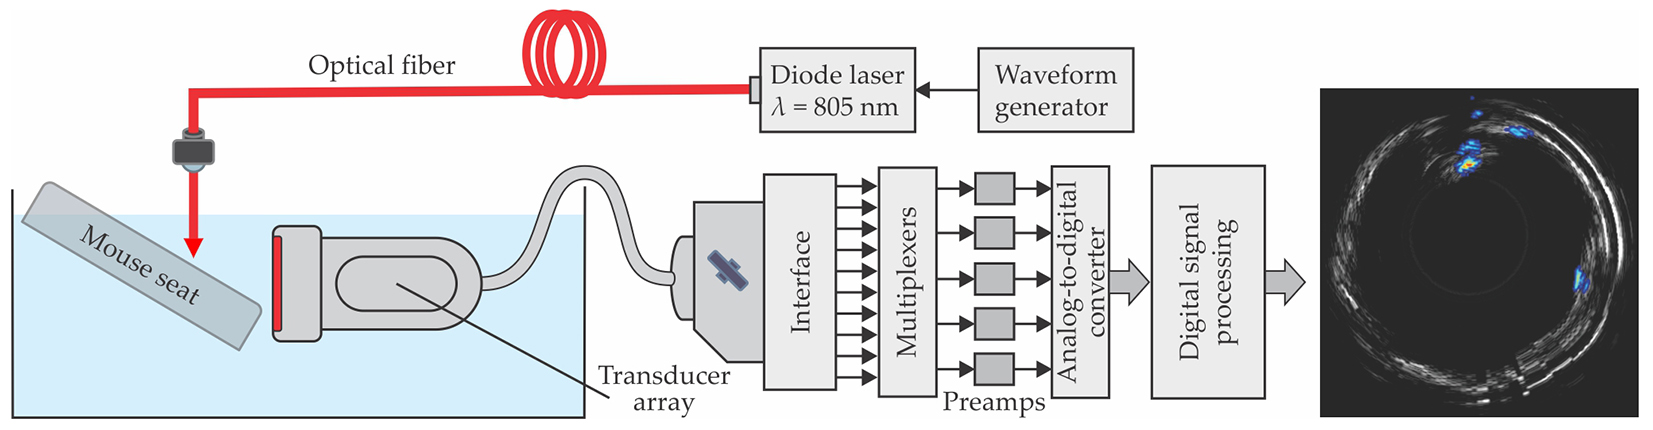
An experimental setup for PAR imaging of small animals is shown schematically in figure

Figure 2. Photoacoustic radar tomography generates high-quality images with inexpensive diode lasers by encoding the laser signals. Typically, a waveform generator converts the output of a continuous-wave diode laser into a frequency-modulated signal, which is then delivered to a submerged biological sample, say, of mouse tissue. The ultrasonic echo generated by light-absorbing elements within the tissue is detected by a transducer array and digitized. A cross-correlation process is then used to extract the signal from the noise and compute the delay time. From the amplitude, phase, and delay time, one can reconstruct the subsurface structure. The resulting images recall the familiar sights of weather maps, prenatal sonograms, and airport radar screens. (Adapted from ref.
Figure

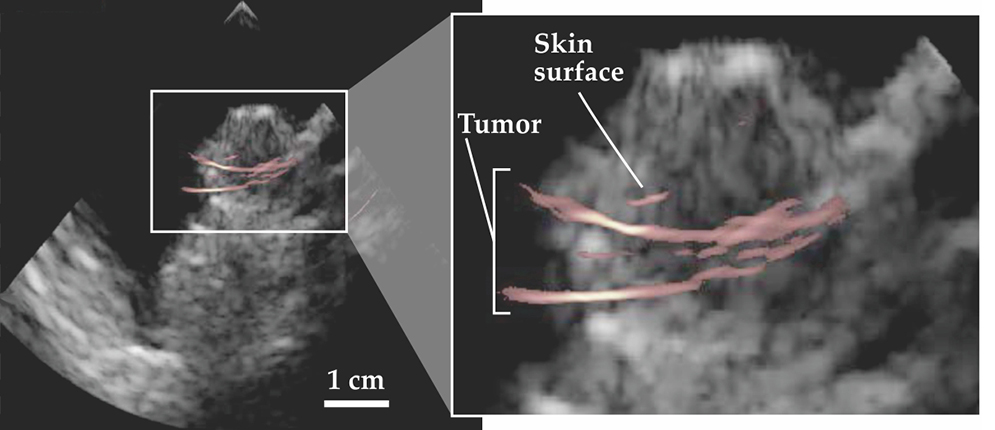
Figure 3. An ultrasonic image (black and white) of the left thigh of a mouse injected with cancer cells is superimposed with a phase-filtered photoacoustic radar image (pink) of the same specimen. The inset shows regions of high blood content indicative of a developing tumor. (Adapted from ref.
Multispectral imaging
If the spectral characteristics of the various chromophores in a tissue sample are known, one can use multispectral PA imaging to obtain spatially resolved quantitative functional information. The optical energy absorbed by a subsurface chromophore is assumed to be proportional to the product of its wavelength-dependent absorption coefficient and the energy content, or fluence, of the arriving laser pulse. That pulse, however, must pass through an overlying layer of scattering tissues and organs. Therefore, the accuracy of multispectral PA imaging is generally limited by uncertainties in the laser fluence delivered to the intended target. A recent adaptation of PAR imaging helps eliminate the effects of those uncertainties by constructing differential images created from signals of different wavelengths.
Consider, for example, the imaging of angiogenetic tumors in mice. The rapid development of a dense microvascular network in such tumors induces hypoxia, a fall in oxygenation levels. Because the oxygenated and deoxygenated forms of hemoglobin have different absorption spectra, one can determine their relative concentrations from the wavelength dependence of PAR response functions. The two forms’ molar extinction coefficients coincide at 808 nm, the so-called isosbestic point, but reach their maximum difference at 680 nm. So the PAR response shows maximum sensitivity to blood-oxygen concentration at 680 nm and virtually no sensitivity at 808 nm.
Figure

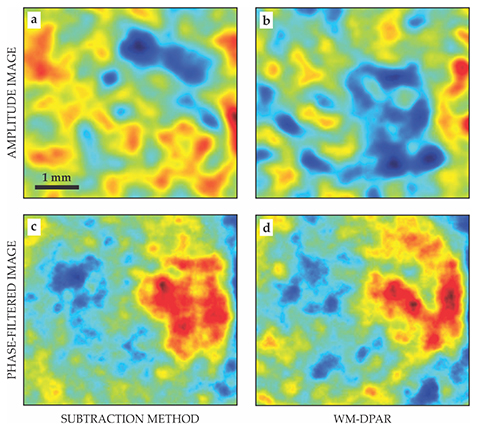
Figure 4. Multispectral imaging of blood-oxygen levels in a mouse’s thigh reveals hypoxia—depleted oxygen levels—indicative of a malignant subsurface tumor. In amplitude images obtained (a) by subtracting two images of different wavelengths and (b) by wavelength-modulated differential photoacoustic radar (WM-DPAR), noise due to inhomogeneous laser fluence masks the tumor’s location. (Blue and red regions indicate oxygen-rich and oxygen-poor tissue, respectively.) In the corresponding phase-filtered images, (c) and (d), the laser-fluence contribution is normalized out, and the hypoxic tumor is clearly visible in the right half of the image. (Adapted from ref.
The image in figure
Both figures
Recall that a major advantage of PAR imaging is the existence of a phase image channel. Because phase is the ratio of quadrature and in-phase signals—each of which is proportional to laser fluence—it is independent of laser fluence. The phase channel therefore yields better spatial subsurface localization and contrast reliability than does the amplitude channel.
15
Figures
Quantitative WM-DPAR imaging of tumor hypoxia can establish the malignant nature of a tumor early, even in premalignant phases, by detecting minute changes in total hemoglobin concentration and hemoglobin oxygenation. That unique capability will potentially aid the testing of cancer drugs on small animal models and—in next-phase applications—the diagnosis of cancer in humans.

Closing in on cancer
Fast image-acquisition frame rates, potential portability, dual phase- and amplitude-imaging capabilities, accurate depth selectivity, millimeter depth resolution, and compatibility with modern clinical ultrasonic imagers for coregistration make biomedical PAR imaging technology a convenient, inexpensive option for the diagnosis of premalignant tumors and early cancers. Derived from concepts at the interface between imaging instrumentation, signal-generation physics, and biophotonics, PAR imaging is a paradigm of integration. Just as radar has become a crucial element of military combat, PAR imaging may become an important new weapon in the battle against cancer.
The author is grateful for funding from the Natural Sciences and Engineering Research Council of Canada, the Canadian Institutes of Health Research, and the Canada Research Chairs Program.
References
1. A. A. Oraevsky et al., in Proceedings of Optical Tomography and Spectroscopy of Tissue III, vol. 3597, B. Chance, R. R. Alfano, B. J. Tromberg, eds., SPIE (1999), p. 352;
V. G. Andreev et al., Biomedical Optoacoustics, vol. 3916, A. A. Oraevsky, ed., SPIE (2000), p. 36.2. See, for example, A. A. Oraevsky, L. V. Wang, eds., Photons Plus Ultrasound: Imaging and Sensing 2009, vol. 7177, SPIE (2009).
3. K. Jansen et al., Opt. Lett. 36, 597 (2011). https://doi.org/10.1364/OL.36.000597
4. C. Li et al., J. Biomed. Opt. 15, 010509 (2010). https://doi.org/10.1117/1.3302807
5. W. Shi et al., J. Biomed. Opt. 15, 056017 (2010). https://doi.org/10.1117/1.3502661
6. Laser Institute of America, American National Standard for Safe Use of Lasers, ANSI Z136.1—2007 (2007).
7. M. A. Richards, Fundamentals of Radar Signal Processing, McGraw-Hill (2005), chap. 1;
M. I. Skolnik, ed., Radar Handbook, 2nd ed., McGraw-Hill (1990).8. B. Lashkari, A. Mandelis, Opt. Lett. 35, 1623 (2010);https://doi.org/10.1364/OL.35.001623
S. Telenkov, R. Alwi, A. Mandelis, Rev. Sci. Instrum. 84, 104907 (2013). https://doi.org/10.1063/1.48250349. B. Lashkari, A. Mandelis, Rev. Sci. Instrum. 82, 094903 (2011). https://doi.org/10.1063/1.3632117
10. M. Heijblom et al., Sci. Rep. 5, 11778 (2015). https://doi.org/10.1038/srep11778
11. S. Telenkov et al., Opt. Lett. 36, 4560 (2011). https://doi.org/10.1364/OL.36.004560
12. E. Dovlo et al., J. Biophotonics (in press), doi:10.1002/jbio.201600168 .
13. Z. Yuan, H. Jiang, Opt. Lett. 34, 1714 (2009). https://doi.org/10.1364/OL.34.001714
14. S. S. Choi et al., J. Biophotonics 9, 388 (2016). https://doi.org/10.1002/jbio.201500131
15. E. Dovlo et al., Biomed. Opt. Express 6, 1003 (2015). https://doi.org/10.1364/BOE.6.001003
16. S. Telenkov et al., J. Appl. Phys. 105, 102029 (2009). https://doi.org/10.1063/1.3116136
17. S. Telenkov, A. Mandelis, J. Biomed. Opt. 11, 044006 (2006). https://doi.org/10.1117/1.2337290
18. J. Xia, J. Yao, L. H. V. Wang, Prog. Electromagn. Res. 147, 1 (2014). https://doi.org/10.2528/PIER14032303
More about the authors
Andreas Mandelis is a professor in the department of mechanical and industrial engineering, the department of electrical and computer engineering, and the institute of biomaterials and biomedical engineering at the University of Toronto. He is also director of the university’s Center for Advanced Diffusion-Wave and Photoacoustic Technologies and a Canada Research Chair, Tier 1.


