How and why to measure a quantum state

Ultraprecise sensing, secure communication, and quantum computing are key aspects of the fast-growing field of quantum information science (QIS). The careful measurement of quantum states plays a key role in QIS. Whether researchers are exploring the foundations of quantum physics or verifying and calibrating quantum-enabled technologies, it’s important that they understand what a quantum state represents and how to measure it.
While there are ongoing debates about the deepest meaning of quantum states, the operational rules for preparing, using, and measuring them are clear. The no-cloning theorem, for example, demonstrates that, unlike a classical state, an arbitrary quantum state cannot be copied perfectly (as explained by Bill Wootters and Wojciech Zurek in their February 2009 PT article ). Such a statement is profound: It implies that the quantum state of a single quantum object, such as an electron, photon, or mode of the electromagnetic field, cannot be determined by any measurement scheme if no information is known about the object’s state beforehand. Yet scientists have shown that for a large collection of identical and identically prepared systems, a state can be assigned through a sufficient set of measurements. That process is quantum state tomography.
What, then, can be learned about the state from making a single measurement on a single quantum object? Very little, actually—only that the probability of obtaining the observed outcome was not zero. How researchers think about probability is thus foundational to how they think about a quantum state. Probability can be interpreted either as a frequency of outcome possibilities from multiple repeated and identical trials or as a subjective assertion about the likelihoods of possible outcomes.
The former view is useful when estimating a probability distribution from a set of repeated measurement trials. The latter is preferred by most QIS practitioners, with the estimates of probability based on all available information, which includes an understanding of the present state of physics theory and all available prior experimental knowledge. In that view, the quantum state becomes a kind of weighted catalog of possible outcomes. It is profoundly different from a classical catalog in that the observed outcomes are not preordained but emerge spontaneously during the measurement process. And, of course, the Schrödinger equation is the means for predicting the time evolution—forward or backward—of the quantum catalog of possible outcomes between measurements.
Reconstructed states
The possibility of measuring a quantum state—that is, determining the full quantum catalog of possible outcomes—was discussed by several of the founders of modern quantum theory. In the Copenhagen interpretation of quantum theory, a single precise measurement of a particular quantity, such as position or momentum, changes the state by causing collapse. That is one way to appreciate why researchers need to make many different measurements on a large collection of identically prepared systems to determine a full quantum state. The question of how to achieve that had been considered for half a century when, in 1987, Jacqueline Bertrand and Pierre Bertrand proposed a scheme for reconstructing the state of a set of freely propagating particles by measuring position distributions at various free-propagation times.
Karl Vogel and Hannes Risken soon thereafter showed that the same scheme for reconstructing a state from an ensemble of measurements also applies to the state of a single mode of the electromagnetic field, which has the same dynamics as a harmonic oscillator. In both cases, the reconstruction method uses the same process—the inverse Radon transform—that is used in computed tomography in medicine to reconstruct a 3D image from a suitable set of transmission images (often called shadows).
The first experimental demonstration of that method for quantum state tomography was carried out in my optics laboratory in 1993. In that experiment, led by Daniel Smithey and Mark Beck, we generated a squeezed vacuum state in a large number of light pulses. A squeezed vacuum state, like an ordinary one, has a vanishing average electric field. Unlike an ordinary vacuum state, though, the squeezed one has unequal quantum fluctuations in the amplitude X of the electric field component that oscillates in-phase with a given reference field and in the amplitude P of the component that’s 90° out of phase with the reference field. The amplitudes X and P are mathematically analogous to the position x and momentum p of a harmonically oscillating particle.
The pulses were measured using optical homodyne detection, in which the weak squeezed light is interfered coherently with a strong reference laser pulse, similar to how a lock-in amplifier works. The output signal gives the amplitude of the squeezed light field at a selected phase relative to the reference laser field.
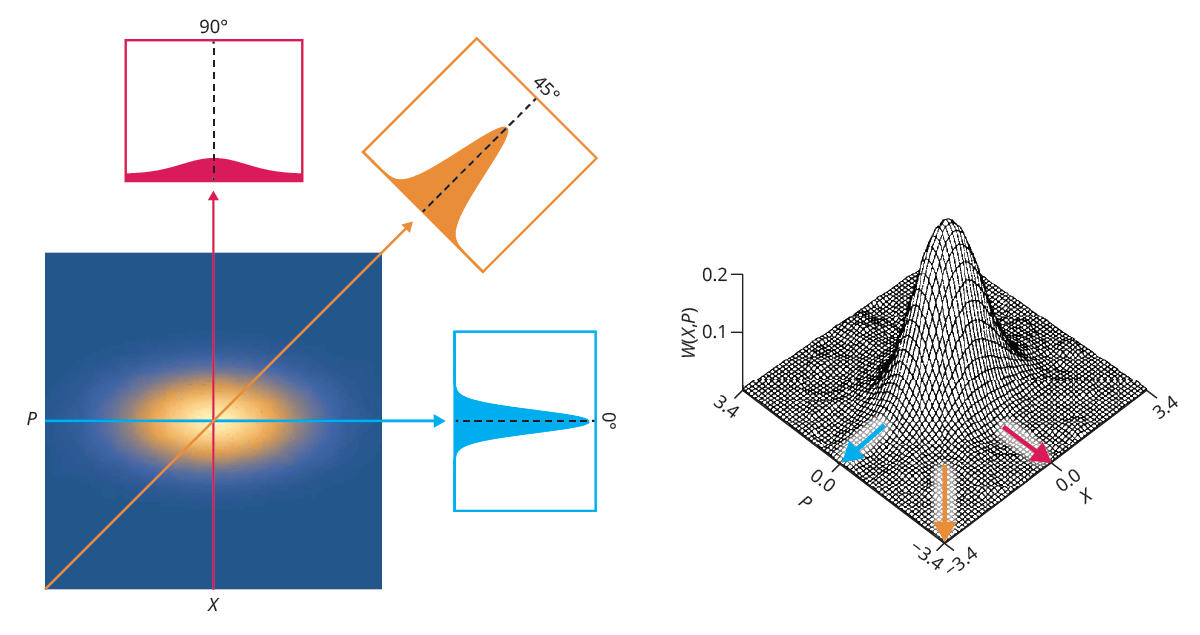
By collecting X and P amplitude values over repeated trials and for various relative phases, we built up a set of estimated probability distributions, a process that we named optical homodyne tomography. From that set of distributions, we reconstructed the state of the light, as shown in the figure. The results confirmed that one amplitude component—for the example shown, the out-of-phase component—of the squeezed light held smaller quantum fluctuations than the other, complementary component. (That kind of squeezing of quantum noise is now used to increase the sensitivity of the Laser Interferometer Gravitational-Wave Observatory.) While the reconstructed quantum phase-space distribution W is not a true probability distribution—for example, it can take on negative values—it uniquely represents the quantum state, as initially pointed out by Eugene Wigner.

Tomographic reconstruction from projections (left) at different phases with respect to a reference field is used to characterize the quantum phase-space distribution W (right) for a squeezed state of a single-mode light field. X and P are the amplitudes of the in-phase and out-of-phase components of the light field with respect to the reference field. The contour plot has a maximum at X = P = 0, meaning that the highest probability occurs for zero optical field amplitude.
(Right figure adapted from D. T. Smithey et al., “Measurement of the Wigner distribution and the density matrix of a light mode using optical homodyne tomography: Application to squeezed states and the vacuum ,” Phys. Rev. Lett. 70, 1244, 1993.)

Modern work in QIS often uses the polarization of single photons—described in terms of two possible complementary states, such as left and right circular polarization—to serve as a two-state qubit, the workhorse of quantum computing and communication. Quantum state tomography for optical polarization of photons was first demonstrated for entangled photon pairs in the optics laboratory of Paul Kwiat.
Kwiat and colleagues’ measurement involved passing each member of the pair through polarization-selective devices and recording each photon with one or the other selected polarizations. Data were collected for a large ensemble of photons, and instead of using the inverse Radon transform, the team processed the data using a maximum-likelihood algorithm designed to yield a mathematically rigorous best guess for the polarization state of the ensemble. Maximum-likelihood algorithms search numerically for the distribution that is most likely to generate the observed statistics. They often proceed from an initial estimate that is refined iteratively to find the best fit.
Applications and more
Modern applications of quantum state tomography, which typically use the maximum-likelihood method, are by now ubiquitous in quantum information science and technology. The technique spans a wide range of quantum states and applications for quantum computation and quantum information storage, such as microwave photons in superconducting circuits, magnons in spin ensembles, and mechanical vibrational modes in solids.
Beyond practical applications, the ability to estimate, reconstruct, determine, or assign a quantum state for an ensemble of identically prepared systems plays a significant role in discussions about the foundations of quantum mechanics. While there is still some tension between objective and subjective interpretations of quantum mechanics, the idea that a quantum state is equivalent to the set of specified probabilities for all possible measurement outcomes on a quantum system provides insight into the very workings and meaning of the theory.
For example, Borivoje Dakić and Časlav Brukner have proposed that the foundational principles of quantum mechanics can be inferred from just a few simple axioms, one of which is that “the state of a composite system is completely determined by local measurements on its subsystems and their correlations.” That axiom is describing quantum state tomography.
That the measurements are local is key: When entangled but spatially separated systems are each measured locally, the measurements’ outcome correlations can be stronger than allowed by any local theory that obeys ordinary classical probability predictions. (Experimental demonstrations of such nonclassical correlations earned Alain Aspect, John Clauser, and Anton Zeilinger the 2022 Nobel Prize in Physics; see PT ’s December 2022 report on their prizewinning work.) That a quantum state can be used to predict those nonclassical correlations and that an ensemble of such measurements can reveal the entangled state seemingly point to a deep aspect of nature.
Additional resources
► J. Bertrand, P. Bertrand, “A tomographic approach to Wigner’s function ,” Found. Phys. 17, 397 (1987).
► K. Vogel, H. Risken, “Determination of quasiprobability distributions in terms of probability distributions for the rotated quadrature phase ,” Phys. Rev. A 40, 2847(R) (1989).
► D. T. Smithey et al., “Measurement of the Wigner distribution and the density matrix of a light mode using optical homodyne tomography: Application to squeezed states and the vacuum ,” Phys. Rev. Lett. 70, 1244 (1993).
► D. F. V. James et al., “Measurement of qubits ,” Phys. Rev. A 64, 052312 (2001).
► B. Dakić, Č. Brukner, “Quantum Theory and Beyond: Is Entanglement Special?,” in Deep Beauty: Understanding the Quantum World Through Mathematical Innovation, H. Halvorson, ed., Cambridge U. Press (2011), p. 365.
More about the authors
Michael Raymer is a professor of physics emeritus at the University of Oregon in Eugene and was founding director of the university’s Oregon Center for Optical, Molecular, and Quantum Science.