Boiling eggs, radiation damage, and the Arrhenius plot
DOI: 10.1063/PT.3.4757

Svante August Arrhenius (1859–1927) was one of the most accomplished scientists of his time. A founder of physical chemistry, he contributed to such diverse fields as meteorology, geophysics, physiology, and cosmology. In 1896, he was the first to predict global warming as a consequence of human carbon dioxide emissions. His early dissertation work on the theory of ionic dissociation, however, was met with skepticism. Many scientists of his time just could not imagine that the intimate bond between, say, sodium and chlorine in table salt could simply fall apart in water, and that all those chlorine atoms would not reveal themselves through their characteristic smell.
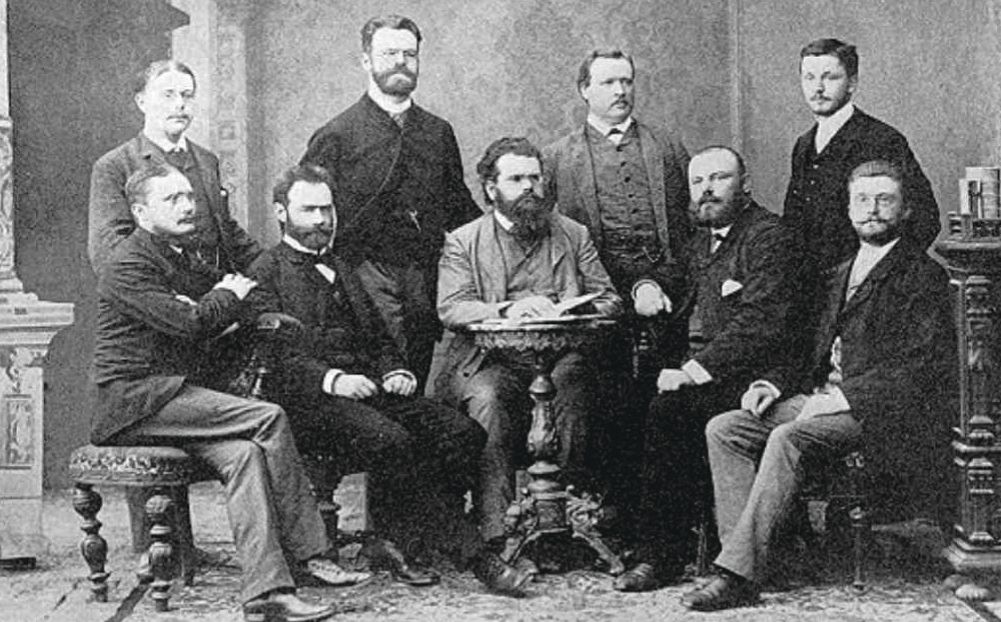
A travel grant from the Swedish Academy of Sciences gave Arrhenius the opportunity to discuss his ideas with such great minds as Walther Nernst and Ludwig Boltzmann, shown in figure
Figure 1.

Svante Arrhenius and Ludwig Boltzmann’s group in Graz, Austria, 1887. Boltzmann sits in the center, Arrhenius stands behind him on the right, and Walther Nernst stands at the far left. (University of Graz, Wikimedia Commons, CC-PD Mark 1.0 .)
Today, Arrhenius is best known as the name of a data-evaluation method that is almost universally used in chemistry, physics, and materials science. The Arrhenius plot reflects the thermal Boltzmann equation, which gives the probability for a state to be occupied as
The shape of a reaction
For a wide range of thermally induced processes, plotting the logarithm of the data against the inverse temperature gives a linear dependence. The slope of the regression line in the plot then gives the characteristic excitation energy needed for the process. Today the Arrhenius equation is considered an empirical relationship, and more rigorous treatments have replaced it for many specific problems. But what it may lack in rigor, it makes up in practicality and generality.
In chemistry, for example, the Arrhenius plot is commonly used to determine the activation energy of a reaction from the temperature dependence of its reaction rate. Figure
Figure 2.

Arrhenius plot of the electron density
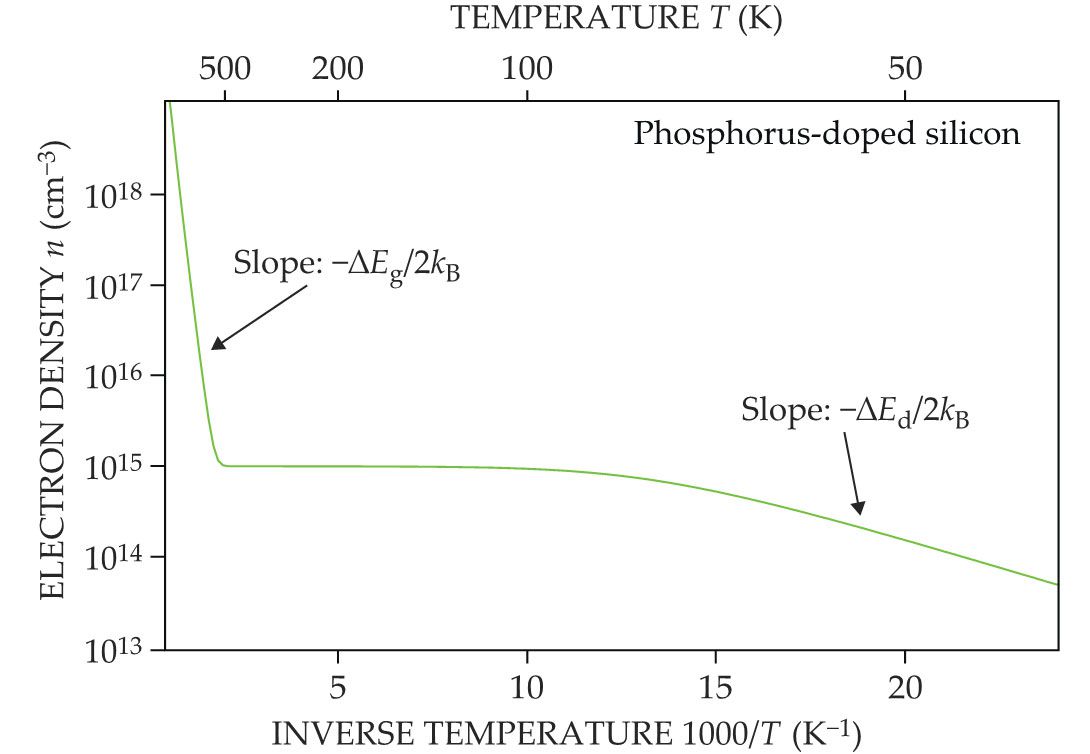
Contrary to common belief, an Arrhenius plot does not require
An egg’s gelation rate
Those advantageous properties of the Arrhenius plot recently came to mind in a discussion with a colleague about the harmfulness of human exposure to UV radiation. Where, approximately, would one set the boundary between safe and harmful? On a molecular level, the threshold would be the energy sufficient to deteriorate vital biological matter, such as proteins. And surely, medical scientists have performed careful in vivo and in vitro studies to identify that threshold.
For a quick estimate, though, would the Arrhenius approach be helpful? Inspiration came from an outreach activity of our department’s Collaborative Research Center. For the Easter holiday, we in the department featured the physics of boiling eggs and came across some surprisingly rigorous studies.
Data from one study are shown in figure
Figure 3.

Gelation rate (log scale) of egg yolk as a function of inverse temperature. For each data point, the yolk was heated to a particular temperature until it gelled. By definition, that happens when the elastic and viscous moduli become equal. (Data from C. Vega and R. Mercadé-Prieto, Food Biophysics 6, 152, 2011, doi:10.1007/s11483-010-9200-1 .)
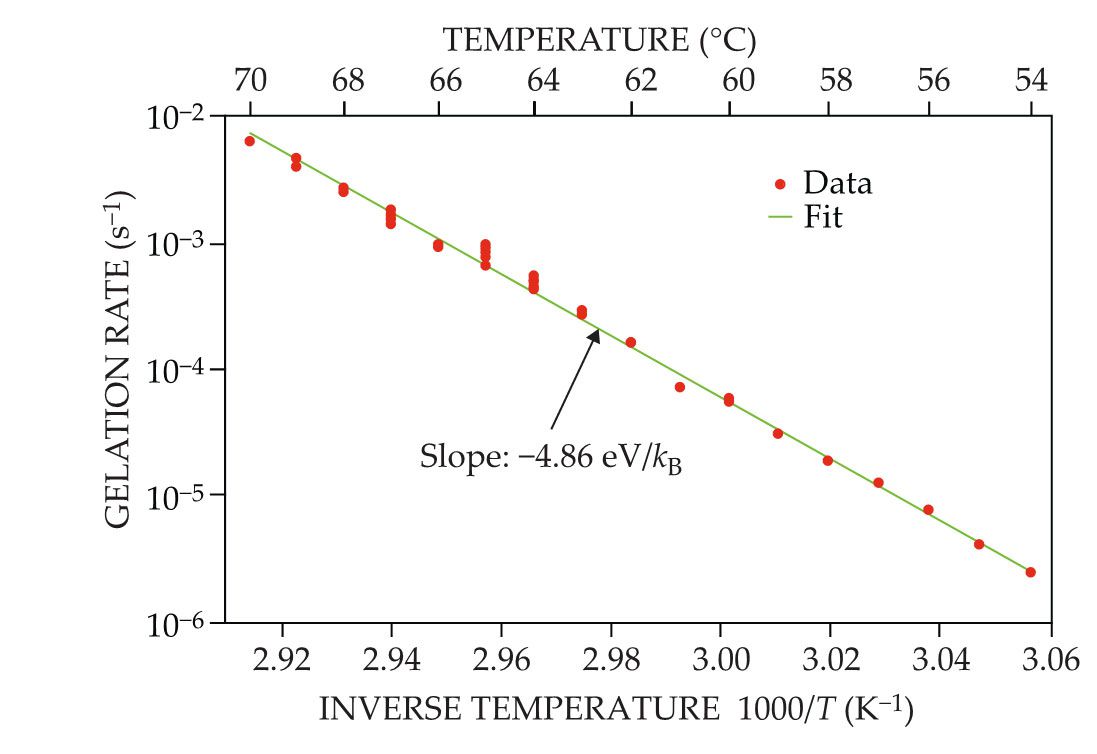
The original data give the gelation time versus temperature. But recasting the data as a function of inverse temperature provides the rate in a best-fit Arrhenius plot—the solid line shown in the figure. That plot’s slope yields 4.86 eV, which estimates the typical energy needed to degrade the biological matter present in a chicken egg.
The degradation of proteins that leads to gelation can be triggered by more than just thermal energy. Electromagnetic radiation can induce coagulation as well, and the results of the Arrhenius plot can serve as a guide to estimate the necessary photon energy. A similar situation is found in semiconductors: The characteristic energies
A 4.86 eV photon corresponds to a wavelength of 255 nm, which places the threshold for radiation damage in the UV-C region of the electromagnetic spectrum. That placement agrees with the absorption maxima of vital biological compounds, such as proteins (280 nm) and nucleic acids (260 nm). Indeed, UV-C radiation is lethal for microorganisms and is used in germicidal lamps for medical applications and for sterilizing seeds, nuts, herbs, spices, and teas. Were you to zap an egg yolk with a 255 nm laser pulse, it may not cook instantly, but it would coagulate. And with a strong laser that might happen quite quickly.
Light from the UV-A and UV-B regions (315–400 nm and 280–315 nm, respectively) is not entirely harmless. But it is much less damaging than shorter-wavelength radiation, and some exposure to UV-B is, in fact, beneficial for the production of vitamin D in biological tissue. Fortunately, UV-C radiation is efficiently blocked by Earth’s atmosphere, so that living organisms are well shielded from its detrimental effects. Apparently, life on Earth has adjusted to these environmental conditions by clever design of its vital compounds—a sample of which can be found in your breakfast egg.
References
► B. Van Zeghbroeck, Principles of Semiconductor Devices, https://ecee.colorado.edu/~bart/book .
► H. Neurath et al., “The chemistry of protein denaturation,” Chem. Rev. 34, 157 (1944). https://doi.org/10.1021/cr60108a003
► C. Vega, R. Mercadé-Prieto, “Culinary biophysics: On the nature of the 6X°C egg,” Food Biophysics 6, 152 (2011). https://doi.org/10.1007/s11483-010-9200-1
► R. Munroe, “Can you boil an egg too long?” New York Times, 9 June, 2020, https://www.nytimes.com/2020/06/09/science/randall-munroe-question-eggs.html .
► For scientific aspects of boiling an egg, see http://newton.ex.ac.uk/teaching/CDHW/egg ;
for a culinary approach to cooking the perfect egg yolk, see https://blog.khymos.org/2011/04/18/perfect-egg-yolks .
More about the authors
Axel Lorke is a professor of physics at the University of Duisburg-Essen in Germany.


