WMAP Spacecraft Maps the Entire Cosmic Microwave Sky With Unprecedented Precision
DOI: 10.1063/1.1580037
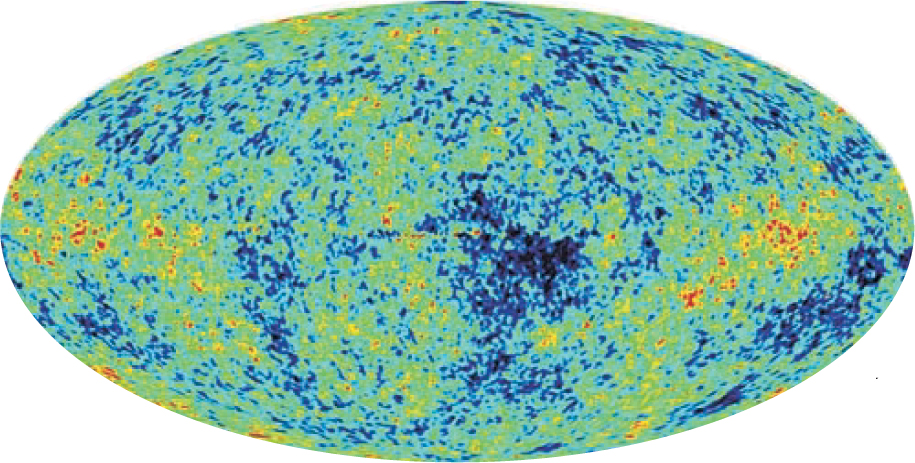
In June 2001, a Delta rocket started NASA’s 840-kg Microwave Anisotropy Probe (MAP) on a journey that, a few weeks later, brought it to the vicinity of the L2 Lagrange point, 1.5 million km antisunward of Earth. From that remote and unobstructed perch, the instrument has been continuously mapping, with unprecedented precision, the very faint departures from the almost perfect isotropy of the cosmic microwave background (see figure 1) and the still fainter polarization engendered by these anisotropies.

Figure 1. All-sky map (in Galactic coordinates) of microkelvin departures from the isotropy of the 2.725-K cosmic microwave background, made by the Wilkinson Microwave Anisotropy Probe. WMAP’s angular resolution is about 12 arcminutes. Spots shown red and blue are, respectively, hottest and coldest. Foreground radiation from the Milky Way, which WMAP distinguishes by observing at five microwave frequencies, has been subtracted from the equatorial band.
(Courtesy WMAP collaboration.)
The much-anticipated report of MAP’s first full year of observation, detailed in 13 papers released on 11 February, 1 was accompanied by a ceremonial announcement. In memory of Princeton University astrophysicist David Wilkinson, a founding member of the MAP collaboration who died last September, the spacecraft had been rechristened the Wilkinson Microwave Anisotropy Probe (WMAP). Wilkinson had been a pioneer of cosmic microwave background (CMB) measurement since 1964.
WMAP was built by a partnership between Princeton and NASA’s Goddard Space Fight Center, in Green-belt, Maryland. Its principal investigator is Charles Bennett (Goddard).
Precision cosmology
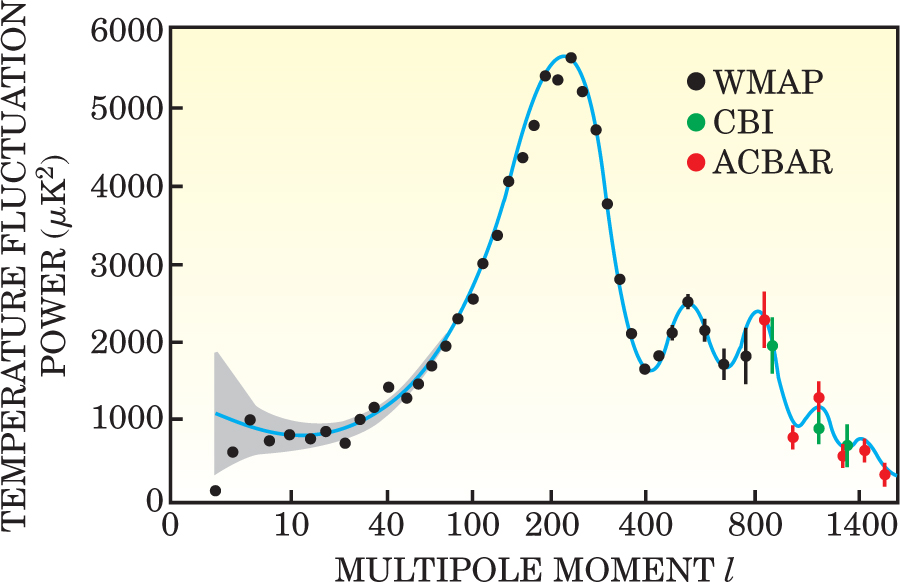
Some astrophysicists are hailing the first WMAP results as the beginning of precision cosmology. The instrument’s design is optimized to better the calibration uncertainties of previous CMB probes by an order of magnitude. With its sensitivity and uninterrupted full-sky coverage at five different microwave frequencies, WMAP has already measured the first “acoustic” peak of the CMB temperature-anisotropy power spectrum with error bars smaller than the “cosmic variance” that randomizes the power spectrum seen by an observer in any one corner of the universe (see figure 2). “To do any better,” explains University of Chicago theorist Michael Turner, “you’d have to remeasure the sky from a second vantage point billions of light-years from here.”

Figure 2. Angular power spectrum of temperature fluctuations in the cosmic microwave background, measured by the Wilkinson Microwave Anisotropy Probe. The data points shown in color at the large multiple moments beyond WMAP’s present reach are from two ground-based microwave telescopes optimized for fine angular resolution. The curve shows the best theoretical fit, with just seven adjustable cosmological parameters, to all these data plus a variety of other large-scale observations. The shading represents irreducable cosmic variance.
(Adapted from ref. 1.)
The upshot of this new precision is a strong confirmation of the standard inflationary Big Bang scenario, but now with astonishing specificity. We are informed, for example, that the Big Bang occurred 13.7 ± 0.2 billion years ago, and that the CMB is a snapshot of the cosmos 379 ± 8 thousand years later. In addition to this reassuring support for what most cosmologists already believed, the WMAP data have also presented them with a few intriguing surprises and puzzles. As soon as the WMAP results appeared on the Web, they began spawning theory papers by the dozens.
Why are the peaks in figure 2 called acoustic, and how can they tell us so much? The CMB is the relic radiation from the “moment” of first transparency, 4 × 10⁵ years after the Big Bang, when the opaque plasma pervading the cosmos finally became cool enough (about 3000 K) to let neutral hydrogen survive. The thousandfold cosmic expansion since then has red-shifted this ubiquitous, largely undisturbed radiation to a blackbody temperature of 2.725 K, with random anisotropies of only a few parts in 105 from point to point on the sky.
The microkelvin hot and cold spots in figure 1 indicate local regions at the end of the plasma epoch that had mass densities very slightly lower or higher than the mean. The expansion and contraction of such density fluctuations are acoustic wave phenomena in the viscous, elastic plasma fluid, in which radiation pressure competes against gravitational contraction. The sound speed that limits how fast a hot or cold spot could have expanded in the plasma epoch was about
Fundamental questions
The plasma physics of that epoch is thought to be well understood. But the details of the plasma’s last gasp, as we see it now from a distance of 13 billion years, also depend crucially on a handful of fundamental cosmological parameters one wants to know as precisely as possible (see the Reference Frame by Turner on page 10 of this issue). What is the large-scale geometry of the cosmos? How close is the mean mass density to the critical value that would make the cosmos flat (Euclidean), and what fraction of that mass is the ordinary baryonic matter that interacts with photons? If, as it seems, the mass density falls far short of the critical value, why does the cosmos nonetheless appear to be flat, as required by the inflationary Big Bang scenario? Was there really an inflationary prelude to the plasma epoch, and what are the scale dependence and thermodynamic character of the primordial quantum fluctuations that were presumably stretched into the CMB hot and cold spots by sudden inflation and the subsequent slower expansion?
To compare the CMB observations with theory and extract the best-fit cosmological parameters, it is useful to obtain the angular power spectrum of temperature fluctuations by decomposing the celestial map of departures ΔT from the mean CMB temperature into a sum of spherical harmonics Y l,m (θ,φ). The fluctuation power at multipole moment l is then given by the mean-square value of the expansion coefficients al,m , averaged over the 2l + 1 values of the azimuthal index m. Because there is no preferred direction on the CMB sky, the distribution of power in m varies randomly with the observer’s position in the cosmos. Thus the cosmic variance, as indicated by the shading around the best-fit curve in figure 2, is widest at small l, where one is averaging over the fewest random m terms. This becomes an issue when one worries about the provocatively low quadrupole (l = 2) power in figure 2. Whether the low quadrupole power is cosmologically significant remains an open question.
The temperature-fluctuation power for a given l measures the mean-square temperature difference between points on the sky separated by an angle of order π/l. The harmonic sequence of distinct acoustic peaks is attributed to the abrupt beginning and end of the plasma epoch. The end catches different oscillation modes in different phases of expansion or contraction. The power-spectrum peaks correspond to those modes that happened to be maximally over- or under-dense at the moment when the CMB photons were set free.
The positions and heights of the peaks serve to constrain the cosmological parameters. The baryon density, for example, determines the interaction of matter with radiation in the plasma. And the total density of all forms of matter and energy determines the cosmic geometry that might be distorting the angular sizes of the CMB hot and cold spots as we see them.
The instrument
The l range of a CMB telescope is limited by its angular resolution. WMAP, with an angular resolution of about 12 arcminutes, cannot as yet follow the power spectrum much beyond l = 800. So, to include the third acoustic peak and hints of higher-order structure in fitting for the cosmological parameters, the WMAP group’s analysis includes data points at higher l from CBI and ACBAR, two new ground-based microwave telescopes with finer angular resolution than WMAP (see Physics Today, August 2002, page 18 .)
But angular resolution is only part of the story. Spectral resolution in l depends on how large a contiguous patch of sky has been mapped. And WMAP, as it spins and precesses while corevolving around the Sun with distant, unobtrusive Earth, has covered the entire sky twice in its first year, remeasuring most patches of sky several thousand times. One wants to know the absolute heights of the spectral peaks as precisely as possible. “Our calibration uncertainty is only about half a percent,” says Bennett. “To achieve that, our design, in many places, sacrifices sensitivity for systematic-error reduction.”
The instrument measures the microkelvin temperature difference between points 140° apart on the sky. WMAP’s two back-to-back reflectors, with 10 microwave horns in the focal plane of each, feed differential radiometers. Very sensitive amplifiers, built by the National Radio Astronomy Observatory, let these radiometers measure the minuscule difference in radiative power from the two celestial patches in five microwave frequency bands and two orthogonal polarization directions. The five frequency bands, ranging from 23 to 94 GHz, make it possible to distinguish between the blackbody 2.725-K radiation and noncosmological foreground radiation, particularly from the disk of the Milky Way.
The annual motion of L2 around the Sun provides its passenger with a sensitive calibration tool. The CMB has a well-known, and cosmologically uninteresting, dipole anisotropy due to the non-Hubble motion of the Solar System and the whole Milky Way relative to the reference frame defined by the large galaxy clusters. That dipole moment is always excised before one calculates the anisotropy power spectrum. But as WMAP observes the CMB sky continually throughout the year, one can calibrate the instrument by measuring the small seasonal Doppler modulation of the dipole moment as the direction of Earth’s motion changes.
Polarization
Measuring the incident microwave intensity in two orthogonal polarization directions allows WMAP to map the intensity and direction of linear polarization everywhere on the CMB sky. The first and only previous detection of CMB polarization was reported last Fall by John Carlstrom (University of Chicago) and collaborators. They used the DASI microwave interferometer at the South Pole to make detailed polarization maps of two small CMB fields. 2
Martin Rees had pointed out in 1968 that small spatial fluctuations in the CMB should induce polarization, as electrons streaming in response to these fluctuations are bombarded anisotropically by photons. Such polarization would, however, be totally washed out by continual rescattering—except at special moments like the end of the plasma epoch, when most CMB photons experienced their last scattering. The first DASI measurement found the degree of CMB linear polarization to be of order 10−6, in rough agreement with theoretical predictions. That is, the level of polarization is about 10% of the very small temperature anisotropies that cause it.
The WMAP group has measured a polarization-temperature “cross-power” spectrum (figure 3) analogous to the angular power spectrum of temperature fluctuations in figure 2. This cross-power spectrum is, in effect, the Legendre-polynomial decomposition of the two-point temperature-polarization correlation function C(cos θ). This function quantifies the correlation, between points on the sky separated by an angle θ, of ΔT at one point and the strength and direction of polarization at the other. The cross-power at multipole l compares points separated by θ ≈ π/l.

Figure 3. Cross-power spectrum of correlation between CMB temperature fluctuation and polarization in the cosmic microwave background, measured by WMAP. The curve is not a fit to the polarization data; it is a prediction based solely on the observed CMB temperature anisotropy. The one blatant outlier, at the lowest multipole moment, is attributed to the beginnings of cosmic reionization by the first stars, 200 million years after the CMB temperature anisotropies were carved in stone.
(Adapted from ref. 1.)
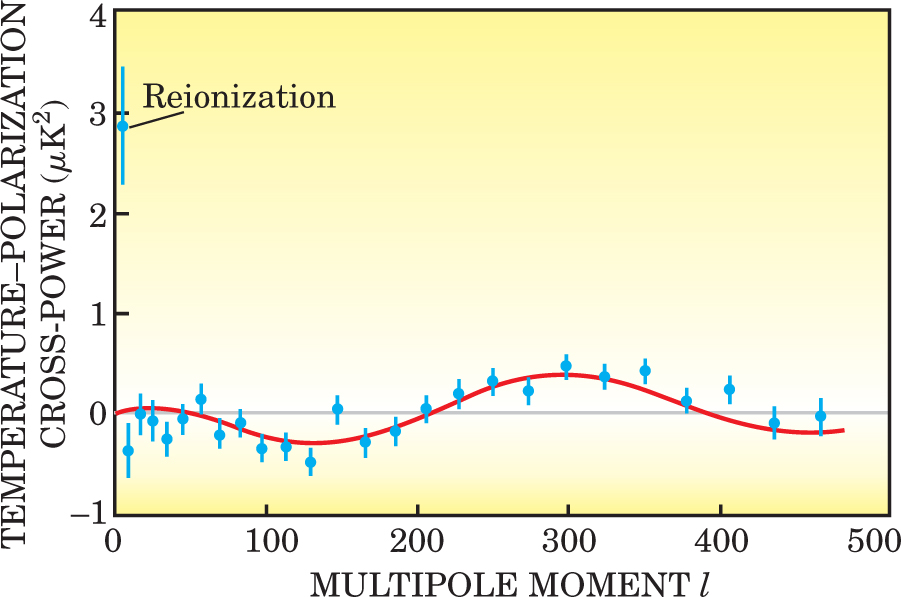
Rather than being a fit to the polarization data, the curve in figure 3 is a prediction based solely on the power spectrum of temperature anitropy without additional free parameters. The phase shift between the peak near l = 300 and the first acoustic peak of figure 2 is characteristic of the inflationary requirement that the primordial fluctuations at the start of the plasma epoch were adiabatic—that is, that the ratio of matter (both dark and baryonic) to radiation was the same everywhere. The negative peak near l = 150 is distinctive evidence for correlations “beyond the sound-speed horizon”—that is, between points on the sky too far apart at last scattering to ever have been in causal communication, had it not been for an initial inflationary expansion.
A surprise
The lowest-l data point in figure 3 presents one of the few surprises to come out of the first year of WMAP observations. It alone departs strikingly from the predicted polarization correlation for the end of the plasma epoch. And that, concludes the WMAP group, is because it’s a manifestation of something that happened about 200 million years later—namely, the beginning of cosmic reionization.
When the first stars appeared, their ultraviolet output began the reionization of the neutral hydrogen that formed at the end of the plasma epoch. Today, most intergalactic hydrogen is ionized. It had generally been assumed that the first stars did not appear before about half a billion years after the Big Bang. But the spike observed by WMAP at the low-l end of the polarization-correlation spectrum moves that date well back. What the spike measures directly is the integrated fraction of CMB photons (about 15%) that have been scattered since reionization began. This translates into the estimate of 200 million years after the Big Bang for first starlight. Given that surprisingly early date, we know from intergalactic absorption features of quasar spectra that it took another billion years for starlight to complete the reionization of the cosmos (see Physics Today, October 2001, page 17 ).
Star formation so early is evidence against a significant “warm” component of dark matter, and it raises questions about the early abundance of molecular hydrogen and the masses of the first stars. “The structure-formation theorists love having our new parameters,” says Bennett. “Now it’s up to them to adjust their models accordingly.”
The polarization data do not, as yet, show evidence of the very faint primordial gravitational waves that might eventually distinguish between the inflationary Big Bang and proposed cyclical-universe alternatives. 3
Cosmological consensus
Far from yielding surprises, most of the WMAP results confirm, with greater precision, the results of earlier CMB observations and, more important, the cosmological parameters deduced from a great range of quite different and independent large-scale observations: galaxy and supernova redshift surveys (see the article by Saul Perlmutter on page 53), the Lyman-α forest, primorial deuterium abundance, and gravitational lensing surveys.
Combining all these cosmological measurements, the WMAP group finds that, in units of the critical closure density, the cosmic mass density Ωm is only 0.27 ± 0.04, and more than 80% of that is nonbaryonic cold (nonrelativistic) dark matter whose identity is unknown. The flat cosmic geometry demanded by inflation is saved by a bigger and even more mysterious vacuum energy density ΩΛ = 0.73 ± 0.04 that brings their sum up to the requisite Ω = 1. The uncertainty on the total Ω is only 2%.
The WMAP results also strongly support other requirements of the inflationary scenario. In addition to being adiabatic, the primordial fluctuations must have a Gaussian random distribution, and their power spectrum must be almost scale invariant. The WMAP data, together with other cosmological observations, do suggest a slight falloff of power in the primordial fluctuation spectrum with decreasing spatial scale.
As WMAP continues its observations for at least three more years, the emerging details of this weak scale dependence should help cosmologists choose among competing inflationary models that seek to explain how one or more scalar fields could have stretched the cosmos by at least 22 orders of magnitude in 10−35 seconds.
References
1. WMAP Collaboration, http://arXiv.org/abs/astro-ph/0302207-09 , 13–15, 17, 18, 20, 22–25.
2. J. Kovac et al., Nature 420, 772 (2002) https://doi.org/10.1038/nature01269 .
3. S. L. Bridle, O. Lahav, J. P. Ostriker, P. J. Steinhardt, Science 299, 1532 (2003) https://doi.org/10.1126/science.1082158 .


