Time-resolved electric-field measurements probe plasma breakdown
DOI: 10.1063/1.2743113
If it weren’t for plasma discharges, you probably wouldn’t be reading this story. Maybe you’re sitting in an office under fluorescent lights, or you’re reading this on a computer whose circuitry was produced by plasma etching. Maybe this page is illuminated by an energy-saving compact fluorescent bulb in your living room.
Plasma discharges are created when a gas is subject to a strong electric field. When the field is strong enough, a few electrons are torn away from their atoms. The resulting positive ions are accelerated in one direction and the electrons in another. Energetic electrons collide with and ionize other neutral atoms, increasing the number of ions and unbound electrons in the plasma. Less energetic electrons collide with atoms and promote them to excited states. As the excited atoms revert to their ground states, they emit visible or UV light.
Our knowledge of what exactly is happening in a plasma discharge still contains large gaps. (See the article by John Waymouth in Physics Today, February 2001, page 38 .) Theoretical models have been somewhat successful, but there has been a dearth of direct experimental measurements on plasma breakdowns—gases in the process of becoming plasmas—because that process happens so fast.
Gerrit Kroesen, Erik Wagenaars, and Mark Bowden, at Eindhoven University of Technology in the Netherlands, have measured how the electric field changes with time due to the movement of ions and electrons in a plasma during breakdown. 1 Such direct probing promises to add greatly to our understanding of plasmas and their applications in plasma TVs, lighting, and other technologies. “There is virtually no experimentally obtained information in these situations because the measurements are so hard. We have shown that it is possible,” says Bowden, now at the Open University in Milton Keynes, UK.
The Eindhoven group measured the electric field by looking for the Stark effect, the slight shifting of the energy levels of an atom (xenon in their experiments) in response to an electric field. The effect is most pronounced for atoms in highly excited states, called Rydberg states, in which one electron is in a large, loosely bound orbital. The electric field pulls that electron in one direction and the rest of the atom in the opposite direction. That deformation can change the state’s energy by a few ten-thousandths of an electron volt—enough to measure with a precisely tuned laser. The stronger the electric field, the larger the shift of the Rydberg state’s energy.
Observing the Stark shift is complicated. In principle, one could find the energy difference between the ground state and the Rydberg state by shining a laser at a gas and measuring the wave-length at which light is most strongly absorbed by the atoms of the gas. But such a straightforward technique would be impossible for the Eindhoven group’s experiment. Tunable lasers that can produce light of a sufficiently short wavelength are not readily available, but even if they were, other practical difficulties would stand in the way. Because the gas used in the experiment was diffuse, only a tiny fraction of the light would be absorbed, and it is difficult to measure so slight an attenuation. Also, in the experimental setup (shown in figure 1 and on the cover), the electric field of interest is confined to a small spatial region between the electrode tips, so a light beam would encounter many more Xe atoms outside the electric field than in it, which would obscure the desired signal.

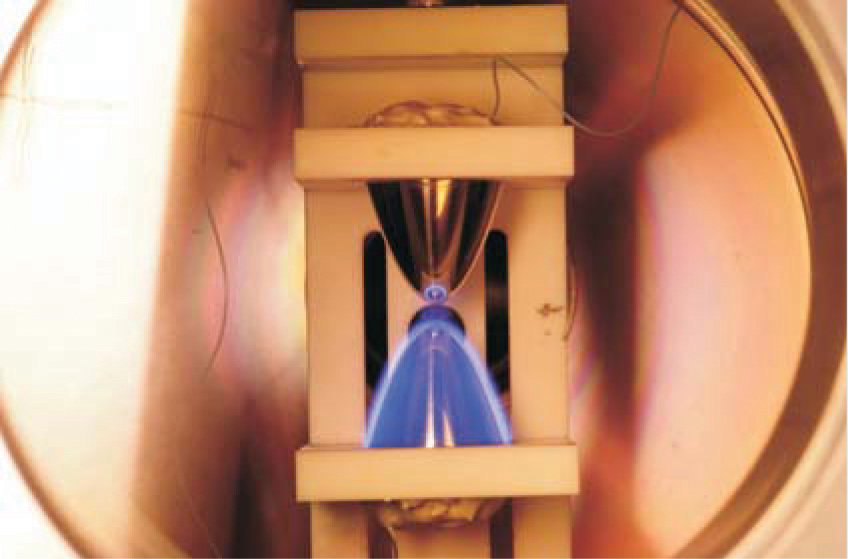
Figure 1. Parabolic electrodes 3 mm apart create a plasma in xenon gas. As Xe cations cluster around the negatively charged lower electrode, atoms near that electrode emit visible light. The spot at the tip of the upper electrode is a reflection.
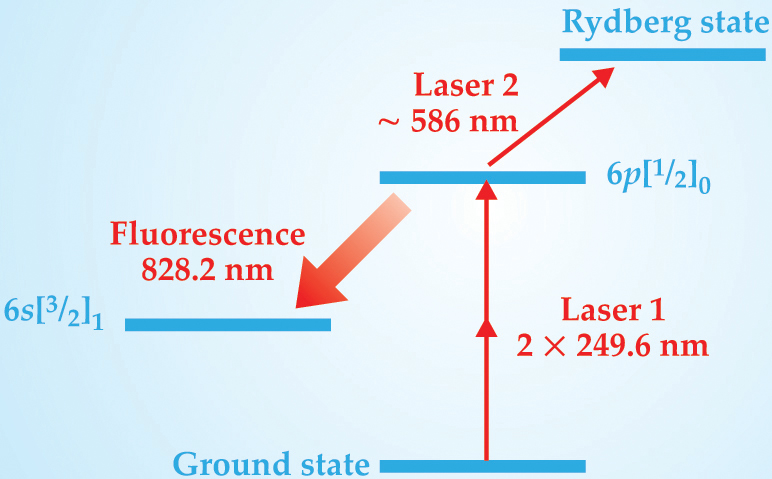
Instead, the group uses a two-laser technique called laser-induced fluorescence-dip Stark spectroscopy, based on the scheme sketched in figure 2. The first laser excites Xe atoms from the ground state to an excited state known to spectroscopists as 6p[1/2]0. The natural decay of that state into another state, 6s[3/2]1, produces fluorescence light of wavelength 828.2 nm. The detected intensity of the fluorescence is a measure of the population of the 6p[1/2]0 state. The second laser is tuned within the range of possible excitation energies from the 6p[1/2]0 state to a particular Stark-shifted Rydberg state. When the experimenters hit on the right excitation energy, atoms are removed from the 6p[1/2]0 state, and the fluorescence intensity dips. Comparing the measured Rydberg-state energy with the group’s earlier theoretical and experimental values 2 of the Stark shift in Xe yields the electric-field strength.

Figure 2. Excitation scheme for laser-induced fluorescence-dip Stark spectroscopy on xenon. The energy of the highly excited Rydberg state changes measurably with the electric field. When laser 2 is tuned to just the right transition energy, it removes atoms from the 6p[1/2]0 state, decreasing the observed fluorescence. Because 249.6-nm light is more readily produced and manipulated than 124.8-nm light, the initial excitation by laser 1 is a two-photon process.
(Adapted from ref. 1.)
Laser-induced fluorescence overcomes the difficulties of absorption spectroscopy. A low fluorescence intensity is easier to measure precisely than a small attenuation of a high-intensity beam. And a system of lenses permits the detection of only the fluorescence light that originates from the region of interest between the electrodes.
Measuring Stark shifts in that way is nothing new; the technique was introduced by Uwe Czarnetzki and colleagues in the late 1990s. 3 The Eindhoven group’s innovation was in applying the technique to the first few microseconds of the plasma formation. In the rapidly changing plasma in its breakdown phase, there isn’t enough time to scan the second laser over the full range of possible energies for the Rydberg state. Finding the electric field for just one value of time, measured from the onset of the applied voltage, requires 13 minutes and 8000 repetitions of the discharge.
Clearly, Kroesen and colleagues needed an electrode configuration that they could count on to produce identical discharges time after time. Lightning is proverbially reluctant to strike the same place twice, but a well-placed lightning rod can coax it into doing so. The Eindhoven group used a pair of parabolic electrodes, shown in figure 1, separated by a gap of 3 mm. “Breakdown was always studied in parallel-plate electrodes, where you never know where the fault is starting. In parabolic electrodes, there is one point where the two electrodes are closest, and that is where you get first breakdown,” says Kroesen.
The researchers focused the lasers on a narrow measurement volume half a millimeter above the cathode. Although they didn’t attempt to spatially map the electric field, they could infer, from what they observed as a function of time, what was happening at different points in space. Their results are shown in figure 3. For the first 25 µs, they increased the voltage between the electrodes, but it wasn’t yet enough to ionize a significant number of Xe atoms. The electric field observed during that period corresponds to a spatially uniform drop in potential from anode to cathode. Then, near the 27-µs mark, they saw a sharp increase in the electric field, followed by an equally rapid decrease to a level below what they’d seen at 25 µs.

Figure 3. Electric-field measurements (blue) and visible light emitted (red) from a measurement volume 0.5 mm above the cathode. During the period 0–25 µs, the voltage between the electrodes is increased without inducing plasma breakdown. The sharp peak and subsequent drop in the electric field around 27 µs are due to a front of positively charged xenon ions crossing the measurement volume.
(Adapted from ref. 1.)
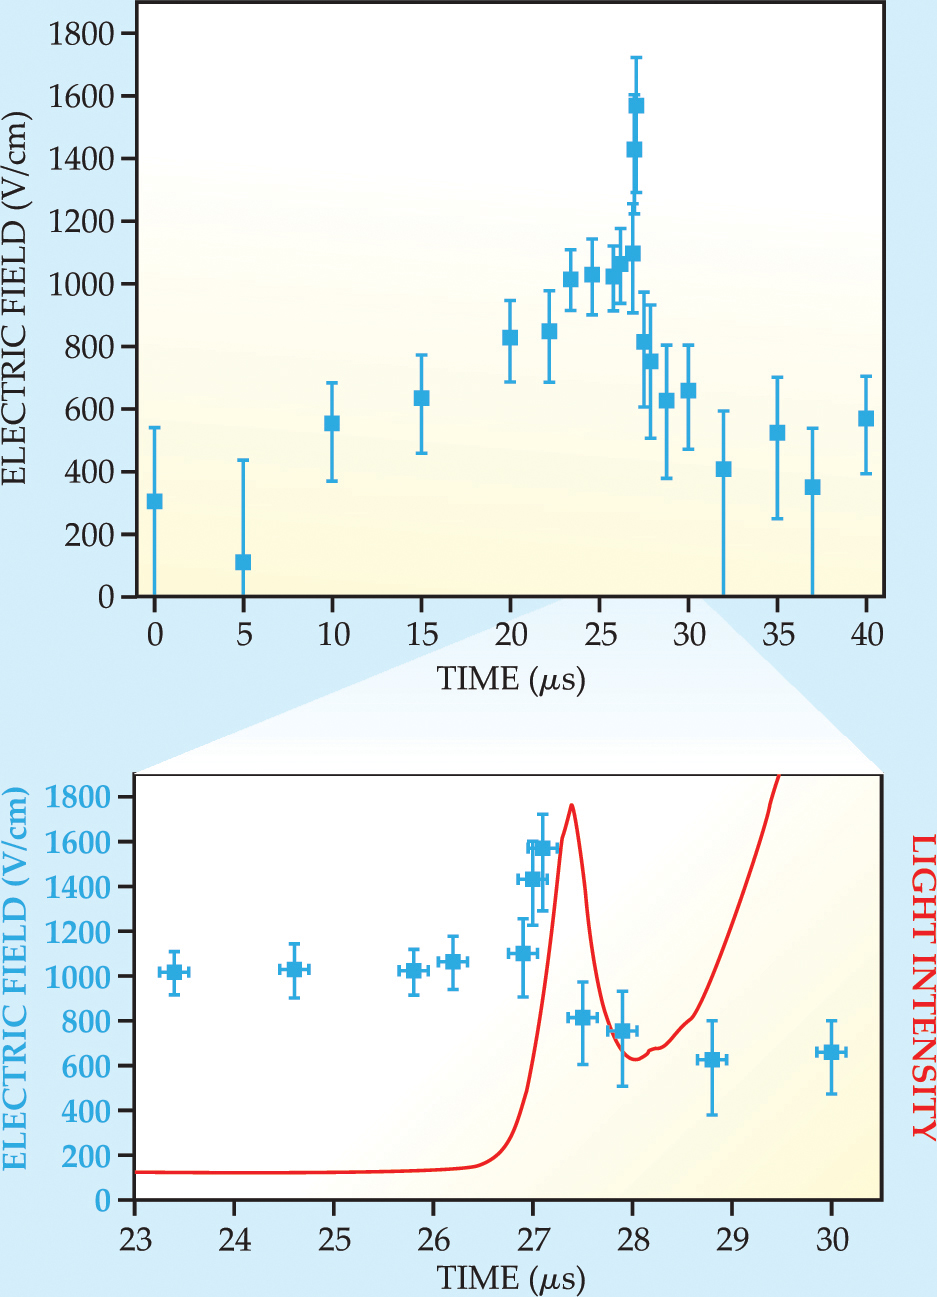
The peak and the subsequent drop in the electric field were caused by a so-called ionization front of positively charged Xe ions crossing the measurement volume. Just before the ions crossed, they were on the same side of the measurement volume as the positively charged anode, so the field from the ions enhanced the field from the electrodes. After they crossed, the field from the ions opposed the field from the electrodes. As more and more ions clustered around the cathode, the electric field in the measurement volume decreased even further while the electric field in the vicinity of the cathode increased.
Along with their electric-field measurements, Kroesen and colleagues recorded the visible light emanating from the measurement volume. That light was produced when Xe atoms, excited by collisions with electrons, relaxed back to the ground state. The experimenters found a peak in the intensity of visible light, but it occurred a few hundred nanoseconds later than the peak in the electric field. The delay arose because it takes time for the electrons to collide with Xe atoms, and it takes time for an excited-state Xe atom to decay to a less energetic state. Since the time those processes take can vary, the visible-light peak is broader than the electric-field peak.
Future work for the group includes refining their measurements of the electric-field peak. “It was sharper than expected. Normally, the faster things propel, the smoother they become,” says Kroesen. Better time resolution in the measurements of the peak will require shorter laser pulses—a challenging feat if the necessary wavelength resolution is to be retained.
The excitation scheme in figure 2 only works with Xe. A similar scheme can be implemented for krypton, but for other atoms it would be too difficult to produce the appropriate laser wavelengths or to model the Stark shift of the Rydberg states. The inclusion of a small amount of Xe as a tracer can allow Kroesen and colleagues to use their method to investigate other types of plasma, such as sodium vapor in a streetlight or mercury vapor and argon in a fluorescent lamp.
References
1. E. Wagenaars, M. D. Bowden, G. M. W. Kroesen, Phys. Rev. Lett. 98, 075002 (2007). https://doi.org/10.1103/PhysRevLett.98.075002
2. E. Wagenaars, G. M. W. Kroesen, M. D. Bowden, Phys. Rev. A 74, 033409 (2006). https://doi.org/10.1103/PhysRevA.74.033409
3. U. Czarnetzki, D. Luggenhölscher, H. F. Döbele, Phys. Rev. Lett. 81, 4592 (1998). https://doi.org/10.1103/PhysRevLett.81.4592
More about the authors
Johanna L. Miller, jmiller@aip.org


