Supercooled water goes supercritical
DOI: 10.1063/PT.3.3863
There’s more to water’s phase diagram than the simple solid, liquid, and gas of everyday experience. The low-temperature, high-pressure portion of the diagram, for example, contains a spiderweb of solid–solid phase transitions between various stable crystalline structures. And a 25-year-old theory predicts that deep in the supercooled regime, liquid water, too, undergoes a phase transition between two structurally distinct forms. Experiments have hinted at that liquid–liquid phase transition (see, for example, Physics Today, December 2013, page 16 ). But it’s never been directly observed.
Now Stockholm University’s Anders Nilsson and his colleagues have produced some of the strongest evidence yet in support of the two-liquid theory. 1 The researchers scattered femtosecond x-ray pulses off a stream of water microdroplets that had been evaporatively cooled under vacuum to as low as 227.7 K, or −45.4 °C. From different portions of the scattering curves, they extracted four thermodynamic and correlational quantities. All four peaked at similar temperatures, just above 229 K.
Those previously unseen peaks don’t mark the phase transition itself—that would have been characterized by a divergence in the measured quantities, not a simple maximum. But they are a sign of a so-called Widom line, a hallmark of a supercritical fluid. The results support a phase diagram like figure
Figure 1.

A phase diagram of water and its metastable states. Deep in the supercooled regime, water is hypothesized to exist in two distinct liquid phases: high-density liquid (HDL) and low-density liquid (LDL), in analogy to the well-known high-density amorphous (HDA) and low-density amorphous (LDA) ices. New experiments suggest that the liquid–liquid phase boundary ends at a critical point. The Widom line that extends past the critical point is characterized by maxima in the correlation length and several thermodynamic response functions.
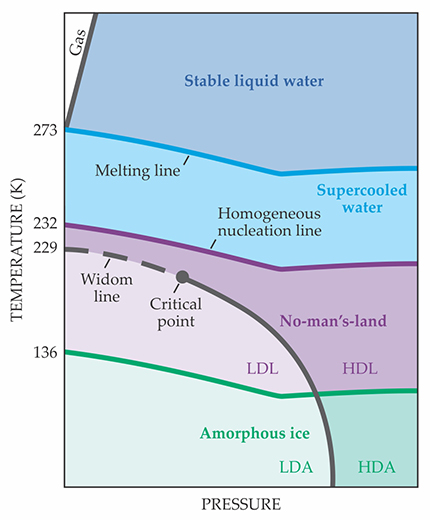
Into no-man’s-land
Experimenters have long known that it’s possible to maintain water in its liquid state below 273 K. Freezing at that temperature proceeds by heterogeneous nucleation: The water molecules rely on small impurities—a dust grain or tiny gas bubble, say—to help them over the free-energy barrier that blocks crystallization. Clear the water of those impurities, and heterogeneous nucleation can’t happen.
But at a lower temperature, 232 K at atmospheric pressure, the random molecular motion of the water itself is enough to surmount the barrier to crystallization, and even the purest supercooled water, although still technically metastable, inevitably freezes by homogeneous nucleation in just tens of microseconds. For that reason, the swath of the phase diagram between 232 K and water’s glass transition temperature of 136 K has been ominously dubbed “no-man’s-land.”
Decades of work on the easily reachable part of the supercooled regime have yielded tantalizing results. 2 As water’s temperature falls, quantities such as the isothermal compressibility and heat capacity start to skyrocket, and they appear to be heading toward a divergence—a sign of a phase transition or perhaps some other singularity. Frustratingly, however, whatever it is lay just over the homogeneous nucleation line—in no-man’s-land.
But no-man’s-land isn’t inaccessible. A quick enough experiment could, at least in principle, cool water below 232 K and make the necessary measurements in the microseconds before the sample froze. Several groups have been competing in recent years to push the understanding of supercooled water into the heretofore unexplored regime. (See, for example, Physics Today, February 2017, page 18 .)
Widom’s peaks
Nilsson and colleagues settled on x-ray scattering as their technique of choice in 2011. The experiment is elegant in its simplicity. A dispenser shoots a thin jet of water into a vacuum chamber, where it spontaneously breaks up into a stream of equal-sized droplets. As the droplets hurtle toward their intersection with the pulsed x-ray beam, they cool by evaporation. By adjusting the distance between the dispenser and the beam, the researchers can study droplets of different temperatures.
X-ray scattering gives access not only to a measure of a material’s local molecular order called the correlation length, whose divergence is the defining feature of a second-order phase transition, but also to the isothermal compressibility and other thermodynamic response functions. Because each of those quantities is extracted from a different part of the scattering curve as a function of scattering angle, they can be regarded almost as independent measurements.
The group’s previous efforts with the technique were fraught with experimental difficulties. 3 The water droplets and focused x-ray beam were similar in size, so an x-ray pulse that didn’t quite hit the center of its droplet scattered off the droplet’s edge instead, giving unusable data. Worse, the x-ray detector had a limited dynamic range, so although the prominent wide-angle x-ray scattering (WAXS) ring was well captured, the small-angle x-ray scattering (SAXS) region was too faint to see—and that’s where most of the valuable information is contained.
In the new work, their fourth attempt, the researchers have corrected those problems. They cut down on edge scattering by increasing the droplet size, even though larger droplets cool more slowly and cut down on the accessible temperature regime. And they used a newly developed detector capable of simultaneously recording the WAXS and SAXS regions.
The results are clear. As shown in figure
Figure 2.

Correlation lengths, extracted from x-ray scattering data, of supercooled water and deuterated water. The solid red and blue curves are power-law fits of the higher-temperature data; the dashed lines are linear fits to the lower-temperature data. (Adapted from ref.
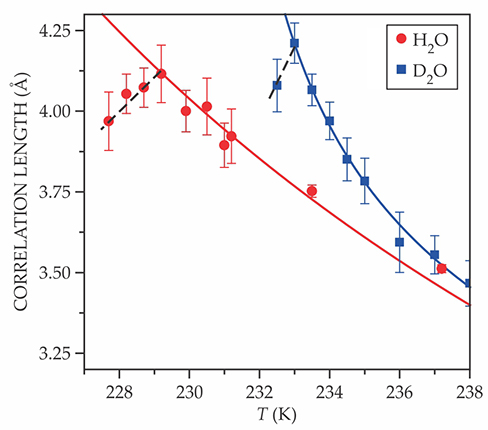
To strengthen their case, the researchers repeated their measurements with deuterated water. Again they found four nearly coincident peaks, this time at 233 K instead of 229 K. The temperature difference may be a clue to the origin of some of water’s odd behavior. Because they’re so light, hydrogen nuclei experience much stronger quantum effects than deuterium nuclei do. Whenever a protonated molecule and its deuterated analogue behave significantly differently—as they do here with the 4 K gap between the Widom lines—it’s a sign that those quantum effects are somehow in play.
The first observation of the Widom line in supercooled water strongly suggests that a critical point and a phase transition are lurking at higher pressures in no-man’s-land. But a real smoking gun would be the direct observation of the liquid–liquid phase transition. Nilsson and colleagues can’t achieve that with their current evaporative-cooling method, which is effective only in vacuum. But they have some ideas—confidential for now—about other ways they might follow the Widom line toward the critical point. They’ll try the experiments later this year.
References
1. K. H. Kim et al., Science 358, 1589 (2017). https://doi.org/10.1126/science.aap8269
2. C. Huang et al., J. Chem. Phys. 133, 134504 (2010); https://doi.org/10.1063/1.3495974
R. J. Speedy, C. A. Angell, J. Chem. Phys. 65, 851 (1976). https://doi.org/10.1063/1.4331533. J. A. Sellberg et al., Nature 510, 381 (2014). https://doi.org/10.1038/nature13266
More about the authors
Johanna L. Miller, jmiller@aip.org


