Seismic data provide a deep dive into groundwater health
DOI: 10.1063/pt.tlbj.ljtn
Is California too dry, too wet, or both? Just weeks after greater Los Angeles was hit by January’s devastating wildfires, which were exacerbated by several months with almost no rain, a wetter-than-usual February brought flooding and mudslides to the region. The variability is just as pronounced on a year-to-year scale: The average annual rainfall at Los Angeles International Airport is around 360 mm, but several recent years, including 2023, have brought more than twice that amount, whereas others have had less than half. That weather whiplash, which isn’t confined to California, seems to be connected to anthropogenic climate change, so it’s expected to continue, intensify, and spread. 1
Rainfall and surface water don’t tell the whole story. Groundwater is an important part of California’s water supply, not just in the agricultural Central Valley but also in urban areas, such as greater Los Angeles. Stored in the cracks of rock and the pores of layers of sand and gravel, groundwater comprises more than 90% of California’s water reserves, and it’s especially important during times of drought, when surface lakes and rivers are quickly lost to evaporation. If surface water is like a region’s checking account—easily accessible but rapidly fluctuating—then groundwater is the corresponding savings account: hidden, larger, and more reliable.
But California’s savings account is at risk of being overdrawn, even in times when new deposits should be plentiful, according to new research led by Shujuan Mao (now a faculty member at the University of Texas at Austin, but a postdoc at Stanford University at the time she did the work). 2 Mao and colleagues used seismic data—collected in abundance in Southern California—to track groundwater levels in greater Los Angeles. Their method is unusual among groundwater-monitoring techniques because it offers resolution in all four dimensions: latitude, longitude, depth, and time.
The researchers found that after several years of drought, the exceptionally rainy year of 2023 did a good job of replenishing near-surface groundwater, but deeper water reserves remained significantly depleted. In a future of increasingly unsteady rainfall, their method may be a useful tool to guide water management decisions.
Seeing underground
The conventional approach to groundwater monitoring—drilling wells and observing the water level in them—provides only incomplete information. Unlike a surface lake, whose water level everywhere can be gauged from a measurement at a single point, groundwater inhabits a complex, unknown network of layers and channels. As shown in figure
Alternatively, one can look at changes in surface contours: Removing enough water from underground causes the ground level to sink. The effect is especially pronounced in the Central Valley, where so much groundwater has been pumped over the past century that the ground has subsided by several meters. Those large changes are irreversible, but smaller ones might not be: Satellites and GPS transponders can track the subtle fall and rise of the surface as aquifers are drained and refilled. They cannot, however, distinguish between deep and shallow groundwater.
Enter seismic hydrography, the technique used by Mao and colleagues. The speed of a seismic wave depends on what it’s traveling through, so an aquifer full of water can be distinguished from a depleted one. The difference in speed is slight—on the order of a tenth of a percent—but it’s measurable.
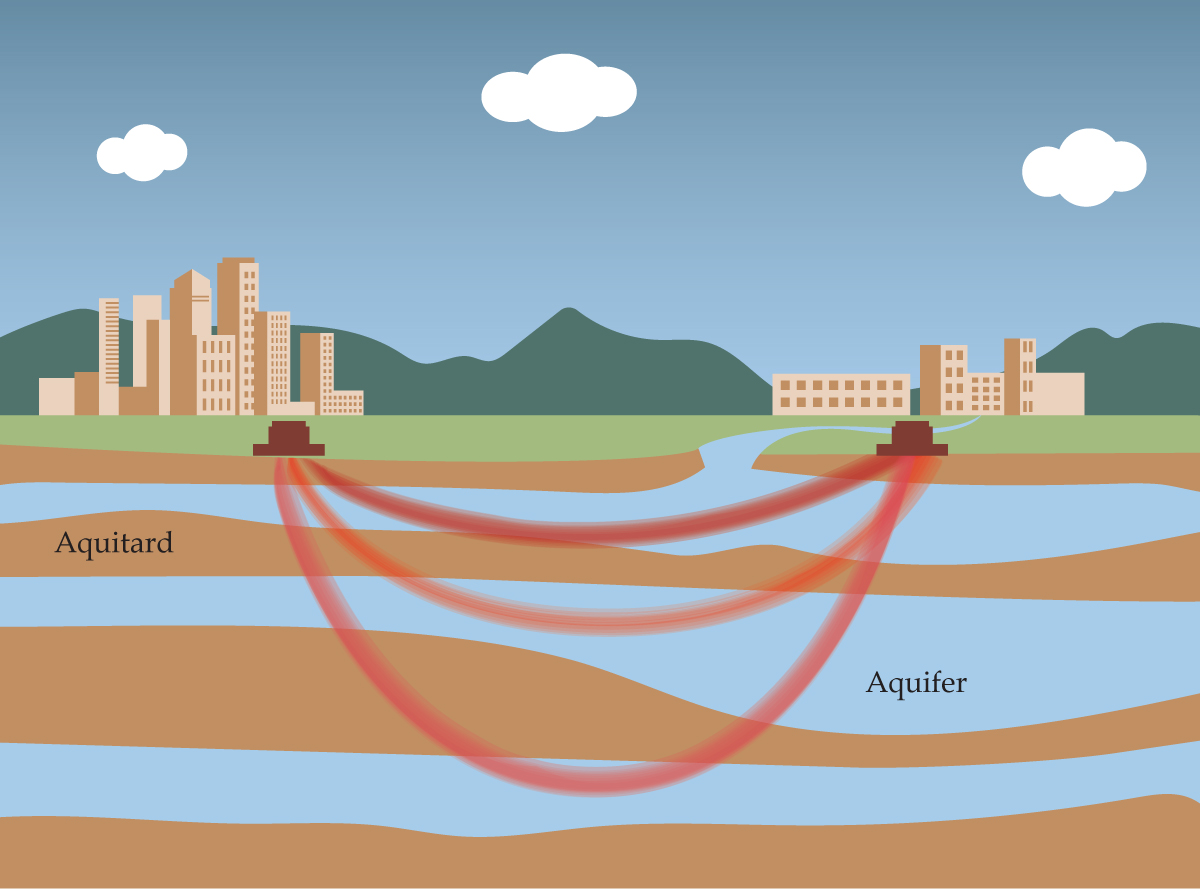
Figure 1.

The water beneath our feet occupies a vast and complex network of porous aquifers separated by low-permeability aquitards. Because the connections and flow rates between the layers are largely unknown, it’s difficult to keep track of how much water remains. Seismic sensing offers a solution: When aquifers are drained or refilled, the speed at which they conduct seismic waves changes. Through careful analysis of the never-ending ambient seismic noise, researchers can monitor the status of aquifers at different depths. (Image by Jason Keisling.)
It’s a decades-old idea to use seismic waves to probe beneath Earth’s surface—to look not just for groundwater but for oil and gas, magma conduits beneath volcanoes, and more. But the method has not always been capable of the detail that Mao and colleagues acquired. Its capabilities have been pushed forward by two advances.
The first is that earthquakes are not the only useful generators of seismic waves. Ambient seismic noise—from sources such as ocean waves, car traffic, and Taylor Swift fans (see Physics Today, February 2025, page 21 )—is constantly rumbling through Earth’s crust. By calculating the interference of ambient vibrations recorded by pairs of seismometers, researchers can mathematically deduce the speed of waves through the intervening medium at all times, not just in the wake of an earthquake. (See the article by Roel Snieder and Kees Wapenaar, Physics Today, September 2010, page 44 .)
The second realization is that special information is contained in part of the signal called the coda wave, the last piece of a seismic wave to reach its destination. The reason coda waves are delayed is that they take a longer path: Rather than traveling in a direct route, they bounce around several to hundreds of times. The multiple reflections amplify small changes in propagation speed—the very thing Mao and colleagues seek to assess.
In contrast to signals from discrete earthquakes, which make it easy to identify the last part of a wave to arrive at a detector, ambient seismic noise is a never-ending superposition of waves from many different sources. So it’s a mathematically thorny task merely to find the coda waves, let alone figure out what they’re saying about localized changes in propagation speed. But over the past decade, seismologists have developed theoretical tools 3 that are up to the task, and Mao and colleagues have refined the work into a 4D groundwater-imaging technique.
Wet and dry
Mao has been interested in seismic imaging of Californian groundwater ever since her graduate school days at MIT. But when she started her postdoctoral work at Stanford in 2022, the subject took on a new meaning. “In 2023, I was experiencing the storms for myself,” she says. “And I saw posts on social media with the sentiment that ‘the water shortage is a hoax,’ with pictures of floods and surface water.” She wondered how the groundwater reserves, hidden from view, were responding to the change in the weather.
For the new work, she and her colleagues used 20 years’ worth of data from 68 seismometers across greater Los Angeles. Looking back much further in time would have been a challenge: Back in the days when data were stored on reels of magnetic tape, the standard practice was to retain data only from the time of an earthquake; everything else was deleted. “The Southern California Earthquake Data Center started recording continuous seismic data in the 1990s, before anyone appreciated the importance of it,” explains William Ellsworth, one of Mao’s postdoctoral advisers and coauthors. “It was a wise choice.”
Figure
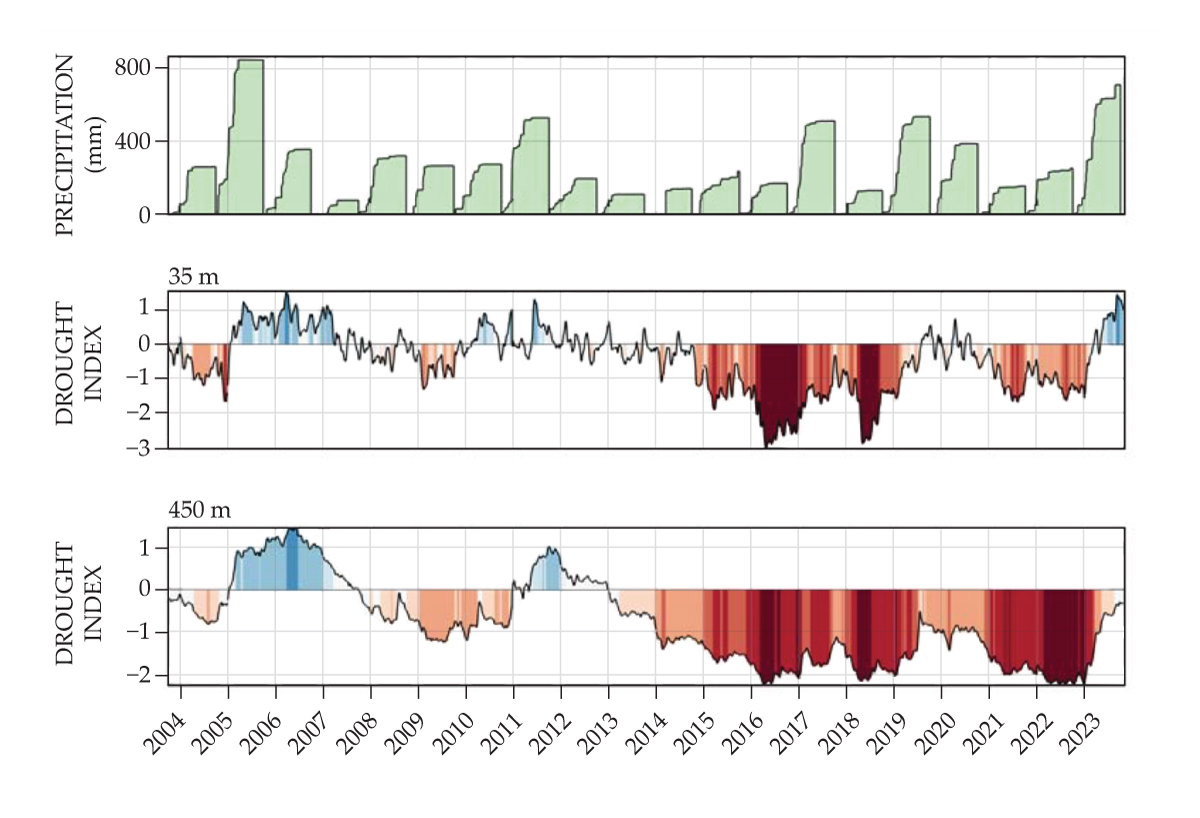
As the plots show, both shallow and deep groundwater were steadily depleted during the extremely dry period between 2012 and 2016. In the intermittent wet years that followed, only the shallow aquifers recovered: By 2023, shallow groundwater stores were back to where they had been in 2006, while the deeper ones were still considerably short.
Brighter future
The situation is not all doom and gloom. Groundwater resources can be managed with sophisticated and efficient strategies. Municipal water providers can implement dynamic pricing schemes based on a sustainable rate of withdrawal. And engineers can channel stormwater and treated wastewater so that they filter back into the aquifers instead of flowing out to sea.
Figure 2.

The past 20 years have seen greater Los Angeles go from wet to dry and back again, as shown by the plot of annual cumulative precipitation in the top panel. During dry periods, such as the one from 2012 through 2016, the metropolitan area relies on its groundwater supply even more than usual, but wet years, such as 2023, are not necessarily enough to refill the reserves. The bottom two panels show seismically derived drought indices for both shallow (35 m below ground level) and deep (450 m) groundwater. Shallow aquifers recovered well from the period of depletion, but deeper ones did not. (Figure adapted from ref.
The effectiveness of those strategies is highlighted by some of Mao’s previous work. 4 One paper, which pre-dates the 2023 storms, reported seismic measurements of the general variability of groundwater levels in response to weather changes. For their analysis, Mao and colleagues divided the greater Los Angeles region into basins—among them, the Los Angeles Central Basin and the Santa Ana Basin—and they found that the latter was much more resilient to weather shocks than the former.
The boundary between those basins is geographical, not geological: The Santa Ana Basin lies in Orange County, and the Los Angeles Central Basin lies in Los Angeles County. No natural hydrological barrier separates the regions; the biggest salient difference is that their water supplies are managed by different jurisdictions.
But the researchers caution against concluding that one municipality is better at groundwater management than another. Water management strategies are not free, and different water districts have different resource bases to draw on. Policymakers and engineers need to manage competing priorities to meet the present and future needs of their populations, and so far, they’ve been working with an incomplete picture of the health of their aquifers over time. Seismic hydrography could fill those information gaps.
It’s not just earthquake-prone coastal California, with its existing network of seismometers, that needs information for groundwater management. Groundwater is critical to supporting agriculture and human communities in the Central Valley, the southwestern US, and the Great Plains above the Ogallala Aquifer, among other regions. Seismic hydrography can work in those regions, too, thanks to a technique called distributed acoustic sensing, which uses optical fibers, instead of dedicated seismometers, to measure seismic waves. (See the Quick Study by Ethan Williams, Physics Today, October 2022, page 70 .)
The details of the analysis will need to be adjusted because seismometers measure ground movement, whereas optical fibers measure ground strain. “But fibers are everywhere, even where there are no seismometers,” says Ellsworth. “With seismometers, you might get one measurement every ten miles. Fibers give thousands of measurements over the same distance. So the information content just explodes.”
This article was originally published online on 27 March 2025.
References
1. D. L. Swain et al., Nat. Clim. Change 8, 427 (2018)https://doi.org/10.1038/s41558-018-0140-y
D. L. Swain et al., Nat. Rev. Earth Environ. 6, 35 (2025).https://doi.org/10.1038/s43017-024-00624-z2. S. Mao et al., Science 387, 758 (2025).https://doi.org/10.1126/science.adr6139
3. See, for example, L. Margerin et al. Geophys. J. Int. 204, 650 (2016).https://doi.org/10.1093/gji/ggv470
4. S. Mao et al., Nat. Commun. 13, 4643 (2022).https://doi.org/10.1038/s41467-022-32194-3
More about the authors
Johanna L. Miller, jmiller@aip.org


