Radio interferometry measures the black hole at the Milky Way’s center
DOI: 10.1063/1.3027977
Almost every galaxy is thought to have a supermassive black hole at its core. Much closer to home are some of the millions of stellar-mass black holes believed to inhabit the disk of our own galaxy. But observational astronomers have a particular fondness for the four-million-solar-mass (M ☉) black hole presumed to sit at the Milky Way’s heart. Although it’s 26 thousand light-years away it subtends by far the largest angle of any black hole candidate in the sky.
A black hole itself sheds no light, but a surrounding disk of accreting material can shine at x-ray optical, and radio wavelengths. And with high enough resolution, one might hope to see a silhouette of the black hole’s event horizon on the radiant image of the accretion disk. The event-horizon diameter of the presumed black hole at the Milky Way’s center, roughly the size of Mercury’s orbit, subtends an angle of 20 microarcseconds on the sky. That’s far too small to be resolved by optical telescopes, or even by a bunched array of radio telescopes. The observer’s one hope in recent years of resolving such a black hole silhouette has been very-long-baseline radio interferometry (VLBI) with an array of radio telescopes separated by hundreds and thousands of kilometers.
But the technological problems have been daunting. Most radio astronomy, and just about all VLBI, has until now been done at wavelengths λ longer than 3 mm. To seek event-horizon-scale structure at the Milky Way’s center, however, one needs to go to shorter wavelengths. It’s not just a question of diffraction limits. A dense plasma surrounding the galactic center scatters radio waves with a severity that increases like λ2. At wavelengths of 3 mm or longer, this scatter broadening washes out any horizon-scale structure. On the other hand, the exacting synchronization and fast data recording that make VLBI possible become increasingly difficult with decreasing wavelength.
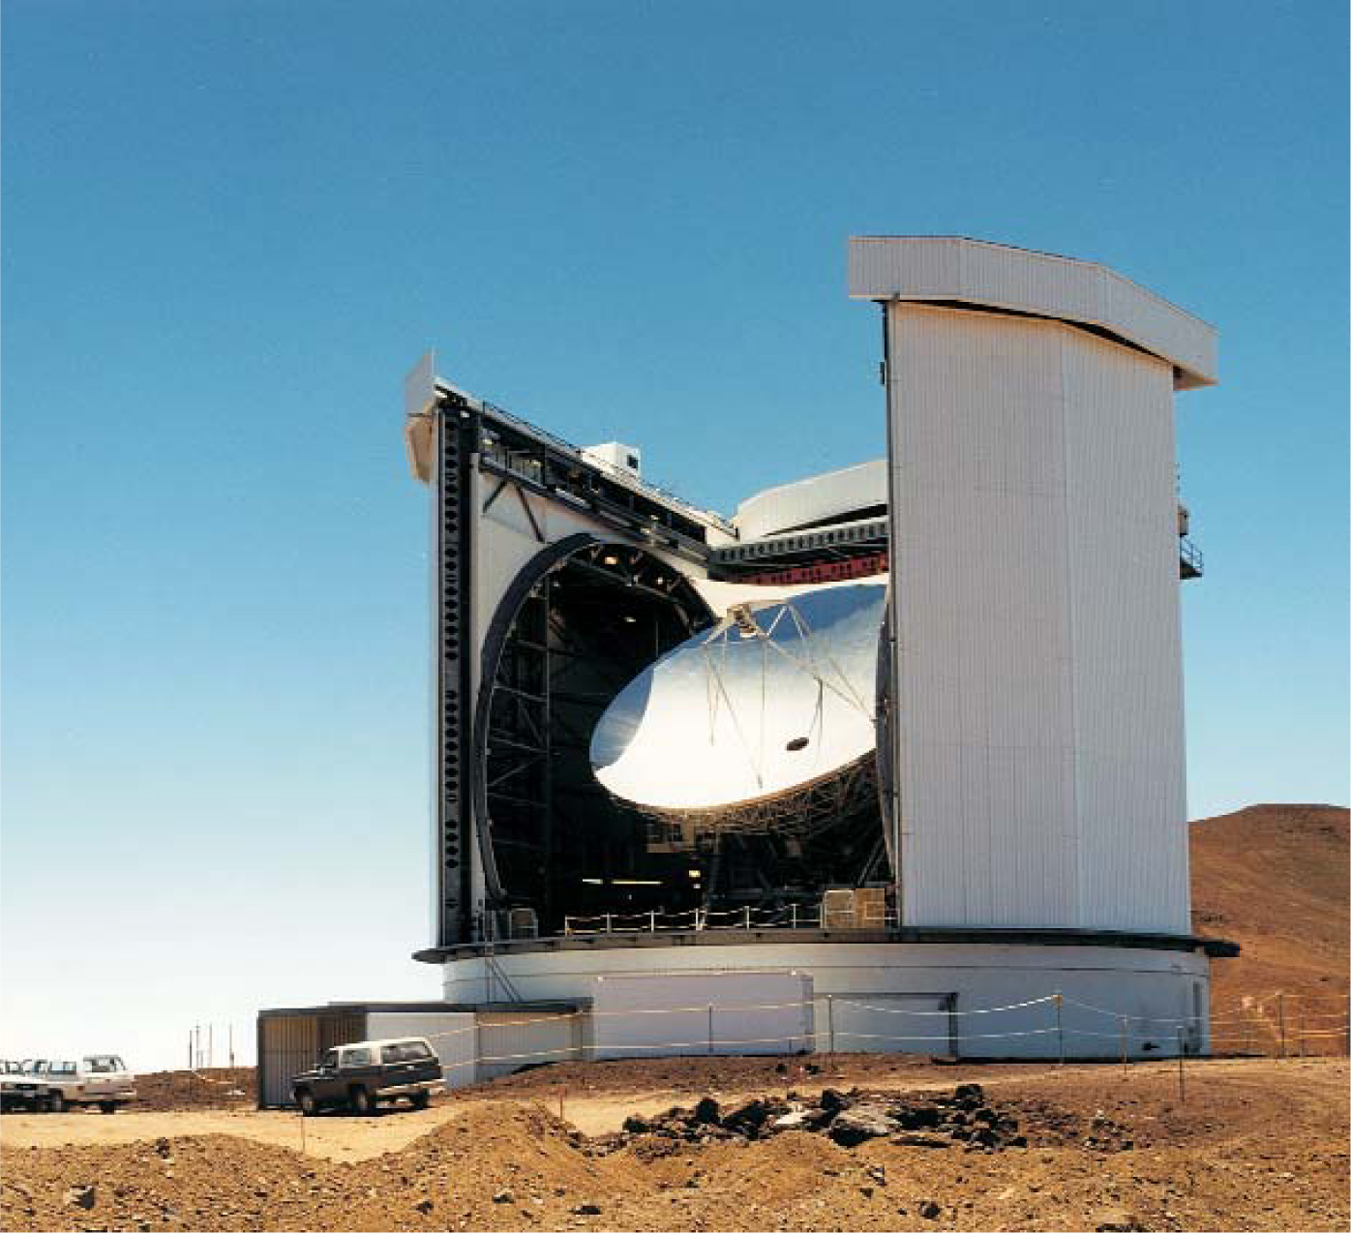
Sheperd Doeleman and colleagues at MIT’s Haystack Observatory near Boston have been addressing those issues for almost 10 years. Now a broad collaboration led by Doeleman has reported the first VLBI measurement of horizon-scale structure at the galactic center. 1 To that end, the collaboration was granted two consecutive observing days last year at three radio telescopes operating at 1.3 mm: the UK’s James Clerk Maxwell Telescope on Mauna Kea in Hawaii (see figure 1), the Arizona Radio Observatory’s Submillimeter Telescope on Mount Graham, and one dish of CARMA, the Combined Array for Research in Millimeter-Wave Astronomy in California’s Sierra Nevada.

Figure 1. The James Clerk Maxwell Telescope, with an antenna diameter of 15 meters, is the world’s largest radio telescope designed to operate at submillimeter wavelengths. It sits at an altitude of 4100 meters near the summit of Mauna Kea in Hawaii. Last year it served as one of three telescopes forming a very-long-baseline-interferometry array that achieved the first size measurement of the Sagittarius A* radio source at the center of our galaxy.
UK JOINT ASTRONOMY CENTRE
At such short wavelengths, atmospheric moisture can absorb much of the incident radiation. That’s why one wants the sites of millimeter and submillimeter telescopes to be high and dry. To combine the three telescopes into a temporary VLBI array, Doeleman and company brought their own hydrogen-maser time standards and high-speed recording systems to each site.
Sagittarius A*
For several decades the bright, compact radio source Sgr A* in the constellation Sagittarius has been thought to mark a supermassive black hole at the center of our galaxy. Its four-million M ☉ mass M is inferred from impressive IR observations of the orbits of stars that approach within 0.01 arcsec of Sgr A* (see Physics Today, February 2003, page 19 ). General relativity takes the corresponding Schwarzschild radius R S = 2GM/c 2 to be the radius of the surrounding event horizon from inside of which nothing can escape. But strong gravitational lensing by the black hole should magnify the apparent diameter of the event horizon’s silhouette to about 5 R S, corresponding to an angular size of 52 µas.
“So the goal in our first 1.3-mm assault on Sgr A *,” says Doeleman, “was to look for structure with a measurement resolution of a few tens of microarcseconds.” With only three baselines between the three telescopes, he explains, there was no hope of acquiring a full two-dimensional image of the radio source. “But even without a proper image, there’s much one can learn.”
In VLBI, as in all other astronomical interferometry one learns about the distribution of an extended source on the sky by combining the radiation received at two separated antennas and measuring how the distinctness of the resulting interference fringes varies with the changing orientation of the baseline between the antennas as Earth rotates. That distinctness is described by a so-called visibility function, which is a measure of the wavefront’s spatial coherence across the baseline.
In optical interferometry the value of the visibility function for a given baseline is just the peak-to-trough ratio of the fringes. In radio interferometry it becomes a complex function, essentially because each antenna is recording both amplitude and temporal phase. But in either case, a 2D plot of the visibility function versus the projected length and orientation of baselines on the plane normal to the line of sight is the Fourier transform of the source distribution. With enough data from sufficiently many well-positioned intercontinental baselines, one can invert VLBI visibility distribution to recover an image of the source.
One wants the longest possible baselines because angular resolution is given by the ratio of wavelength to projected separation. In optical interferometry, baselines are limited to a few kilometers by the need to physically mix the light from the separated apertures by means of mirrors or optical fibers. Because radio frequencies are so much lower and can, in effect, be made even lower by heterodyne beat-frequency techniques, one can create interference patterns simply by bringing together the separately recorded radio signals after the fact. That’s possible precisely because, unlike an optical telescope, each radio telescope can record phase as well as amplitude.
At an observing wavelength of 1.3 mm, all this requires ultrafast recording and very precise timing synchronization and stability. The collaboration accomplished the former with banks of hard disk drives and the latter with GPS-synchronized hydrogen masers. The recorded Sgr A* data from the three telescopes were then shipped to a specially configured “correlator” supercomputer at Haystack for comparison.
The correlator is designed to search the combined radio data for interference signal-to-noise maxima indicative of a common source sighted at both ends of a baseline. The time delay (and any Doppler shift) between the interfering waves indicates the direction of the source relative to the baseline. Unfortunately, the telltale interference signals persist at a given delay for no more than about eight seconds. On that time scale, atmospheric turbulence creates air-density variations that change the diffractive index along the beam paths enough to destroy phase coherence in VLBI at 1.3 mm. Therefore, to look for sightings of Sgr A* from a particular baseline, the correlator had to divide the data from each 10-minute observation into 8-second segments and then search anew in each segment for a delay that yielded a strong interference signal.
The sightings
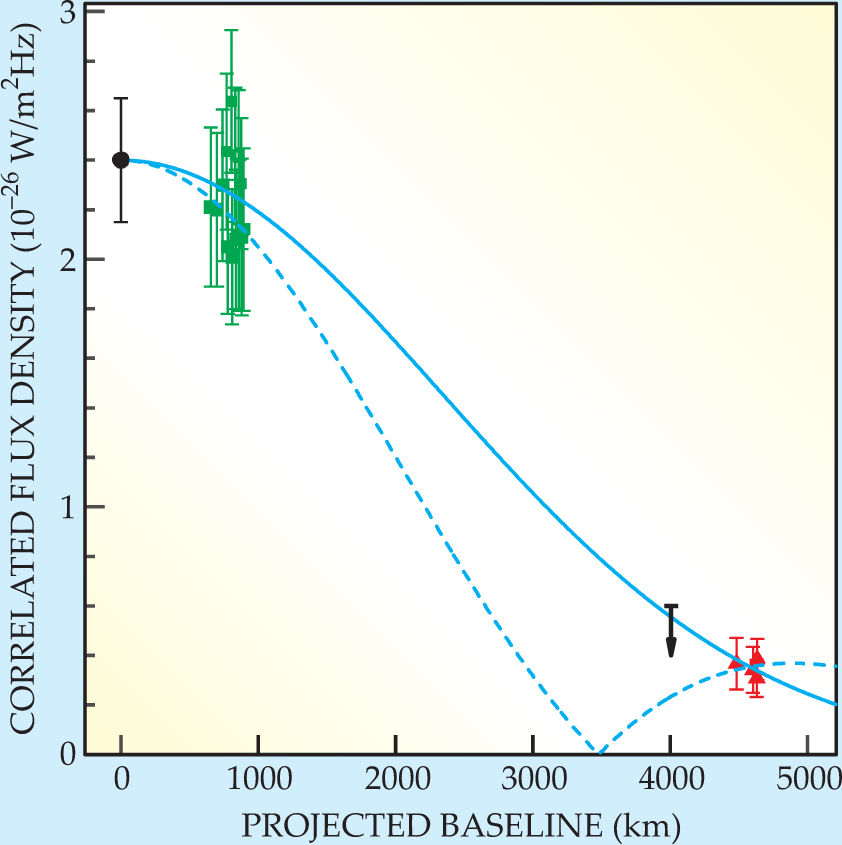
On 10 and 11 April 2007, Doeleman and company undertook a total of 15 ten-minute observing scans with all three telescopes pointed at the galactic center. Figure 2 shows the results. On the 900-km baseline between the Arizona and California telescopes, they found a robust interferometric signal of Sgr A* on every scan. Figure 2 plots each sighting’s correlated flux density—the source’s coherent intensity as measured by the visibility of the interference fringes—against the changing projected length of the baseline on the rotating Earth. On that relatively short baseline, the correlated flux densities were not much smaller than one sees in a direct, single-site observation of Sgr A*.

Figure 2. Determining the width of Sagittarius A* from interferometric observations with three widely separated radio telescopes. For any pair of them, the correlated flux density—a measure of the interference pattern’s clarity—is plotted against the projection of their separation normal to the line of sight as Earth rotates. The source’s width was estimated from fits of simple models of its shape on the sky to measurements on the Arizona–California (green) and Arizona–Hawaii (red) baselines. The upper limit marked by the arrow at 4000 km is deduced from the failure to sight Sgr A* on the California–Hawaii baseline, and the datum at zero baseline is a single-site measurement of the source strength. The solid curve, showing the best fit to a circular source geometry, yields an angular source width of 37 µas. The dashed curve shows a satisfactory fit with a ring geometry, seen face on, with an inner diameter of 35 µas.
(Adapted from ref. 1.)
On the two long baselines to Hawaii, one expects the correlated flux density to be much lower, and finding any interference signal at all is much harder. It helps to think of the optical interferometer with which Albert Michelson measured stellar diameters a century ago. In Michelson’s instrument, mirrors mixed the light from two apertures whose separation d could be varied. At small d, any stellar source looked point-like, yielding clear, well-separated interference fringes. But as the aperture separation was increased, the angular distance λ/d between interference fringes became smaller, until at last it was comparable with the angular size of the star itself and the interference pattern was washed out by light from different parts of the star. The wider the separation between apertures, the less distinct were the fringes. And the bigger the star’s angular size, the faster was the loss of interference visibility with increasing separation.
Indeed, as shown in figure 2, Sgr A* was detected on the Arizona–Hawaii baseline in only 4 of the 15 scans. And the California–Hawaii baseline yielded no interferometric Sgr A* sightings at all. On the other hand, calibration scans of half a dozen quasars on the same two days invariably produced successful interferometric sightings on all three baselines.
Fitting for size
Meager as they are, the Sgr A* detections on the 4600-km Arizona–Hawaii baseline yielded the principal information about the spatial extension of the source. That’s because the falloff of the visibility function is what measures the source size, and the short-baseline data show little falloff.
To estimate the source size from so few measurements, the collaboration fitted simple illustrative models of the source geometry to the data. Figure 2 shows the best fit to a model that simply assumes a circularly symmetric source on the sky whose radio intensity has a gaussian falloff with distance from the central maximum. The fit yields a source diameter (at half maximum) of 43 µas. But that’s still uncorrected for the smearing effect of scattering by the intervening plasma.
Extrapolating from scattering-dominated VLBI measurements of Sgr A* at longer wavelengths, the group concluded that the source’s intrinsic width in the absence of scattering would be about 37 µas. That’s actually three standard deviations smaller than the minimum 52-µas gravitationally lensed image expected for a source symmetrically centered on the black hole. And even if the black hole is spinning rapidly, general-relativistic spin distortion could only bring that minimum down to 45 µas.
Doeleman and company point out that this marginal discrepancy might be indicating that the radio source is not symmetrically centered on the black hole. If, for example, the source is a rapidly spinning accretion disk seen edge on, relativistic Doppler beaming would make the disk’s approaching side appear much brighter than the receding side. Or the source might be the radio-loud nozzle of one of a pair of jets of relativistic material expelled in opposite directions along the disk’s spin axis.
To emphasize that the new data cannot yet discriminate between various plausible source geometries, figure 2 also shows a satisfactory fit with a ring-shaped source seen face on, with inner and outer diameters of 35 and 80 µas. The ring model’s dark inner circle is meant to suggest the black hole silhouette found in detailed general-relativistic simulations of an accretion disk at Sgr A*. “But over the next year or two,” says Doeleman, “as we add more telescopes and start observing at submillimeter wavelengths, we hope to constrain ever more sophisticated models.”
“That’s important, because decades of theoretical calculations have thus far failed to converge on a consensus about the shape and character of Sgr A*’s accretion disk,” says Harvard theorist Avi Loeb, who has recently joined in the analysis of the new observations. “But this first VLBI size determination already has largely foreclosed the possibility that the central object is anything other than a black hole.” If the accreted material were landing on a physical surface that small—perhaps some sort of supermassive compact star—rather than disappearing behind an event horizon, there would have to be far more IR radiation from Sgr A* than what’s been seen.
The modest IR luminosity of Sgr A* is known occasionally to flare up and oscillate with periods on the order of half an hour. The conjecture is that those oscillations represent occasional hot spots rotating near the accretion disk’s inner edge. “By next spring,” says Doeleman, “we should be able to follow the movement of such hot spots as they spiral toward the event horizon.” 2 General relativity predicts that the orbital period of the disk’s inner edge has some dependence on the black hole’s spin. Independent of the hot spots, Doeleman, Loeb, and coworkers have now reported modest constraints on the black hole’s spin gleaned from the VLBI data already in hand. 3
Real 2D imaging of Sgr A* is perhaps five years away. That’s when ALMA, the Altacama Large Millimeter/submillimeter Array of advanced 12-meter radio telescopes now under construction in the high desert of Chile, should be ready to join a VLBI network. “It’s the best site on the planet for submillimeter observing,” says Doeleman.
References
1. S. S. Doeleman et al. (Millimeter/Submillimeter VLBI collaboration), Nature 455, 78 (2008). https://doi.org/NATUAS
10.1038/nature07245 2. S. S. Doeleman, V. L. Fish, A. E. Broderick, A. Loeb, A. E. E. Rogers, http://arxiv.org/abs/0809.3424 .
3. A. E. Broderick, V. L. Fish, S. S. Doeleman, A. Loeb, http://arxiv.org/abs/0809.4490 .


