Radar reveals new hot spots on Enceladus
DOI: 10.1063/PT.3.3543
Since the Cassini spacecraft began orbiting Saturn in 2004, its nearly two dozen flybys of Enceladus have offered up a series of increasingly tantalizing observations of the icy Saturnine moon. (See the article by John Spencer, Physics Today, November 2011, page 38 .) At the moon’s south pole, four parallel cracks, dubbed “tiger stripes,” appear anomalously warm in IR images, and they spew jets of salty ice and water vapor into space. Taken together, those signs point to a liquid water ocean, similar to the one on Jupiter’s moon Europa, beneath the moon’s frozen outer shell and in contact with its rocky core. Enceladus is thus on the short list of the best places in the solar system to look for extraterrestrial life.
Now Alice Le Gall (LATMOS/University of Versailles–Saint Quentin in Yvelines, France) and her collaborators have found that the Enceladean ocean may be closer to the surface than previously thought. 1 Instead of tens of kilometers, the south polar ice could be just 2 km thick. That’s thin enough that on a hypothetical future mission, ground-penetrating radar could see right through the ice—or a lander could penetrate the crust and reach the ocean.
Thin ice
The conclusion is based on data from Cassini’s radar. Developed primarily to image the moon Titan by sending microwave pulses through its optically opaque atmosphere, the radar can also passively detect thermal radiation at a wavelength of 2.2 cm. The longer wavelength means that radar is sensitive to lower temperatures and greater depths than IR detectors are.
Cassini’s radar and IR instruments can’t operate simultaneously; the latter usually took priority during flybys of Enceladus, so the researchers had little passive radar data from the south polar region to work with. In fact, their new results are based on just a minute and a half of data collected during a single flyby. The results of that observation, shown as the colored arc in the

Enceladus’s south polar terrain as imaged by Cassini. At the center of the image are cracks known as tiger stripes that appear anomalously warm in IR heat maps. The colored band shows surface-brightness temperatures measured by Cassini’s radar; the data reveal that the heat source is broadly distributed across the south pole terrain. Each of the hottest spots, shown in red, is centered on a feature that’s structurally similar to the tiger stripes, including the crack between the white dashed lines in the inset. (Adapted from ref.
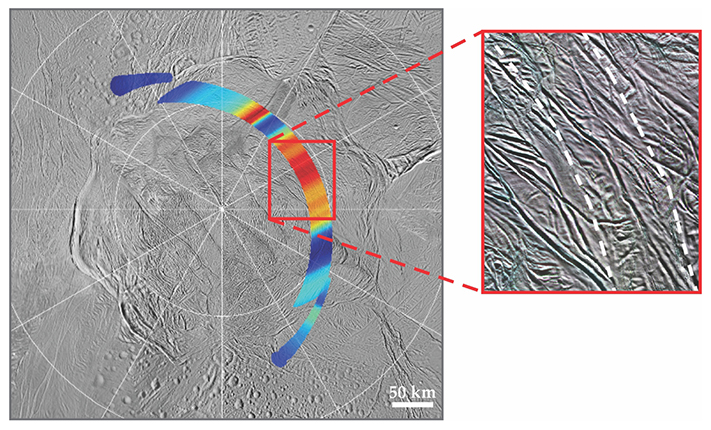
The colors represent the measured surface-brightness temperature, which depends on both the surface emissivity and the physical temperature averaged over the near-surface depths from which radiation can escape. The average emission depth is typically between 10 and 100 times the measurement wavelength, or up to a few meters for Cassini’s microwave measurements. The exact relationship of the surface-brightness temperature to the physical temperature depends on the scattering properties of Enceladean crustal ice, which are known only roughly. The researchers analyzed the data under several different assumptions; in each case, the region they observed was considerably warmer than expected.
Enceladus, like Europa, is heated by tidal deformations from the gravity of the planet that it orbits. Because Enceladus is so small (just 500 km across, compared with Europa’s 3100 km), details matter: A thin ice crust deforms more than a thick one, so it generates more heat. Furthermore, tidal friction is concentrated where the crust is cracked. From the jets of ice and vapor that erupt from them, the tiger stripes are known to be cracks. Each of the hottest spots in the radar data is centered on a feature that looks structurally similar to the tiger stripes; one such crack is shown in the
When Le Gall and company modeled the tidal-heating process to account for their observations, they found that the crust should be around 2 km thick in the area of the tiger stripes. The crust is probably thicker elsewhere, including in the region of the radar observations. An uneven crustal thickness could explain both why the new hot spots aren’t the source of jets and why they don’t show up in IR images: The liquid water and frictional heat are buried too deeply to make their way to the surface.
What lies beneath
The radar data were collected during Cassini’s 16th flyby of Enceladus, in November 2011. The researchers noticed the thermal anomalies immediately, and Le Gall presented preliminary results at a workshop in 2012. “But some people would not believe it,” she says, “because at that time it was commonly understood that the ocean was tens of kilometers below the surface.” So they held off on publishing the results until they’d refined the instrument’s calibration 2 based on their observations of Titan from 2004 through 2014.
In the intervening years, other results emerged to make the thin-ice picture seem more feasible. For example, an analysis of Enceladus’s libration—how much its surface wobbles under Saturn’s gravity—revealed that the subsurface ocean must be global, with the icy crust decoupled from the rocky core. (See Physics Today, December 2015, page 25 .) Previously, it had seemed feasible that the ocean might exist only in the south polar region beneath the tiger stripes.
A thin, active Enceladean crust doesn’t just mean that the ocean will be easier to study, Le Gall explains: “It also increases the probability that there’s life in the ocean.” Life as we know it requires both liquid water and the right chemical building blocks. (See the article by Charles Cockell, Physics Today, March 2017, page 42 .) Cassini’s mass spectrometer has detected molecular hydrogen in the vapor plumes that erupt from the tiger stripes; H2 must therefore also exist in the subsurface ocean, where it could help to power a primitive metabolic pathway. 3 Organic material could be delivered to Enceladus’s surface by comets and asteroids, but it still must make its way to the liquid ocean. The thinner and more cracked the crust, the more likely that is.
The question of habitability is not the only unsolved mystery about Enceladus. Researchers are also particularly curious about how the moon acquired its ocean in the first place. A liquid ocean requires tidal heating, which requires a crust that’s thin enough to deform. Enceladus could just as easily have remained frozen solid, as its neighboring moon Mimas shows: Mimas is similar in size to Enceladus and closer to Saturn, but it shows no signs of geological activity.
Cassini’s mission, originally scheduled to last until 2008, has been extended twice. But now the orbiter is running out of fuel, and its mission must end in September of this year: It will plunge into Saturn’s atmosphere to avoid contaminating any of the moons with terrestrial material. It will make no more visits to Enceladus during its remaining time. Further insight into the moon’s secrets will have to wait until the next mission to Saturn. No such mission is yet in the works, although several have been proposed, including the Enceladus Life Finder, which would look for possible biomolecules in the icy jets.
References
1. A. Le Gall et al., Nat. Astron. 1, 0063 (2017). https://doi.org/10.1038/s41550-017-0063
2. M. A. Janssen et al., Icarus 270, 443 (2016). https://doi.org/10.1016/j.icarus.2015.09.027
3. J. H. Waite et al., Science 356, 155 (2017). https://doi.org/10.1126/science.aai8703
More about the authors
Johanna L. Miller, jmiller@aip.org


