Quantum oscillations finally seen in high-temperature superconductors
DOI: 10.1063/1.2761791
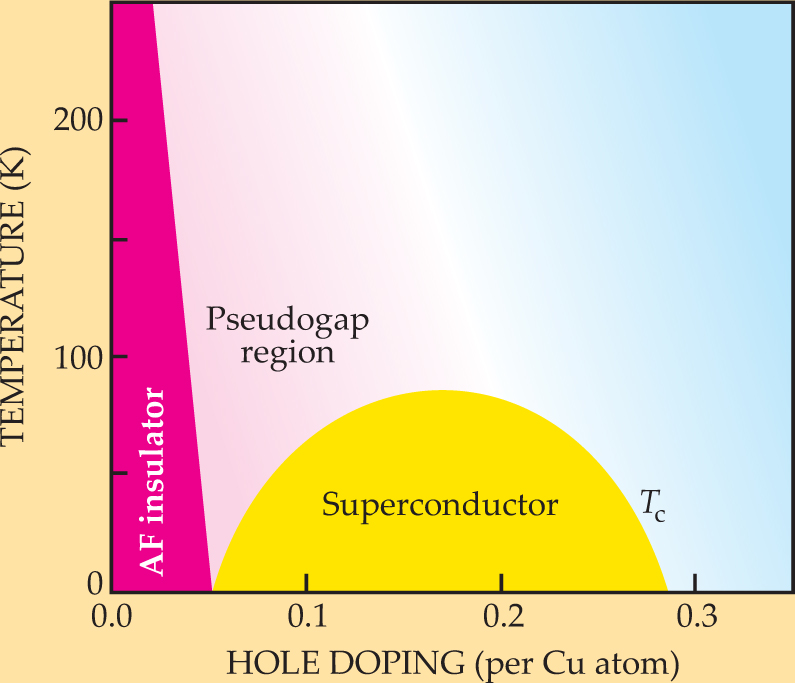
In the 20 years since the discovery of high-temperature superconductivity in a class of copper-oxide materials, the search for the mechanism underlying this phenomenon has extended beyond the superconducting region itself. Before they are doped to become superconductors, the cuprates are antiferromagnetic insulators, as shown in the phase diagram of figure 1. Researchers have wondered how the material transitions to a robust superconductor as dopants are added and what type of state is reached when the material is overdoped.

Figure 1. Phase diagram for high-temperature superconductors in the plane of temperature and doping level. The parent compound is an antiferromagnetic insulator (hot pink area). As doping and temperature increase, the material enters a “pseudogap” phase (light pink shading). At still higher doping, the material is superconducting below a temperature T c (yellow). The overdoped region is shaded in blue.
(Adapted from ref. 3.)
A useful way to characterize the electronic states in the underdoped and overdoped regions surrounding the superconducting dome (yellow region in figure 1) is to map out their Fermi surfaces. As the boundary in momentum, or reciprocal (k), space between filled and empty energy levels, the Fermi surface is a key determinant of a material’s physical behavior, such as the temperature dependence of the material’s electrical resistivity. Alas, when experimenters in the 1990s tried to use two methods—the de Haas–van Alphen (dHvA) and Shubnikov–de Haas (SdH) effects—that had successfully probed the Fermi surfaces of numerous metals, they failed to get convincing results.
In the absence of the standard tools, practitioners of angle-resolved photoemission spectroscopy (ARPES) have stepped in to fill the vacuum. They have adapted ARPES to map the Fermi surface, and over the years they have progressively improved its resolution.
The ARPES studies have revealed the underdoped cuprates to be especially mysterious. Measurements have found that well-defined quasiparticles, or excitations, only seem to exist along disconnected arcs in two-dimensional k space, rather than on continuous Fermi surfaces. 1,2 (In the layered copper-oxide superconductors, most of the conduction occurs in the 2D planes of copper and oxygen atoms. Thus the most relevant part of the Fermi surface is the corresponding 2D plane in k space.) The observations of Fermi arcs have raised lots of questions about what they could mean.
New insight into this region has now come from a familiar tool: After five years of work, a group headed by Louis Taillefer of the University of Sherbrooke in Canada and Cyril Proust at the National Pulsed Magnetic Field Laboratory in Toulouse, France, has succeeded in seeing the signature characteristics of the SdH effect: quantum oscillations in the resistance as a function of an applied magnetic field. 3
The measurements were made last March in Toulouse by Taillefer’s postdoc Nicolas Doiron-Leyraud and graduate students David LeBoeuf and Jean-Baptiste Bonnemaison, working with Proust and his student Julien Levallois. The researchers needed the extremely high field available in Toulouse to suppress superconductivity and boost the oscillation amplitude. Equally essential were the exceptionally clean and ordered crystals provided by Ruixing Liang, Douglas Bonn, and Walter Hardy of the University of British Columbia. The crystal growth was an outcome of a long-term materials development program sponsored by the Canadian Institute for Advanced Research.
The experiment has created quite a buzz in the community of researchers studying the cuprates. At first glance, the data appear to conflict with the results from ARPES studies: Rather than finding disconnected Fermi-surface arcs, the observation of SdH oscillations clearly suggests that the Fermi surface consists of small closed areas, or pockets. Perhaps there are ways to reconcile the two results. But perhaps ARPES and the high-field oscillations are not measuring the same state: ARPES measurements probe the surface of a material and are done at zero magnetic field and relatively high temperatures, whereas the new SdH measurements were sensitive to the entire crystal and were done at extremely high magnetic field and very low temperatures. Furthermore, the two sets of measurements were not done on the same materials.
“It is too early for a definitive judgment on the full significance of this experiment for understanding high-T c superconductivity,” comments Andrew Mackenzie of the University of St. Andrews in Scotland, “but a key channel of investigation has been opened.” In 2003, Nigel Hussey, Mackenzie, and coworkers used another type of transport measurement—polar angular magnetoresistance oscillations (AMRO)— to determine the Fermi surface of cuprates, but were successful only in the overdoped region. 4
Magnetic oscillations
The periodic behavior seen in the SdH effect, and in its cousin, the dHvA effect, stems from the quantized nature of the Landau energy levels of electrons in a magnetic field. In the applied field, electrons execute cyclotron orbits about the flux lines. The energy of each quantum level is proportional to the cyclotron frequency, which in turn is proportional to the magnetic field B. As one raises the field, Landau energy levels successively pass through the Fermi energy, causing an oscillation in the density of states.
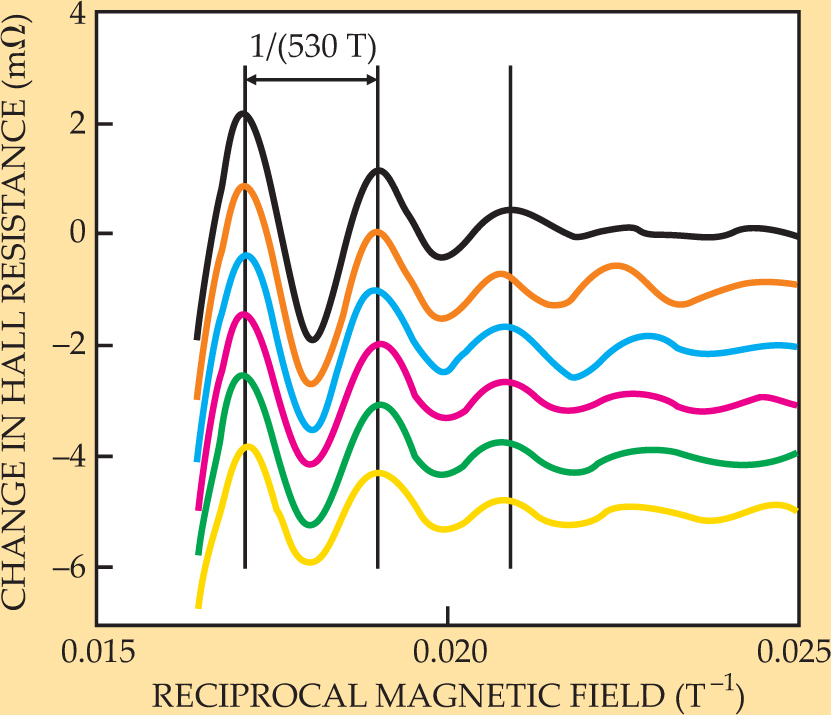
The oscillation in the density of states is reflected in a variety of properties. In the dHvA effect, that property is the magnetization; in the SdH effect, it is the resistance. The resistance oscillations measured in the SdH experiment are periodic in the reciprocal magnetic field, 1/B, as seen in figure 2. Seeing such sharp oscillations requires a material in which the charge carriers have a long enough mean free path to execute a complete cyclotron orbit. As the magnetic field gets larger, the orbit becomes smaller, and the mean-free-path required to get oscillations can be shorter. Thus, Taillefer and coworkers needed an exceptionally clean crystal, performed their experiment at low temperatures, and applied magnetic fields as high as 62 tesla.

Figure 2. Hall resistance oscillations show up clearly when the background is subtracted and data are plotted as a function of reciprocal magnetic field, 1/B. Different curves represent temperatures ranging from 1.5 K (black) to 4.2 K (gold). The oscillations have a period of 1/(530 tesla).
(Adapted from ref. 3.)
Those fields are larger than are needed to kill superconductivity, but they are not sufficient to suppress Cooper pairing of the electrons, as experiments by N. Phuan Ong and his colleagues have shown. 5 The pairs form a type of vortex liquid rather than a normal state. Nevertheless, the vortex liquid would still exhibit the same type of oscillations as the regular SdH effect.
The Sherbrooke-UBC-Toulouse researchers used yttrium barium copper oxide (YBCO) crystals, which are known to have chains of alternating oxygen and copper atoms running in one direction. To rule out any possible bias introduced by the chains, the experimenters measured the oscillations in two orthogonal current directions and found identical results.
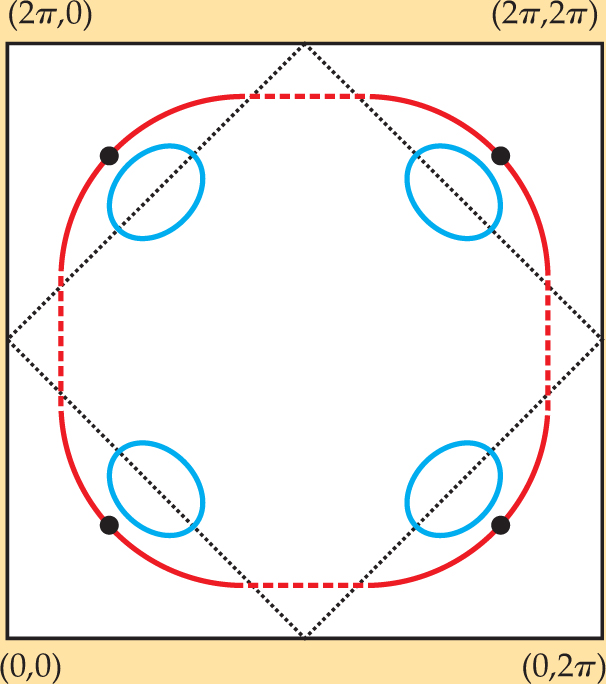
The oscillation “frequency” F (having units of magnetic field) can be related to the Fermi surface area by the Onsager relation, F = (Φ0/2π2) Ak , where Φ0 is the flux quantum and Ak is the area of the Fermi surface normal to the magnetic field. The Sherbrooke-UBC-Toulouse experiment finds that Ak is very small—just 3% of the Fermi surface area for overdoped cuprates measured by ARPES 6 and by AMRO. 4 The Fermi surface in the overdoped region, sketched in figure 3 as a red, roughly circular curve denoted by solid and dashed lines, is similar to what one might expect for a conventional metal.

Figure 3. Surfaces, arcs, and pockets. The solid/dashed red curve represents the Fermi arc of an overdoped cuprate plotted in k space. In the pseudogap region, such a surface develops gaps, leaving only disconnected arcs (solid red). Quantum oscillations imply that the Fermi surface consists of a small closed orbit or pocket—or possibly two or four such pockets. The blue ellipses represent one possible scenario for the number, location, and shape of the pockets.
(Adapted from ref. 8.)
The large Fermi surface area shows that a large number of electrons are available as charge carriers in the overdoped region. The small area observed in the SdH measurements in the underdoped region poses quite a challenge. It revives an old debate over the size of the Fermi surface there.
Provocative results
The underdoped region is intriguing because of the development of a “pseudogap” there. This pseudogap is seen by ARPES and other measurements as a precipitous drop in the density of states at and just below the Fermi energy. This gap in density of states is not a true superconducting gap because in superconductors, the density of states drops all the way to zero at the Fermi surface as the electrons lower their energy by pairing. The pseudogap region (shaded pink in figure 1) extends from T c to some higher temperature T* that is larger at lower doping.
ARPES finds that a pseudogap develops in only part of the Fermi surface, leaving arclike sections that are ungapped. Such Fermi arcs are represented in figure 3 by the solid red sections. The length of the arcs decreases as the temperature is lowered toward T c. One experiment extrapolated the arcs to single nodal points at zero temperature, 1 but that finding has not yet been verified by other data. (The nodal points are indicated by black dots in figure 3.)
Z. X. Shen of Stanford University comments that the Fermi arcs might result from the gapping of a large Fermi surface. Alternatively, the arcs might be one half of a small Fermi pocket if the other half produces too weak a signal to be detected by ARPES. 7
It’s hard to compare the Fermi arcs to the closed pockets inferred from the SdH experiments because the SdH data determine only the surface area; they say nothing about the location in k space or about the shape. It’s not even clear how many pockets there are. Because of electron correlations or the possible onset of some order with broken symmetry, there may be two or four pockets rather than just one. For illustrative purposes only, figure 3 shows one possible configuration of four slightly elliptical pockets located at four symmetric points in k space.
So far there is just speculation about how the apparently open-ended arcs might be reconciled with the closed loops, or pockets, predicted by the SdH oscillations. One possibility is that the Fermi-surface arcs define just one side of elliptical pockets detected in the SdH experiment, leaving the other side undiscovered by ARPES. Another possibility is that the blue pockets might encircle each arc in skinny, banana-shaped trajectories; ARPES might not be able to distinguish such narrow closed loops from arcs.
The region of low temperature, low doping, and high field probed by the SdH experiment is surely in the pseudogap phase and not in any conceivable normal state, remarked Philip Anderson of Princeton University. The small area implied by the experiments may well find its explanation, he says, in the type of quasiparticles one might find near the nodal regions under these conditions.
The nature of the Fermi arcs touches on the debate over what the pseudogap really is and how it relates to the underlying superconductivity. Some researchers contend that the pseudogap stems from the onset of some order other than superconductivity, which opens a gap that’s inherently different from the superconducting gap seen below T c. Others see the pseudogap as arising naturally from the strong electron interactions that give rise to superconductivity: In the superconducting region below T c, the Fermi surface is gapped at all points in k space except for four nodal points. In this second view-point, those nodes would expand into arcs as the temperature rises above T c.
Other questions raised by the new experiment concern the density of the charge carriers. A well established theorem proposed by Joaquin Luttinger in 1960 relates the charge carrier density n to the volume enclosed by the Fermi surface. Luttinger’s theorem in two dimensions (consistent with the quasi-2D nature of the YBCO crystals) says that n = 2Ak /(2π)2. Using this formula, Taillefer and his colleagues got n = 0.038 carriers per Cu atom, much less than the 0.1 holes per Cu atom that were doped into their crystal. If there are two pockets, the number of carriers rises to 0.076. With four pockets, the number is 0.15. In any case the doping level disagrees with the charge carriers determined by Luttinger’s theorem.
The question of charge carriers relates back to the size of the Fermi surface. As Patrick Lee of MIT explains it, when you dope a Mott insulator with x holes (x = 0.1 in the SdH experiment), you have two possibilities. If you count only the holes as charge carriers, you will get a small Fermi surface. If you count electrons (1 − x), you get a large surface.
If the overdoped region has a large Fermi surface, with large numbers of charge carriers, how does the system evolve smoothly to the underdoped region, where the number of charge carriers is small? Or does one approach the underdoped region from the other side, starting from the undoped parent compound, a Mott insulator that as an insulator has no Fermi surface at all?
The aspect of the recent experiment that most struck Mohit Randeria of the Ohio State University is the existence of sharp—that is, long-lived—quasiparticles. One would not see magnetic oscillations if the quasiparticles were not sharp. As Randeria notes, no evidence for such sharp quasiparticles has been see in ARPES studies of the underdoped region.
References
1. A. Kanigel et al., Nat. Phys. 2, 447 (2006). https://doi.org/10.1038/nphys334
2. K. Tanaka et al., Science 314, 1910 (2006). https://doi.org/10.1126/science.1133411
3. N. Doiron-Leyraud et al., Nature 447, 565 (2007). https://doi.org/10.1038/nature05872
4. N. E. Hussey et al., Nature 425, 814 (2003). https://doi.org/10.1038/nature01981
5. L. Li et al., J. Magn. Magn. Mater. 310, 460 (2007). https://doi.org/10.1016/j.jmmm.2006.10.535
6. M. Platé et al., Phys. Rev. Lett. 95, 077001 (2005). https://doi.org/10.1103/PhysRevLett.95.077001
7. D. S. Marshall et al., Phys. Rev. Lett. 76, 4841 (1996). https://doi.org/10.1103/PhysRevLett.76.4841
8. S. R. Julian, M. R. Norman, Nature 447, 537 (2007). https://doi.org/10.1038/447537a


