Photoacoustic imaging beats the diffraction limit
DOI: 10.1063/PT.3.3807
In 1880 Alexander Graham Bell discovered that shining light on an elastic material elicits sound from it. His discovery, known as the photoacoustic effect, has today matured into a sensitive medical imaging technique: The absorption of visible or near-IR light pulses by molecules under the skin increases their temperature and launches a pressure wave that propagates back to the surface as ultrasound, which is picked up by an array of microphones. (See the article by Stanislav Y. Emelianov, Pai-Chi Li, and Matthew O’Donnell, Physics Today, May 2009, page 34 .)
Although the photons can be focused only through a millimeter or so of soft tissue, they penetrate far more deeply—up to a few centimeters—diffusing as they scatter countless times. The photons lose their spatial memory during so deep a random walk, but the local conversion of their energy into acoustic waves restores it. The mean free path of ultrasound in the tissue is on the scale of meters, which makes it straightforward to reconstruct a two-dimensional image of absorptive molecules at a particular depth by essentially triangulating from a 1D microphone array to the acoustic source. The rub is that the resolution of a photoacoustic image is diffraction-limited by the acoustic wavelength, which is at best an order of magnitude longer than the optical diffraction limit.
Researchers led by Ori Katz (Hebrew University of Jerusalem) and Emmanuel Bossy (Université Grenoble Alpes in France) have now demonstrated how to improve that resolution beyond the diffraction limit of acoustic waves.
1
The trick was to adapt an existing mathematical technique known as superresolution optical fluctuation imaging (SOFI) to photoacoustics.
2
In essence, SOFI reconstructs a map of a region by statistically analyzing, pixel by pixel, hundreds to tens of thousands of diffraction-limited snapshots of it. So long as the absorptive features fluctuate in an uncorrelated fashion over time, reconstructions of the pixels’ variance—the square of the standard deviation from the mean of their intensities—increase the resolution by a factor of
The SOFI-inspired technique isn’t the only way to break the acoustic diffraction limit. In 2015 Mickael Tanter and his colleagues at the Langevin Institute in Paris breached it using the related method of superresolution ultrasound imaging, 3 whose contrast arises from mechanical and elastic properties instead of optical absorptive properties, as is the case with photoacoustics. By injecting microbubbles into the bloodstream of a rat’s brain and localizing their positions as the bubbles move or disintegrate, they imaged the blood vessels with 10 µm resolution (see Physics Today, February 2016, page 14 ).
Blood makes for an alluring target because several diseases that disrupt circulation could potentially be diagnosed using a method that can resolve individual vessels. A key advantage of the new photoacoustic technique is that it can image blood cells directly—no externally injected contrast agents required.
From speckle to flow
Acoustic waves obey the same propagation equation as optical waves, and the adaptation of SOFI to photoacoustics was straightforward. As originally developed, SOFI relies on the random blinking on and off of molecules in fluorescence microscopy. Two years ago, Katz, Bossy, and their colleagues realized they could mimic that behavior in a photoacoustic setting. 4 To create the temporal fluctuations, the researchers placed a rotating diffuser in front of a pulsed laser beam to produce a speckle pattern that randomly changed with each pulse. The photoacoustic intensities induced by the speckled light pulses at each image pixel in a sample of absorptive beads—a convenient proxy for soft tissue—thus changed as well and were ripe for SOFI’s statistical analysis.
At depths greater than a millimeter, though, the speckle grain sizes were on the scale of a micron, two orders of magnitude smaller than the acoustic wavelength for a typical frequency of 15 MHz. The mismatch in sizes produced fluctuations whose amplitudes were tiny compared with the mean signal. Consequently, resolving those fluctuations was difficult.
The researchers have now overcome that hurdle. 1 They realized they could dispense with laser speckle and instead exploit the natural internal motion of a body’s absorbers to produce the required fluctuations. Red blood cells, which are fast moving and absorb strongly in the visible, turn out to be a nearly ideal target.
To test the expected resolution enhancement, they first ran a computer simulation of the photoacoustic response from a microvascular network coursing with absorbers. The vessels were 15–40 µm wide, and each absorber had a diameter of 10 µm, close to that of a real red blood cell. Figure
Figure 1.

Superresolution photoacoustic imaging. In a computer simulation of a complex microvasculature structure filled with randomly moving light-absorbing particles, researchers took 50 000 photoacoustic snapshots of the structure and reconstructed it, pixel by pixel. Shown here are (a) the mean of the acoustic intensity; (b) the variance—that is, the second-order moment or square of the standard deviation of random fluctuations between images; and (c,d) higher-order moments. The increase in resolution scales as the square root of the order number. (e) Green and blue curves plot the cross sections of absorption-intensity maps in panels b and d. The dashed curve shows the locations of the simulated vessels. (Adapted from ref.
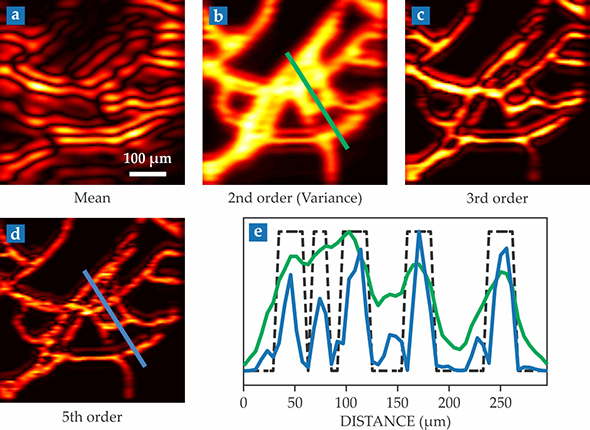
Nonetheless, using a conventional SOFI analysis, even high-order images have ghost artifacts that look like shadows of the vessels. Unlike fluorescence, light-induced acoustic waves are coherent, and the shadows are the waves’ interference fringes at the array of transducers. To eliminate such artifacts, the researchers’ calculations had to incorporate both the phase and amplitude of the detected signals.
Microfluidic blood
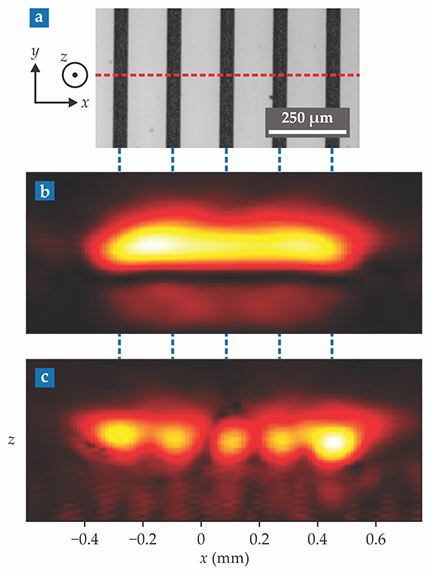
As a further test, Katz, Bossy, and company imaged real blood streaming through a series of microfluidic channels, each separated by 180 µm, as shown in figure
Figure 2.

Microfluidic blood. (a) A series of parallel microfluidic channels are filled with flowing red blood cells. Some 15 000 photoacoustic snapshots were taken of a cross section (dashed red line) of the channels. (b) The mean of all those snapshots corresponds to an averaged, diffraction-limited image. (c) Sixth-order statistical processing of the snapshots resolves the blood passing through the plane. (Adapted from ref.
It’s an “inspiring demonstration,” says Caltech’s Lihong Wang, a researcher unaffiliated with the work. But both he and Katz are quick to point out that extending the statistical imaging method from simple microchannels to real in vivo vasculature presents daunting complexities. For one thing, blood isn’t the only thing that moves in a living body. So do surrounding tissues as the heart pumps and lungs expand and contract. The extraneous movement generates an unwanted background signal. For another thing, blood can clot, and vessels vary in diameter, which changes the local flow rate.
What’s more, it currently takes tens of seconds to snap the thousands of pictures required to implement SOFI-adapted photoacoustics imaging. That duration limits the applicability of the technique to resolving structures, such as capillaries, rather than their dynamics. Nonetheless, if the complications and limitations can be overcome, even the modest gain in resolution—nearly a factor of 2.5 for a sixth-order analysis—may be worth the effort. Angiogenesis, the formation of networks of new capillaries to feed a growing tumor, occurs over weeks to months and is diagnostic of some cancers.
References
1. T. Chaigne et al., Optica 4, 1397 (2017). https://doi.org/10.1364/OPTICA.4.001397
2. T. Dertinger et al., Proc. Natl. Acad. Sci. USA 106, 22287 (2009). https://doi.org/10.1073/pnas.0907866106
3. C. Errico et al., Nature 527, 499 (2015). https://doi.org/10.1038/nature16066
4. T. Chaigne et al., Optica 3, 54 (2016). https://doi.org/10.1364/OPTICA.3.000054


