Nuclear magnetic resonance takes a reaction’s temperature
DOI: 10.1063/PT.3.2231
Industrial catalysis is typically done by flowing gaseous or liquid reactants over a solid catalyst. Because the catalyst is often packed into a chamber in the form of wire mesh, microscopic particles, or some other structured solid with a high surface-to-volume ratio, such reactions tend to be extremely complex—full of hot and cold spots that can affect conversion efficiency. So engineers strive to probe the thermodynamics of the reactions in situ to better model their kinetics and optimize reactor design.
In large systems, a few well-placed thermocouples might suffice. But in laboratory-scale systems, such as microreactors or lab-on-a-chip devices, it’s often impossible to probe the temperature without disrupting the flow and thereby the reaction itself.
Optical techniques, though noninvasive, don’t work when the reactants or the chamber enclosing them are opaque. Nuclear magnetic resonance thermometry is similarly noninvasive but often requires contrast agents that may interfere with a reaction. Traditional approaches using NMR can also lose accuracy in complicated environments. The weak dependence of the resonance frequency of water protons on temperature (3 Hz/K) has made it a widely used thermometer for decades in cases where linewidths in NMR spectra are sharp and the shifts in frequency unambiguous. But place a mouse, for instance, in an NMR magnet and the combination of blood flow, heat, and susceptibility gradients in its tissues produces local variations in the magnetic field that broaden the lines and may mask the small temperature-revealing shifts in proton frequency. A catalyst-packed reactor can exhibit the same kind of variations in the field.
This past year UCLA’s Louis Bouchard realized that the linewidth itself could serve as a thermometer in gas-phase NMR. He and his colleagues have now developed a thermal mapping technique that exploits the motional averaging experienced by gases at different temperatures when a weak but uniform magnetic field gradient is applied across the reaction. 1
Once the reaction chamber is placed in the NMR magnet, the researchers apply a broadband RF pulse to tip the spins of hydrogen nuclei and then apply the gradient, during which they record the signal as the spins precess and lose coherence. Relatively cold molecules diffuse little in a given time, so their spins in different regions of the reactor feel different fields and precess with a range of resonant frequencies; the result is a broad NMR line. Warmer molecules, which cover more ground and sample the spatially varying magnetic field more broadly, have a smaller spread in resonant frequencies and hence a narrower collective linewidth.
It’s no surprise that when random molecular motion causes nuclear spins to experience more averaging, the NMR signal remains coherent longer and its peaks narrow. Nicolaas Bloembergen, Edward Purcell, and Robert Pound described such effects as early as 1948. But the UCLA group’s use of an external gradient for thermometry is new.
From principle to practice
The stronger the magnetic gradient, the more sensitive the linewidth’s temperature dependence, a feature that makes the new thermometer tunable. But Bouchard and company discovered that even a gradient as small as 1 mT/m is enough to overwhelm, by roughly an order of magnitude, any residual contribution to a signal’s linewidth from susceptibility gradients or other inhomogeneities inside a reaction chamber filled with catalytic metal nanoparticles. That’s fortunate, since so small a gradient does not usually interfere with the chemical shifts in NMR peaks that occur during the progression of a reaction as hydrogen-bonding configurations change.
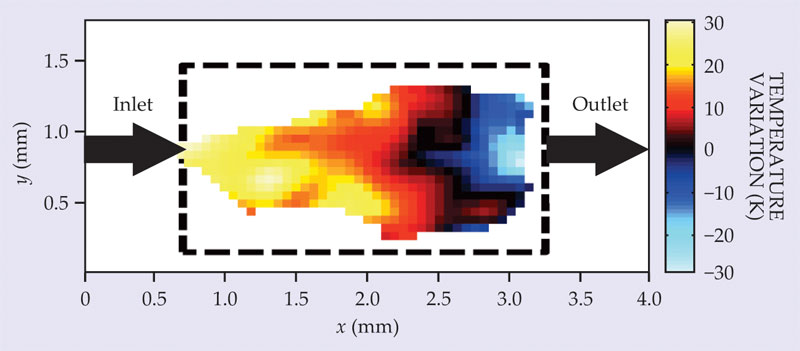
To spatially resolve the temperatures, the researchers turned to standard phase-encoding schemes from magnetic resonance imaging (see Physics Today, December 2003, page 24 ). Those techniques enabled them to map the linewidth-based temperatures into a three-dimensional matrix of voxels whose size sets the resolution. As proof of principle, they measured the thermal variations during the reaction of molecular hydrogen and propylene gas flowing through a small glass tube packed with platinum or palladium nanoparticles. The 2D map shown in the figure—which plots the extracted temperatures averaged over the third dimension and was made from a trial using platinum catalysts—was accurate to within 4% of the absolute temperature and had a spatial resolution of about 100 µm × 100 µm in plane.

A thermal map of gases in the catalyzed conversion of propylene into propane. The inflowing gas and the reactor were held at about 418 K, and the variations about that temperature were extracted from differences in the linewidth of a hydrogen nuclear magnetic resonance signal in different parts of the reactor.
The naturally low spin density of gas presents a challenge when the size of a voxel is reduced to submillimeter volumes. Even at room temperature, only about one spin in 105 aligns with a 10 T field because the energy difference between spin-up and spin-down hydrogen protons is a tiny fraction of the thermal energy. When temperatures get higher, as they often do in catalytic reactions, the vast majority of spins cancel each other out and the NMR signal from the small net magnetization can be faint.
To obtain the high spatial resolution, the researchers enriched their reactant gas mixture with parahydrogen, the singlet-state spin isomer of molecular hydrogen. The enhanced magnetization boosted the NMR signal by some four orders of magnitude and reduced the integration times needed to obtain good signal-to-noise ratios. 2 The map shown in the figure took just 30 minutes to make.
Curiously, the presence of precious metal in the chamber doesn’t appear to attenuate the RF field because the metal, dispersed as nanoparticles, is far smaller than the skin depth at 400 MHz. “Engineers suddenly have a method for peering inside a working engine—particularly one enclosed by ceramic. A thick metal block is likely to remain impenetrable by the RF field, but if the field frequency is low enough [below 10 kHz or so], the new method should work even through a thin metal shell,” says RWTH Aachen University chemist Bernhard Blümich.
The UCLA team plans to take the method far beyond temperature maps. Temperatures come from linewidths, but each voxel measurement also contains the spectroscopic fingerprints of the reaction’s chemistry in the frequencies and amplitudes of the NMR peaks. Engineers might be interested in the amount of reactant consumed at different times and temperatures or its conversion rate at, for instance, different points in space, explains Bouchard. “Scientists who study catalytic reactions want their full thermodynamics: spatially resolved chemical potentials, pressure, temperature, the flow of energy … everything in one experiment.”
References
1. N. N. Jarenwattananon et al., Nature 502, 537 (2013). https://doi.org/10.1038/nature12568
2. L.-S. Bouchard et al., Science 319, 442 (2008).https://doi.org/10.1126/science.1151787


