Neural-network model may explain the surprisingly good infrared vision of snakes
DOI: 10.1063/1.2364228
Neural networks have become a fertile meeting ground for biologists, physicists, and computer scientists. Studies of surprisingly skilled animal behavior have challenged physicists to explain sensory capabilities that seem to exceed the physical limitations of sense organs and neural interactions. For example, a barn owl at night deduces the direction to an unsuspecting mouse by perceiving the interaural arrival-time difference of its rustling with microsecond accuracy (see Physics Today, June 2001, page 20 ). But how can that be when the characteristic time of an individual neuronal process is 100 times slower?
A new paper in Physical Review Letters by biophysicist Leo van Hemmen and colleagues at the Technical University of Munich proposes a neural-network model that addresses a similar problem raised by the spatial acuity of infrared imaging by certain kinds of snakes. 1 Ten years ago, van Hemmen’s group, which specializes in the theory of biosensory systems and neural information processing, offered a solution to the barn-owl paradox. 2 The new paper deals with pit vipers and boids, two families of snakes (encompassing rattlesnakes and boa constrictors) that employ pit organs near their eyes as rudimentary infrared imaging devices (see figure 1).

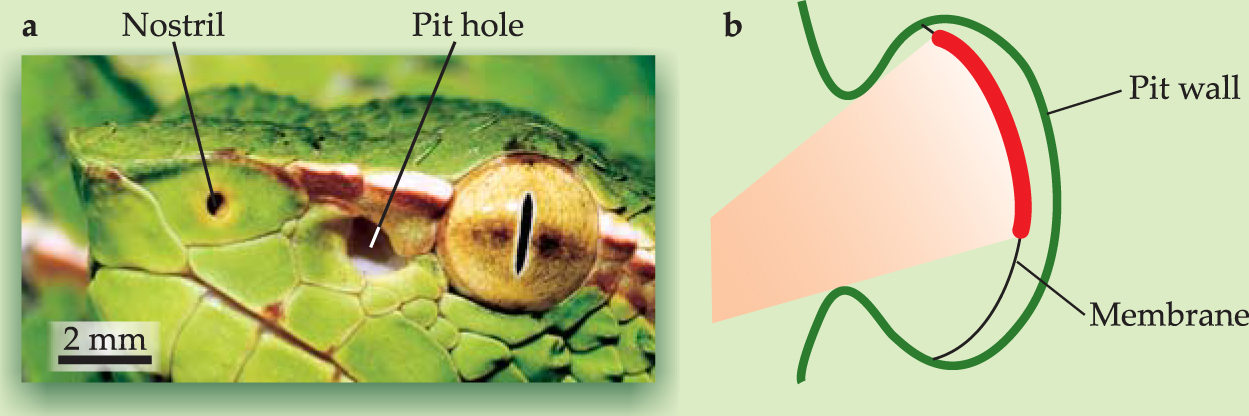
Figure 1. (a) Profile of a temple viper’s head shows the aperture of the snake’s left pit organ just in front of its left eye. The organ, shown in schematic cross section (b), is effectively an infrared pinhole camera for night hunting. But because the aperture is about as wide as the organ is deep, IR images on the temperature-sensitive membrane are extremely blurry.
(Adapted from ref. 1.)
A poor pinhole camera
The pit organ is effectively a pinhole IR camera with a temperature-sensitive membrane suspended near its back. Pinhole cameras can produce sharp images without a lens, but only if the aperture’s diameter is much smaller than its distance from the imaging surface. That’s clearly not the case for these snakes, in which the two are about the same size. Why, then, is the aperture so big? The aperture size was probably an evolutionary tradeoff between image sharpness and radiant flux—as it is in photography.
For the temple viper of figure 1, a Southeast Asian species that can grow to be a meter long, both the aperture diameter and pit depth are about 2 mm. The resulting thermal image on the membrane from even a point IR source; is just a big blur. Van Hemmen and company considered how a snake could possibly use such poorly focused IR input to find its prey in darkness with a surprising angular precision of 5°.
Because the pit aperture is much larger than the IR wavelengths that dominate thermal radiation from a warm-blooded prospective victim, diffractive effects play almost no role. It’s all geometric optics. The IR-sensing membrane, insulated from the pit’s back wall by the organ’s inner cavity, is studded with a few thousand sensor cells sensitive to millikelvin temperature differences. The membrane subtends a field of view through the pit aperture of about 100°.
For its idealized model of the snake’s IR imaging process, the Munich group used a conservative estimate of 40 × 40 sensor cells arrayed on the membrane. The 2.5° angular-resolution limit imposed by this rather coarse sensor spacing would not preclude the snake’s demonstrated 5° acuity. But the large pit aperture condemns each sensor cell to receive IR input from all over the surface of a warm animal in its field of view. Can the resulting blur on the membrane be turned into a usably sharp image in the snake’s brain by biologically plausible neural circuitry? That’s the question the biophysical computer model was meant to address.
A virtual lens
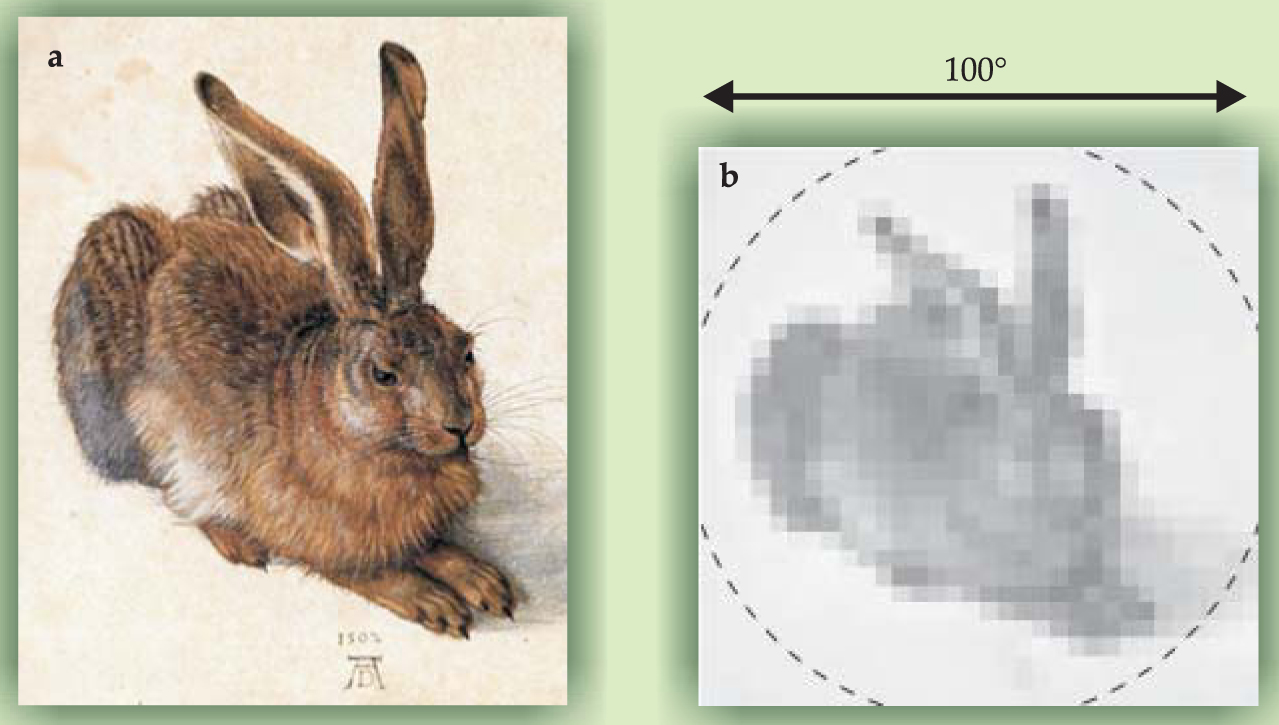
“To start with something familiar, we filled the model pit organ’s field of view with Albrecht Dürer’s famous painting of a hare,” says van Hemmen. “Ours is a pixelized image approximating such a creature’s surface-temperature distribution” (see figure 2).

Figure 2. (a) Albrecht Dürer’s 1502 painting of a hare. (b) A pixelized version of the painting with an eight-level gray scale intended to represent the hare’s surface temperature. In a computer model, this IR source image was presented to an idealized snake pit organ. The dashed circle indicates the organ’s 100° field of view.
(Adapted from ref. 1.)
To address the snake’s IR imaging technique, the group used an idealized linear formalism. The vector S represents the hare’s thoroughly indistinct thermal image on the pit membrane, simulated in figure 3(a), whose component S α is the temperature signal at the αth sensor cell. (A single vector index suffices even though the sensor array is two-dimensional.) The final, presumably much sharper image in the brain is represented by the corresponding vector I whose component I β represents the brain’s perception of the βth pixel of the hare’s thermal image.

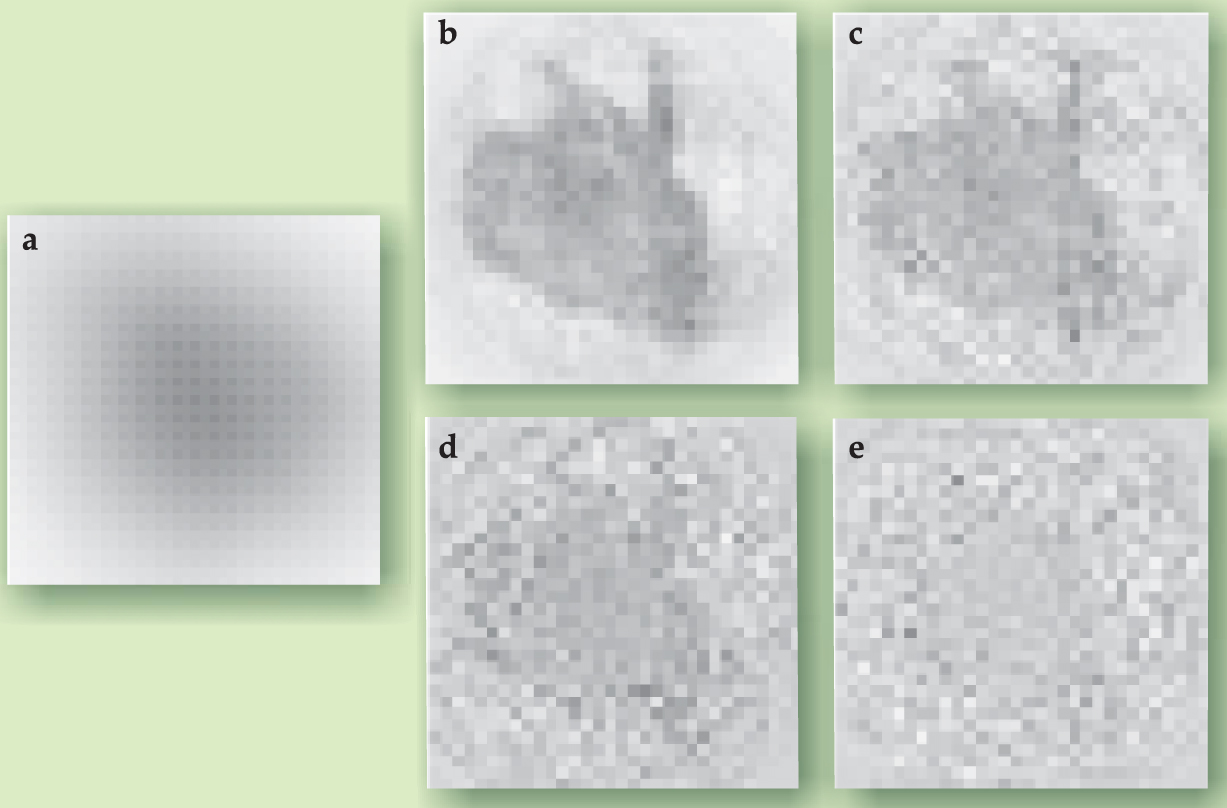
Figure 3. Reconstructing the source image of the hare from the IR image (a) on the membrane of the model pit organ. Panels (b)–(e) show the image sharpened by means of the reconstruction matrix of equation
(Adapted from ref. 1.)
An image reconstruction matrix R, somehow permanently impressed on the adult snake’s neural circuitry, transforms S into I:
where summation over repeated indices in a term is implied. In other words, each component of the brain’s image is taken to be a specific linear superposition of inputs from many membrane sensors.
The matrix R that specifies this superposition would be the same for all images. Van Hemmen calls it a virtual lens. Before addressing how the snake might have come by such a useful algorithmic device, van Hemmen and company derive its components mathematically, for an idealized pit-organ geometry, from the very general requirement that the mean-square discrepancy between the components of I and those of the “true” thermal image (in this case figure
The minimization condition yields a numerically solvable equation for R that involves only the pit organ’s geometry and two parameters that characterize the typical sensor noise on the membrane and source noise due to perturbations such as movement of the prey or foreground vegetation. For given noise parameters, one gets the matrix elements R αβ by a standard computer calculation that, somewhat surprisingly, requires no knowledge of any particular source or its IR image. Essentially, the computer’s task was the numerical inversion of a second matrix that depends only on the geometry of the pit organ and the two noise parameters.
Putting in explicit guesses for the noise parameters and then multiplying the vector S representing the hare’s membrane image (figure 3(a)) by the resulting matrix R yields the reconstructed images in figures
Therefore, to the extent that the Munich group’s model resembles what’s going on in the snake’s head, the demonstrated night-hunting skill of these predators implies that typical sensor noise in the pit organ’s membrane cannot exceed about 1% of the IR signal. Such finicky noise sensitivity is understandable. The snake has to solve the delicate inverse problem of reconstructing an image from membrane sensors each of which, unlike the retinal cells of a well-focused eye, receives inputs from all over the source.
Neural computing and learning
Of course a snake’s neural circuitry cannot perform a numerical matrix inversion. But it could, argues van Hemmen, perform the matrix multiplication of equation 1. “A neural-network realization of our model in the snake is easy to imagine,” he says. The matrix elements R αβ would be the strengths of individual synaptic connections between the nerve fibers from membrane sensory cells to neurons forming an IR image map in a part of the snake’s brain called the optic tectum.
The optic tectum also houses the visual map connected to the snake’s eyes. It is known that both the IR and visual maps in the tectum are topological representations. That is to say, neighboring map neurons represent neighboring patches of the outside world. Furthermore, detailed studies of pit vipers in the early 1980s by neurobiologists Eric Newman and Peter Hartline showed that optical and IR maps form on adjacent neural layers in the optic tectum and physically overlap each other with remarkable fidelity. 3 After all, the proximity of the pit organs to the snake’s eyes makes their fields of view almost identical. The optical map, of course, has much finer resolution.
It was Newman and Hartline who first raised what van Hemmen calls the pit-organ paradox when they observed in vivo that an external point source of heat produces a big thermal blob on the membrane that, nonetheless, results in a highly localized signal on the optic tectum’s IR map.
How does the reconstruction matrix become imprinted on the snake’s neural circuitry in the first place? “It can’t be genetic coding,” says van Hemmen. “The snake would need a suitcase full of genes to encode such detail. Besides we know that snakes and barn owls need a season of actual learning, not just anatomical maturation, to acquire their extraordinary skills.”
In an animal’s neural network, the triggering of a downstream neuron typically depends on independent inputs from several neurons joined to it by narrow synaptic clefts across which chemical neurotransmitters communicate the incoming electrical excitations (see Physics Today, October 2000, page 20 ). A synapse can be excitatory, inhibitory, or just ineffectual. It’s well known that a synapse can be strengthened or weakened by its past history. In one common mode of this sort of “learning,” the excitatory synapse from one of several input neurons is strengthened by the frequent experience of being followed promptly by the successful triggering of the postsynaptic neuron—which success depends on the entire ensemble of independent inputs.
The proximity, overlap, and neural connections between the visual and IR neural maps in the tectum suggest that visual images are performing what van Hemmen calls supervised teaching of the young snake’s IR circuitry. The synapse strengths, he argues, are gradually optimized to minimize discrepancies between what the snake sees in daylight with its eyes and with its pits.
“The African clawed frog we recently studied makes an even stronger case for this kind of supervised neural-network learning from visual inputs,” says van Hemmen. 4 Its eyes seem to have little other purpose. Once enough visual assistance has taught the young frog to “see” insects on the pond’s surface through its lateral line of surface-ripple detectors, the night hunter’s eyes becomes largely useless.
References
1. A. B. Sichert, P. Friedel, J. L. van Hemmen, Phys. Rev. Lett. 97, 068105 (2006) https://doi.org/10.1103/PhysRevLett.97.068105 .
2. W. Gerstner et al., Nature 383, 76 (1996) https://doi.org/10.1038/383076a0 .
3. E. Newman, P. Hartline, Science 213, 789 (1981) https://doi.org/10.1126/science.7256281 .
4. J.-M. P. Franosch, M. Lingenheil, J. L. van Hemmen, Phys. Rev. Lett. 95, 078106 (2005) https://doi.org/10.1103/PhysRevLett.95.078106 .


