Modeling the Sumatra–Andaman Earthquake Reveals a Complex, Nonuniform Rupture
DOI: 10.1063/1.1996463
What is the appropriate scientific response to a human tragedy? Thorne Lay of the University of California, Santa Cruz asked himself and his colleagues that question in the days following the 26 December 2004 earthquake off the coast of Sumatra. Like the rest of us, he and other geophysicists saw disturbing images of thousands of bodies floating in the devastation from the tsunami. A flurry of e-mails and a New Year’s Eve conference call from Lay to his colleagues soon initiated a collective effort from the seismological community to analyze what happened. Their hope was to replace the usual race to publication among competing groups with a more concerted response: a single account that would provide a complete and robust characterization of the earthquake.
That account, now published in a collection of three papers in Science, 1–3 coauthored by 40 researchers from 23 universities and institutes in 7 countries, confirms that the Indonesian earthquake was indeed astonishing—the largest anywhere in 40 years. A thousand kilometers from the fault zone, the ground in Sri Lanka vibrated with amplitudes greater than 9 cm within a minute after the first compressional waves arrived, and longer-period surface-wave motion eventually exceeded 1 cm everywhere on Earth’s surface. The earthquake lasted 9 minutes, ruptured nearly 250 000 km2 of oceanic rock—a large fraction of it slipping 10–15 meters across the fault surface (see figure 1)—and released as much strain energy as all other earthquakes combined over the past fifteen years.

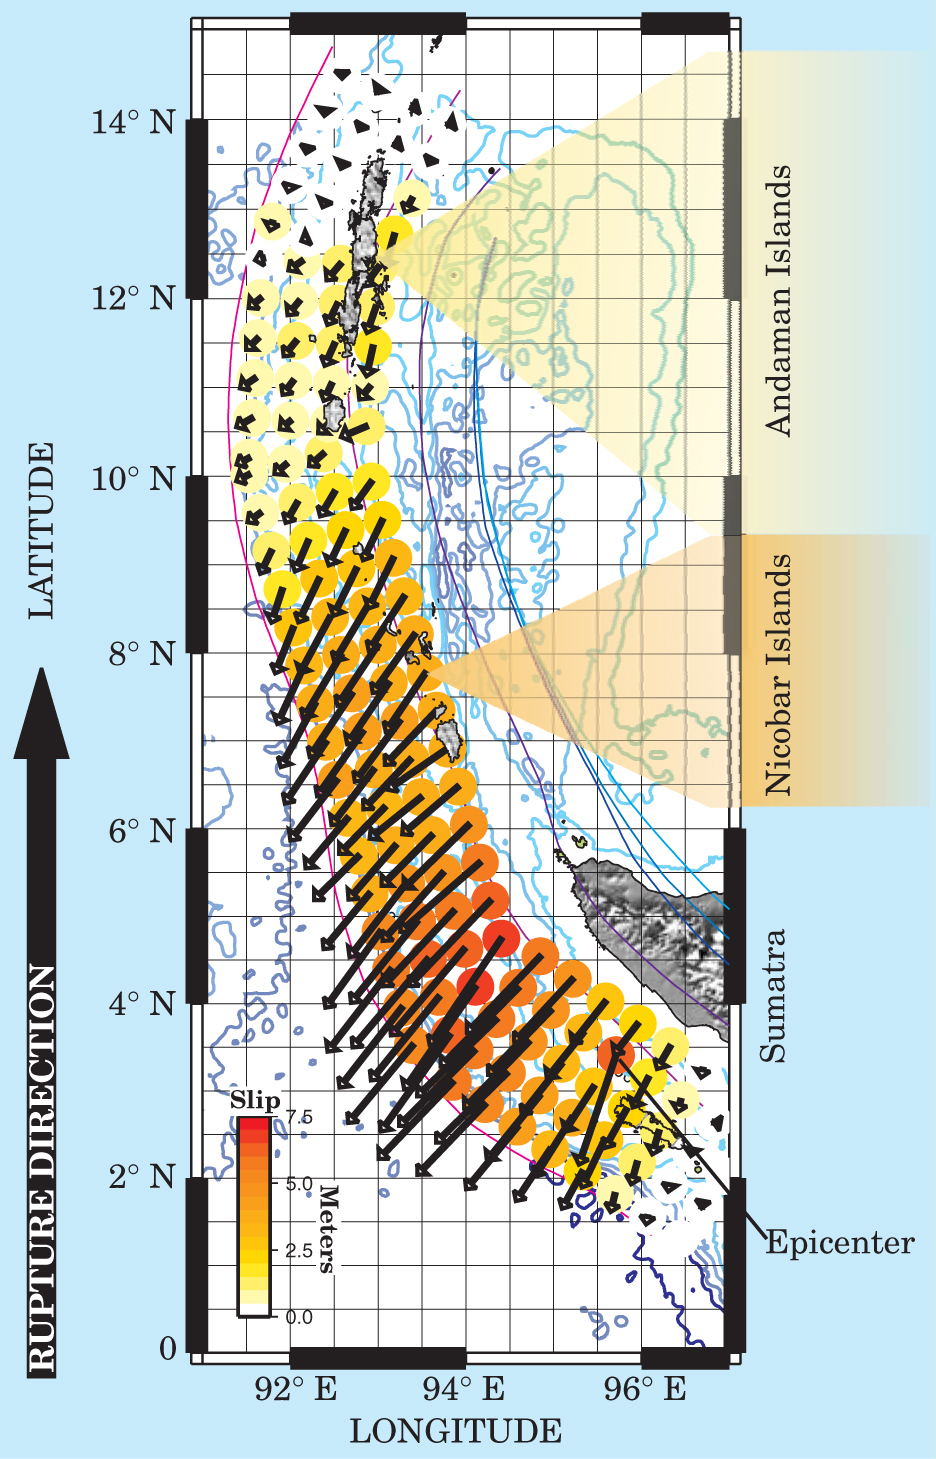
Figure 1. How and where did the plate slip occur during the 26 December 2004 earthquake? Each colored disk in this model represents a 50-km-diameter point source; slip vectors point in the direction of local plate motion. Starting off the coast of Sumatra, the rupture progressed northwest like a propagating crack, unzipping first toward the Nicobar Islands and then toward the Andaman Islands about 1200 km from the epicenter. The displacement, or slip, of rock across the fault surface reached a maximum of about 15 m in places. As the rupture neared its northern end past the Nicobar Islands, the slip magnitudes dropped to just 1–2 meters and the orientation of the plate motion became nearly parallel to the fault. This seismic model’s reliance on surface waves with long period (a few hundred seconds) captures the directionality but somewhat underestimates the full magnitudes of the displacement.
(Adapted from ref. 2.)
Thousands of aftershocks along the stretch running from Sumatra to the Andaman Islands have since occurred, including 150 in January 2005 on shallow faults in the Andaman sea—the largest swarm of magnitude 5 or greater aftershocks ever observed. Moreover, the December earthquake probably triggered the 28 March 2005 earthquake off Sumatra—the second largest in 40 years. The stress relieved on one part of the fault could have been transferred to increase the accumulated stress on an adjacent one, 4 although shaking may also play a role in the triggering of earthquakes. (For a primer on the physics of earthquakes and tsunamis, see Hiroo Kanamori and Emily Brodsky’s article in June 2001, page 34 , and David Stevenson’s Reference Frame on page 10 of this issue.)
The Global Seismographic Network (GSN), composed of 137 ground-based stations distributed worldwide and run by the Incorporated Research Institutions for Seismology (IRIS) in collaboration with the US Geological Survey, captured the broadband character and complexity of the vibrations in exquisite detail. 5 Designed to monitor ground motion to within microns, the GSN seismometers are basically simple inertial pendula whose restoring force comes from springs. But in practice, to protect and preserve the linear response of those exceedingly delicate springs, the sensors use feedback to measure the inductive current required to keep the spring motionless relative to the shaking ground.
Most seismometers in the GSN are equipped with real-time communication channels that provide rapid collection and distribution of the data.
Stations from international networks boost the number of broadband seismometers to about 400, most of whose records are available through an open-source research database managed by IRIS. “It sounds terrible to say it,” confided IRIS seismologist David Simpson, “but this [earthquake] is what we’ve been waiting for.”
The challenge in seismology is to take the waveform that arrives at one of those stations and convert it into a measurement of the displacement of rock on a fault. That amounts to solving an inversion problem: Reconstruct the waveform—by constructing a Green’s function—at that distant location using elasticity theory, and map it back to the rupture source. Point-source solutions usually suffice, but for sizable ruptures—and, at roughly 9 minutes, the Sumatran earthquake was the longest lasting and largest rupture ever recorded—researchers have to account for the spatiotemporal complexity in their reconstructions.
The trick is to deconvolve the spectral components from different seismic wave pulses that can interfere over time. Short-period (1–2 seconds) compressional waves arrive at seismometers first, followed by longer-period (tens of seconds) shear and surface waves. 2 The longest-period waves (thousands of seconds) are free oscillations of Earth vibrating in its normal modes. The earthquake excited a plethora of such modes (including the breathing mode in which Earth’s surface expands and contracts), which remained observable for weeks. 3
The reflection of signals from Earth’s surface and scattering from inhomogeneities in the mantle create resonances in the waveforms and mix the signal phases. And because the rupture is directional—that is, it moves toward some stations and away from others—seismic energy becomes piled up in one direction in a way analogous to a Doppler shift. Comparing the waveforms and arrival times between different GSN stations played a critical role in reconstructing the dynamics at various points on the rupture surface. Other complications couldn’t be helped: Earth acts like a low-pass filter, attenuating the highest-frequency waves, so some band-width was irretrievably lost.
The collaboration of researchers adapted their algorithms to account for the various superpositions and analyzed everything in a self-consistent way. The result combines analysis based on high-frequency signals, which capture localized details, and longer-period waves, which capture aspects of the event’s total size, duration, and energy release.
Slip-sliding away
A composite model fit the data best. The rupture followed the fault line along the Andaman trench, where one slab of cold oceanic plate sinks under gravity, or subducts, into the mantle underneath another. Starting off the coast of Sumatra (see figure 1), the rupture progressed slowly for the first minute, with little displacement (or slip) of the rock masses on either side of the fault. It grew in intensity, with the amount of slip reaching a maximum near Sumatra’s northern edge. It then expanded northwest past the Nicobar Islands and turned clockwise toward the Andaman Islands, with a long tail where the slip displacement—at least as modeled by seismic waves—was small, on the order of 1–2 m. Using a high-density seismic array (Hi-Net) in Japan and working independently, Miaki Ishii of the University of California, San Diego and colleagues found qualitatively similar features. 6
That the great earthquake originated in the southern part of the rupture makes sense: The plates there are young and buoyant—they couple more tightly during subduction—and converge quickly. But precisely why the northern section should rupture remains mysterious. The plates there are old and the relative motion of the plates on the ocean floor is oblique to the fault, nearly parallel. Great subduction-zone earthquakes seldom occur under such conditions, says Caltech seismologist Kanamori.
The southern part of the rupture conforms to a model of brittle failure, in which the rupture speed is high (about 2.5 km/s) and the slip is fast (1–2 m/s). The northern region appears to behave far differently. Rapid seismic slip was relatively small, but judging from uplift and the tilting of the islands registered by geodetic measurements, large, slow slip appears to have occurred there—more akin to a slow, almost silent earthquake, with some fraction of the plate displacements occurring over 50–60 minutes, maybe longer. In that picture, a far greater fraction of the energy goes into thermal dissipation, fracture, and plastic deformation distributed over large volumes than into vibrational motion radiated as seismic energy. But slow earthquakes are typically much smaller, and gradual post-seismic slip can last weeks longer, than December’s spectacular event. Kanamori speculates that the bizarre behavior up north may, in fact, be part of what makes this earthquake unique: Without the forceful unzipping from the south, the northern section may never have failed.
Satellite snapshots
Almost two hours after the earthquake struck, the low-orbiting altimetry satellite Jason 1 was, by chance, in the right place at the right time: tracking the ocean surface 1500 km from Sri Lanka and headed northeast toward the Bay of Bengal. Within the 10 minutes it took to reach the Burmese coast, the satellite passed over the front of the tsunami wave and measured to within a few centimeters a 5-km wide profile of the surface along its track (see figure 2). With the tsunami’s wavelength about 500 km, huge regions of the ocean were rising and falling in response to the sea floor’s displacement.

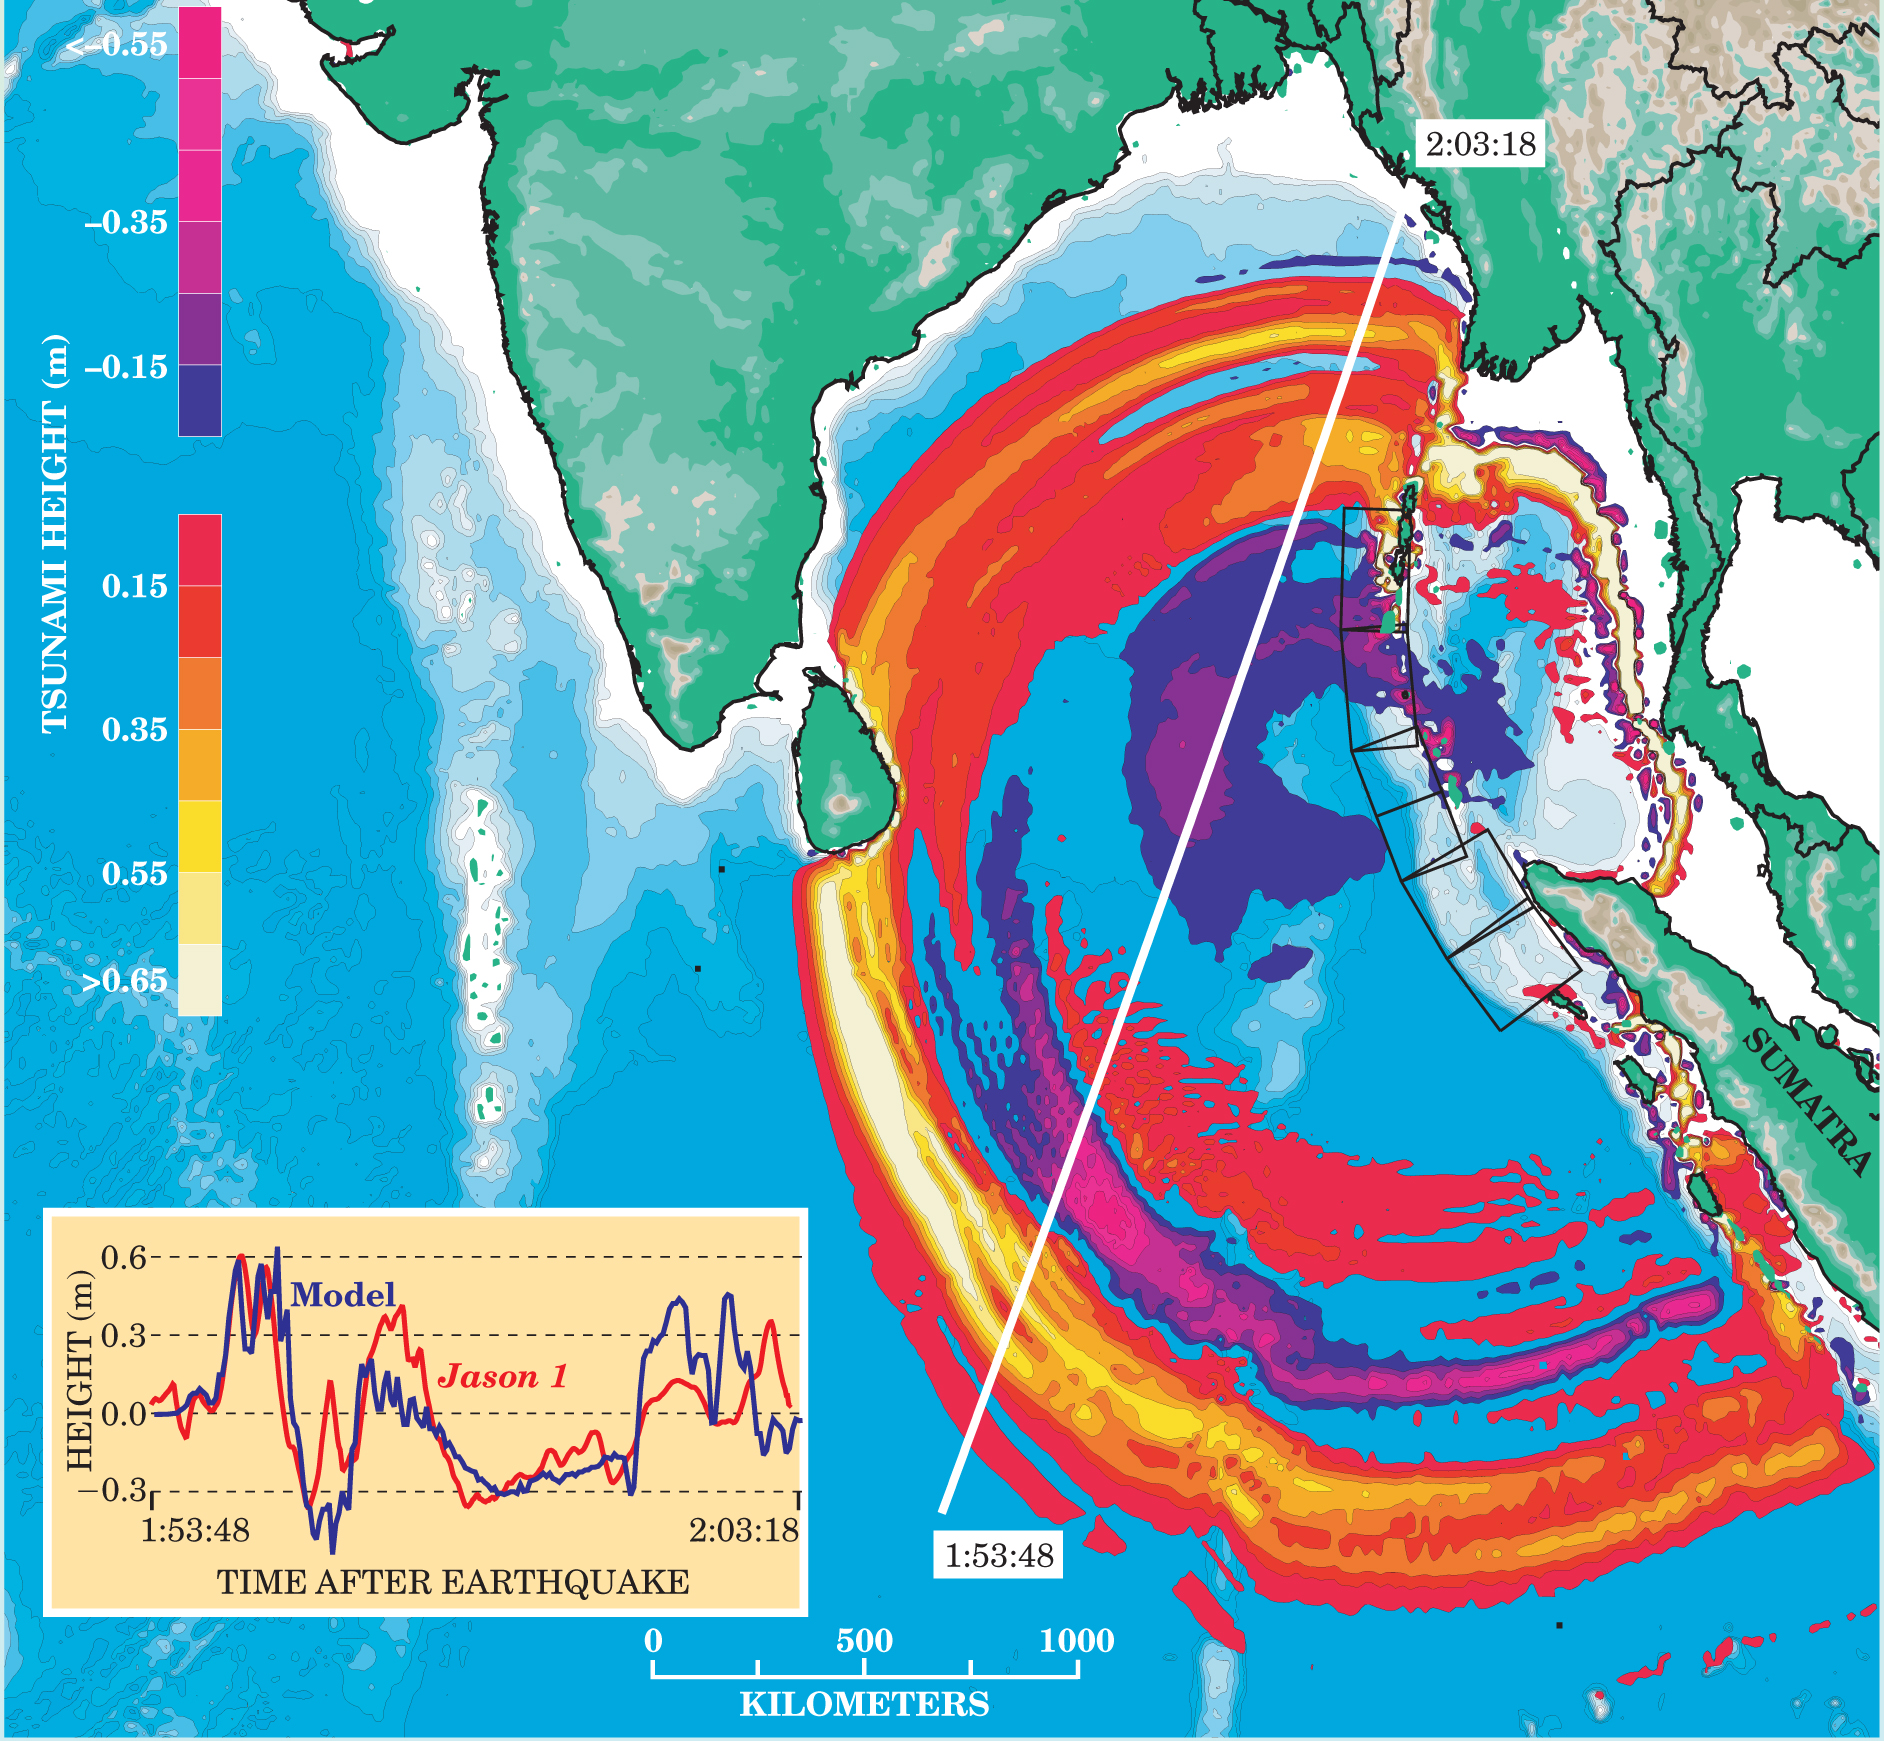
Figure 2. This simulated snapshot of the tsunami consists of reconstructed peaks and troughs that formed in the Indian Ocean at a moment 1 hour, 55 minutes after the earthquake struck. Around that time, the low-orbiting satellite Jason 1 was flying northeastward (white track) and fortuitously measured a narrow profile of the tsunami wave (inset, in red). Adjustable parameters in the seismic model, including the duration, amount, and start time of the slipping at each stage of the rupture (drawn here as boxes), were varied to best match the calculated profile (inset in dark blue) to the actual satellite profile.
(Adapted from ref. 1.)
As the Indian plate gets dragged into the subduction zone, it pulls down Sumatra, which flexes. Once some frictional instability had triggered the earthquake, the top plate slid up and to the southwest out toward the trench, with a concomitant band of down-warping on the Sumatra side. That plate flexure determined the orientation of the tsunami wave and, consequently, what shore-lines would experience first: dramatic coastal receding in the case of Banda Aceh, or an inundating first wave in the case of Sri Lanka. Once the tsunami, with its roughly half-hour period, reached land, “the ocean turned into a river,” as University of California, Santa Cruz geophysicist Steven Ward puts it.
Using the seismic model and inverse techniques analogous to how seismologists reconstruct waveforms, Ward modeled the structure of the ocean tsunami. 1 Adjusting parameters—when, how quickly, and how much the sea floor rose, for instance—he matched the synthetic waveform to the Jason 1 profile. Earthquakes can be used as inputs to tsunami models, but working backward from tsunamis to earthquakes misses certain aspects about the slip on the fault. However, to match his synthetic waveform to the satellite’s observation of a broad trough in the central Bay of Bengal, Ward had to presume much larger slip displacements in the northern end of the rupture over an hour’s duration than seismic models alone would predict. In that respect, the tsunami serves as a window into intermediate-length processes not captured by shorter-period seismic signals. Still, uncertainty in a few parameters, most notably how steeply one plate dips under the other, continues to stir debate over the problem.
Where next?
Long term, the slow accumulation of stress as tectonic plates converge makes earthquakes inevitable. But the rate at which that happens is nonuniform, and the strength of the crust is also not constant. The presence of water can weaken the crust significantly, and heterogeneities along the fault zone influence its frictional properties. So, predicting where and when the next big one is likely to strike largely boils down to checking the historical record. And the error bars can be decades or centuries. The last large tsunami to strike Indonesia occurred in 1861.
Seismologists are now concerned about the earthquake potential of the Cascadia fault—a subduction zone in which the Juan de Fuca plate is sinking under the US Pacific northwest. An important question is whether scientists can distill from the vast data now collected an improved understanding of what the expected seismic shaking is likely to do to high-rise buildings there. The matter is pressing. That fault zone has been accumulating stress for 300 years and is as close to Seattle as the Sumatran earthquake epicenter is to Banda Aceh.
References
1. T. Lay et al., Science 308, 1127 (2005) https://doi.org/10.1126/science.1112250 .
2. C. J. Ammon et al., Science 308, 1133 (2005) https://doi.org/10.1126/science.1112260 .
3. J. Park et al., Science 308, 1139 (2005) https://doi.org/10.1126/science.1112305 .
4. J. McCloskey, S. S. Nalbant, S. Steacy, Nature 434, 291 (2005) https://doi.org/10.1038/434291a .
5. J. Park, K. Anderson, R. Aster, R. Butler, T. Lay, D. Simpson, Eos Trans. Am. Geophys. Un. 86, 57 (2005) https://doi.org/10.1029/2005EO060001 .
6. M. Ishii et al., Nature (in press).


