Is there a Slowing in the Atlantic Ocean’s Overturning Circulation?
DOI: 10.1063/1.2207029
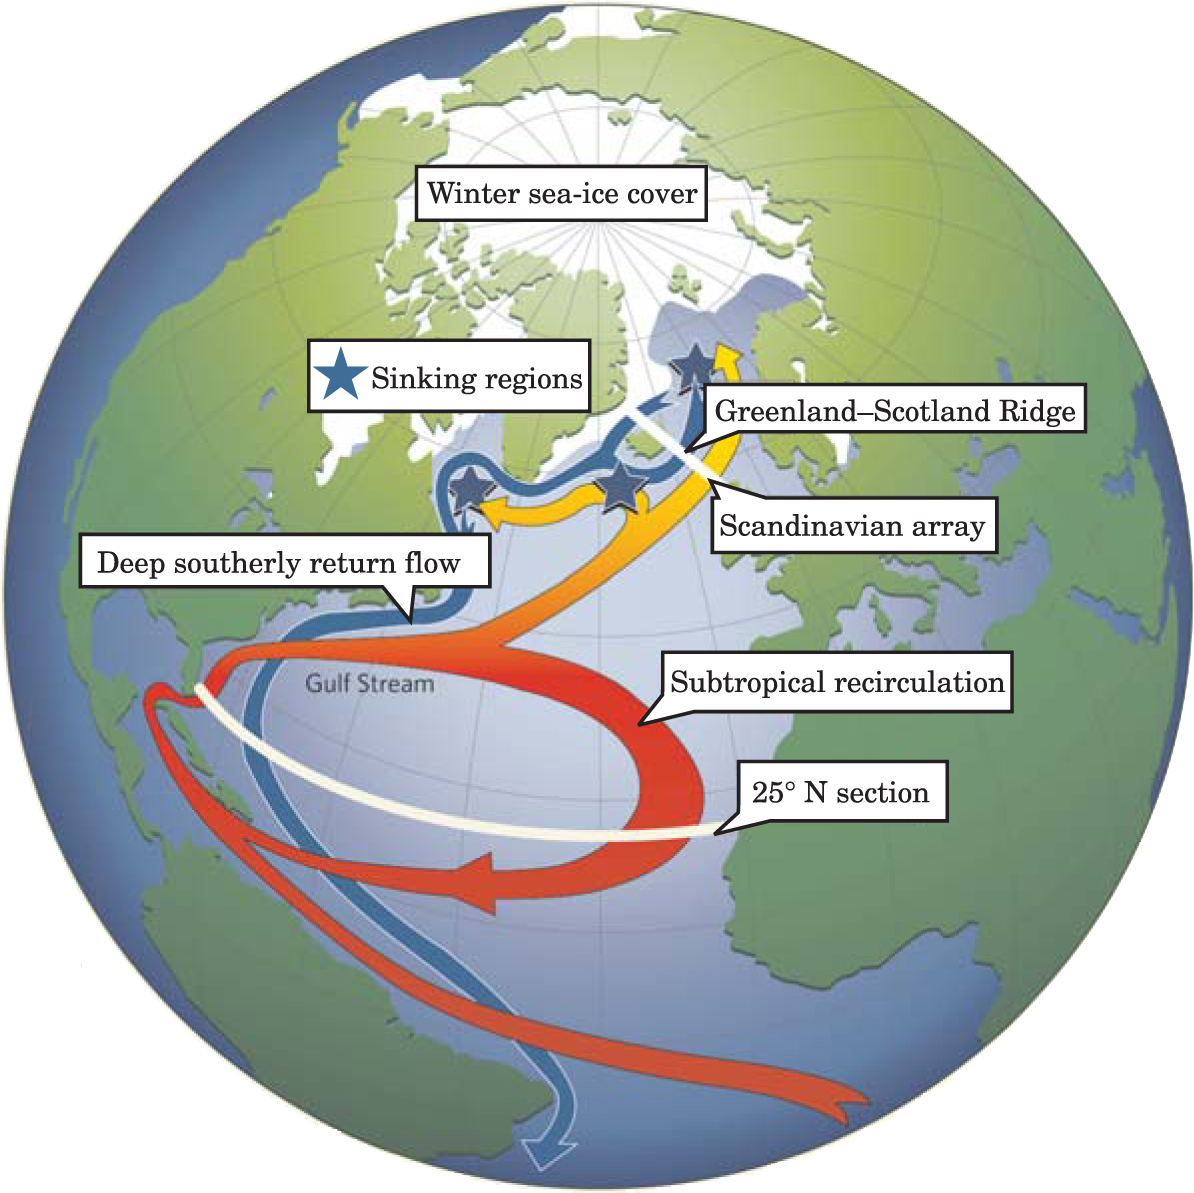
Parisians sipping coffee in outdoor cafés owe their comfort to the circulation patterns of the North Atlantic Ocean. Surface currents carry warm water from the tropics to high latitudes, where the water grows colder and hence denser. In the far north, this dense, cold, and salty water sinks to depths from one to six kilometers, where it forms the southward-flowing deep water of the North Atlantic, as depicted in the schematic in figure 1. Because the ocean exchanges heat with the atmosphere, any disruption in this so-called meridional overturning circulation (MOC) is likely to impact the climate on the adjoining land masses.

Figure 1. North Atlantic circulation. The Gulf Stream and wind-driven Ekman transport (red) carry heat northward near the ocean’s surface, with some of that warm surface water returning in a subtropical loop. The water that reaches high latitudes is cold, salty, and dense (yellow) and eventually sinks to depths of 1–6 km, primarily at the regions indicated by blue stars. Colder, deep water (blue) flows southward. White bands indicate sections along which researchers have monitored current flows.
(Adapted from ref. 8.)
That’s why a recent report 1 about the circulation caused such a big stir. Based on ocean data collected over the past 47 years, Harry Bryden and Hannah Longworth of the University of Southampton, UK, together with Stuart Cunningham of the National Oceanography Center in Southampton, estimated that the MOC has slowed; its northward heat transport has decreased 30% in that period. The report immediately raised many questions: If such a change had indeed occurred, would it really have caused a noticeable change in sea or land surface temperatures? Could such a large change have resulted from greenhouse warming, estimated 2 to be 0.6 °C in the 20th century? Current computer models predict that a significant slowing of the MOC would take nearly a century and require temperatures increases of 4–6 °C. Could the observed change in the MOC be a natural fluctuation of the system and not a trend? Might the measurement itself be called into question?
More than anything else, the Southampton team’s results highlight the critical need for more data, especially systematic data, on the worldwide ocean system. Actually, one member of that team, Cunningham, helped collect the most recent data while on a ship-borne expedition in 2004 to put into place a new system of moored ocean sensors in the North Atlantic.
Part of a global circulation
The North Atlantic circulation is just one part, albeit the best-understood part, of a global circulation pattern linking the world oceans. It forms part of what’s sometimes called a global conveyor belt, with the Atlantic deep water snaking eventually into the Pacific, and warmer, shallower water returning from there. Such a simplified picture, which depicts the circulation as an orderly laminar flow, is quite deceptive, however, because the actual processes involve a highly complex and turbulent fluid and the flows can take thousands of years.
Evidence from the geological past suggests that the ocean’s circulation has changed, at least locally, on geologically short time scales. Researchers are still studying and debating the possible link between such shifts in ocean circulation and climate change.
The large weakening of the MOC aroused particular concern in light of the more extreme predictions that have been made about the global oceanic circulation—that is, that it might cease altogether, perhaps as a result of the warming associated with increased emissions of greenhouse gases. But Carl Wunsch of MIT thinks such scenarios are greatly overblown. He believes that we don’t currently understand enough about the ocean system and its interaction with the atmosphere to make reliable predictions. Even the climate models that simulate a shutdown of the global circulation show that it’s not likely to happen for 100 years and would require rapid temperature increases of 4–6 °C. Wallace Broecker of Lamont Doherty Earth Observatory, who in 1985 first linked the oceanic conveyor belt to the ice ages, 3 now discounts the fear that such a shutdown will trigger an ice age. You need an amplification provided by sea ice, he says, but you won’t have sea ice in a significantly warmer climate.
Redistribution of mass transport
Bryden and coworkers found that there had been an effective redistribution in the southward-flowing mass transport. The flow had increased in the thermocline, the region of steep temperature gradient between 100 m and 600 m deep, and it had decreased in the very deep waters between 3 km and 5 km. Such results suggest that less surface water is being driven toward the ocean bottom in the northern reaches of the ocean.
Bryden’s team gathered data at points along a line at 25° N latitude that stretched from roughly the tip of Florida east to the coast of Africa (see the southernmost white band in figure 1). At each of roughly 120 points along the line, the team recorded the temperature and salinity as a function of depth. From that information, the researchers were able to determine density and, indirectly, the vertical pressure, up to a constant. Similar data had been collected along the same line in 1957, 1981, 1992, and 1998.
From the pressure values along the 25° N line, the researchers could determine the mass flux perpendicular to a line between pairs of points at each depth. Flows in the ocean are dominated by the geostrophic relationship, according to which the pressure-gradient force, directed in this case from west to east, must balance the Coriolis force. Think of the clockwise atmospheric circulation that a meteorologist draws around a high-pressure region in the Northern hemisphere, suggests Jochem Marotzke of the Max Planck Institute for Meteorology in Hamburg, Germany. A counterclockwise circulation surrounds a low pressure region. If there’s high pressure in the west and low pressure in the east, the atmospheric winds in between will blow south. The same holds for ocean currents. By looking at the density difference between pairs of points in their data set, Bryden and his coworkers were able to estimate the mass flux across a line between the points, as a function of depth. The calculations give the current relative to the surface current.
To conserve mass, of course, the overall northward flow, which primarily occurs near the surface, must be balanced by the overall southward flow at greater depths. The two components of the northward flow are the Ekman transport (surface currents driven by wind shear) and the Gulf Stream transport through the Florida Straits. The former is usually estimated from the surface winds observed by satellite. The Gulf Stream has been measured in recent years by the electrical current it induces in an abandoned telephone cable laid down years ago in the Florida Straits. (Earth provides the required magnetic field.) Bryden and company saw no change in Gulf Stream or Ekman transports since reliable measurements began in 1980. The changes they saw occurred in the southward portion of the flow.
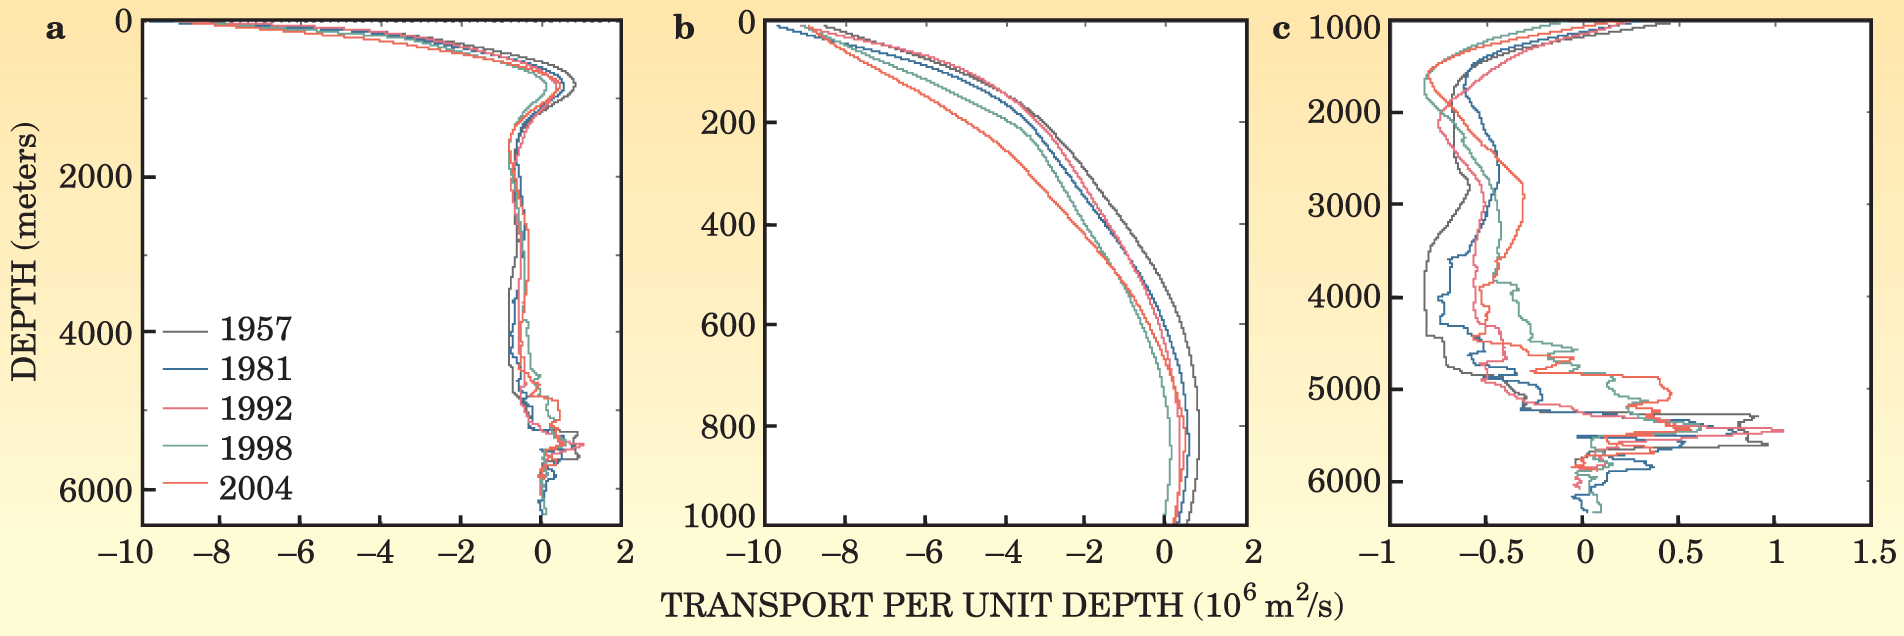
Figure 2 shows the relative changes in the mid-ocean geostrophic circulation—that is, the part of the flow that excludes the Ekman transport and Gulf Stream. In the figure, which plots the transport per unit depth as a function of ocean depth for each of the five years of data collection, positive transport indicates northward flow. The general pattern is seen in figure

Figure 2. Changes in the oceanic transport over time. Transport per unit depth—the zonally averaged velocity times the zonal distance across the section—is plotted as a function of depth in the ocean. Positive transport indicates northward flow. Not shown are the relatively constant, northward-flowing Gulf Stream and Ekman transports. (a) Top-to-bottom profile shows that in all years there’s a southward transport of waters above 800 m, a small northward transport in 800–1200 m and a southward transport at depths down to 5000 m. (b) Enlarged view of depths down to 1000 m reveals that southward flow increased from 1957 to 2004. (c) Enlarged section below 1000 m shows little net change in flow at 1–3 km over the past 47 years, but significant decrease in the southward flow between 3 and 5 km.
(Adapted from ref. 1.)
Figures
Larger than expected
If those results indeed reflect a large change in the MOC, they confound many expectations. One factor that might affect the overturning rate would be a warming of the surface waters, which would make the waters less dense and hence less likely to sink, comments climate modeler Ronald Stouffer of the National Oceanic and Atmospheric Administration’s Geophysical Fluid Dynamics Laboratory in Princeton, New Jersey. Another factor might be atmospheric transport of more fresh water to the North Atlantic in the form of rainwater, which would decrease salinity and hence density. To cause a change in the MOC as large as that observed by Bryden’s group, however, the atmosphere would have to have warmed more than is observed today.
The salinity of the northern North Atlantic has already been noticeably diluted since the mid-1960s. Ruth Curry of the Woods Hole Oceanographic Institution in Massachusetts and Cecilie Mauritzen of the Norwegian Meteorological Institute in Oslo recently deduced that 4000 km3 of fresh water must have been added to the Nordic Seas in the past 40 years to produce this dilution. 4 That’s eight times the annual flow of the Mississippi River. So far, however, this increased fresh water seems to have had no measurable effect on the southward-flowing waters in the Nordic Seas. At the current rate of freshwater accumulation, the two researchers estimate, it will take another 100 years to substantially affect the ocean exchanges.
A wild card in future scenarios might be an extremely rapid and unexpected melting of the enormous reservoir of ice held in the Greenland glaciers. That effect is not included in current models. However, the flow of Greenland glaciers is speeding up, and accelerated ice discharge doubled the annual ice sheet mass loss in the last decade, according to a new analysis of satellite data by Eric Rignot of the Jet Propulsion Laboratory and Pannir Kanagaratnam of the University of Kansas. 5 The Greenland glaciers cover an area of 1.7 million km2 (a little smaller than Mexico) and are up to 3-km thick in spots. But no one is expecting them to melt in a single catastrophic event.
Current climate models combining ocean and atmosphere have been used to look at the fate of the MOC. The 20th century simulations show a weakening that’s much smaller than the changes seen by the Southampton group. Some models that look at climate into the 21st century do see about the same amount of MOC slowing over those 100 years. For example, Andreas Schmittner of Oregon State University and colleagues from the Leibniz Institute for Marine Sciences recently combined the results of a number of models, weighted according to their accuracy in simulating hydrographic properties. 6 Those models found that the overturning circulation in the North Atlantic would slow by 25% over the course of the 21st century. In the same time period the models predict global temperatures would climb, on average, by about 3 °C.
The predictions of a sudden flip in the global circulation from one state to another show up in some computer models. In a recent comparison of the kind of intermediate-resolution models that look for such bifurcation, a group headed by Stefan Rahmstorf at the Potsdam Institute for Climate Impact Research in Germany estimated the threshold for the circulation to shut down entirely. 7 The current climate, the team members conclude, is not close to that point but might approach it in the next 100 years.
Coupled ocean–atmosphere models are, unfortunately, limited by their resolution, says Stouffer. Many still are not able to resolve the physical processes required to simulate some of the flows that oceanographers think are important to the overall picture.
The large change in mass transport estimated by the Southampton team does not seem to have affected the climate significantly. If the MOC had indeed slowed by 30%, one might have expected to see less warming of northern Europe or perhaps greater changes in the sea surface temperatures than have occurred. Or perhaps the climate is less sensitive to the circulation than previously thought?
Natural fluctuations?
The data themselves are not above suspicion as the source of the discrepancy between the reported change and prior expectations. Do the data indeed signal a real long-term change in the MOC? The question is virtually impossible to answer without additional continuous monitoring of the circulation. The Southampton team had access to data at 25° N from only five samplings over 47 years. Furthermore, the data were not all taken at the same time of year. In the absence of more knowledge of the ocean system, the experimenters can only assume that the currents do not vary significantly with season and that the observed change of 30% is a real trend and not a natural variability of the system. As Wunsch puts it, the results are based on an undersampling of a very noisy system. The ocean is subject to variations on many time scales, some as long as thousands of years.
Another worry is the possibility that short-range perturbations by eddies have given a misleading signal. The mass-flow estimates are particularly sensitive to the western edge of the line of instruments, precisely where eddy motion is known to be strongest.
Bryden understands those arguments but points to two features of his group’s data that make him think that his team is not seeing an artifact. First, he believes that the increased southward thermocline transport is consistent with the substantially warmer waters that are seen in the thermocline near the Bahamas. Second, he points out that the mass flow does not change uniformly as a function of depth but features a reduction only in the very deep transport.
Researchers will not know how much the mass flux across this 25° N section fluctuates on various time scales until they accumulate data from the sensors that were deployed there in 2004. The MOC monitoring system, whose price tag is about $8.7 million dollars is part of the Rapid Climate Change (RAPID) Program funded by the Natural Environment Research Council in the UK as well as by NSF and NOAA in the US. The program is funded through 2008, and principal investigator Bryden is hoping that the funding will be extended through 2014 so that researchers can collect data for a full decade.
Bryden, Marotzke, and others are currently analyzing the first data to emerge from RAPID. Those data will start to give researchers a feel for how much the mass flux varies on weekly and monthly scales. Ten years of data will give insight into yearly variations.
RAPID is aiming to build an observing system to monitor the Atlantic’s MOC. It’s part of a number of new systems to monitor the ocean’s role in climate. Those systems include sustained satellite observations, an El Niño array in the equatorial Pacific, and ARGO, a global array of 3000 roaming floats that record and transmit data (see Physics Today, July 2000, page 50 ). Still, the data seem like the proverbial drop in the bucket when it comes to understanding the vast and complex ocean.
References
1. H. L. Bryden, H. R. Longworth, S. A. Cunningham, Nature 438, 655 (2005) https://doi.org/10.1038/nature04385 .
2. First Working Group, Intergovernmental Panel on Climate Change, Climate Change 2001: The Scientific Basis, Cambridge U. Press, New York (2001), available at http://www.grida.no/climate/ipcc_tar/wg1/index.htm .
3. W. S. Broecker, D. M. Peteet, D. Rind, Nature 315, 21 (1975) https://doi.org/10.1038/315021a0 .
4. R. Curry, C. Mauritzen, Science 308, 1772 (2005) https://doi.org/10.1126/science.1109477 .
5. E. Rignot, P. Kanagaratnam, Science 311, 986 (2006) https://doi.org/10.1126/science.1121381 .
6. A. Schmittner, M. Latif, B. Schneider, Geophys. Res. Lett. 32, L23710 (2005) https://doi.org/10.1029/2005GL024368 .
7. S. Rahmstorf et al., Geophys. Res. Lett. 32, L23605 (2005) https://doi.org/10.1029/2005GL023655 .
8. D. Quadfasel, Nature 438, 565 (2005) https://doi.org/10.1038/438565a .


