Industry R&D forecast is bullish despite concerns over talent dearth
DOI: 10.1063/1.2911174
More than one-third of the companies that responded to a survey by the Industrial Research Institute said they expected to increase R&D spending by at least 5% in 2008, while 11% planned cuts. The IRI comprises 219 science and technology companies with US-based R&D operations, including traditional physics hubs such as IBM Corp, Xerox Corp, and Bell Labs parent company Alcatel-Lucent.
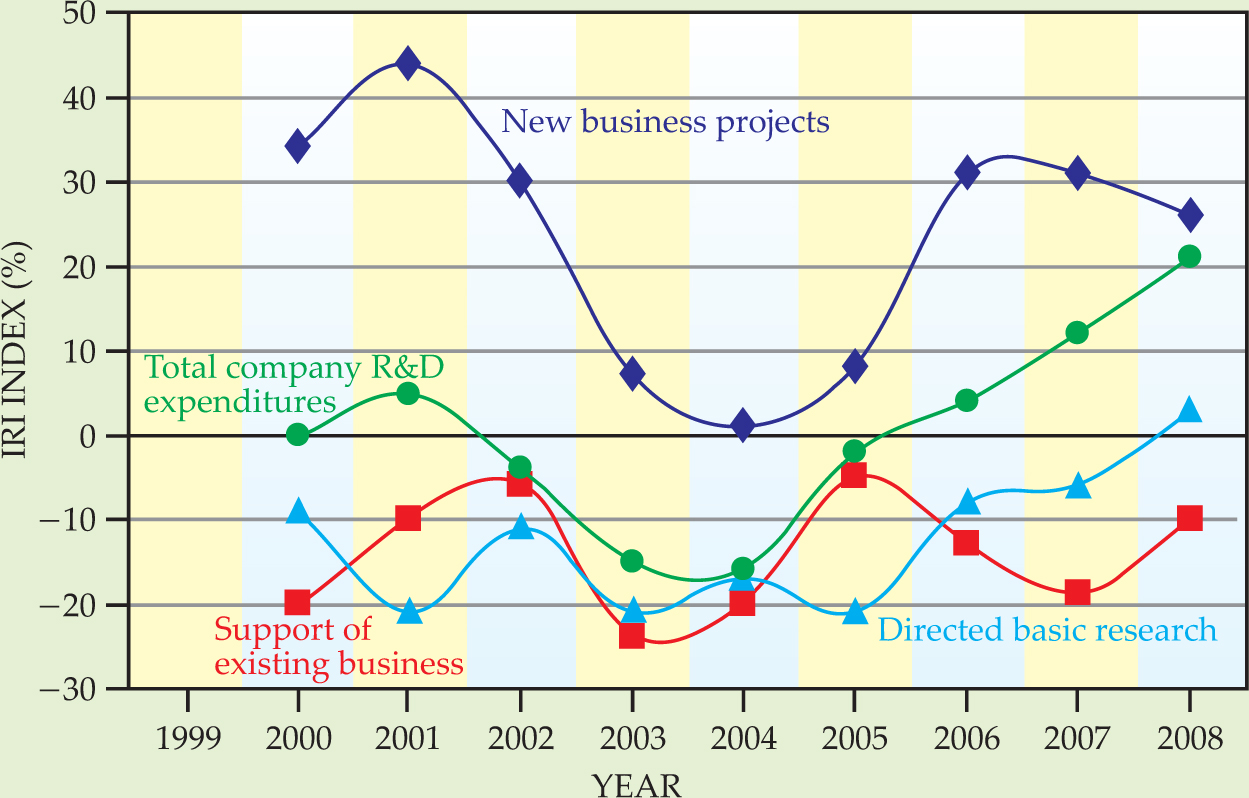
James Scinta, a manager at member company ConocoPhillips Co and author of the IRI survey report, says it is surprising to see companies continue to invest in R&D given mixed market signals related to the mortgage crisis, energy prices, and the weak dollar. Results are shown in the figure and
According to the report, industry will continue to redirect more R&D funds toward precompetitive university research, grants to academia, and partnerships with federal laboratories. Also for the first time this decade, the IRI companies plan to invest more in directed basic research initiatives. That projected increase, says Scinta, could be a response to inflation, but he speculates that companies might be focusing on basic research to spark innovation.
Some results from the 2008 R&D trends forecast for companies with R&D located in the US
| Relative change (% of respondents reporting) | ||||||
|---|---|---|---|---|---|---|
| Expected changes in 2008 compared with 2007 experience | Less than −5% | −5% to 0 | >0 to 2.5% | >2.5% to <5% | 5% to 10% | More than 10% |
| Total company R&D expenditures | 1 | 10 | 34 | 16 | 16 | 22 |
| Relative distribution of R&D costs | ||||||
| Support of existing business | 8 | 23 | 37 | 15 | 9 | 9 |
| Directed basic research | 1 | 8 | 61 | 17 | 7 | 7 |
| New business projects | 3 | 4 | 28 | 26 | 21 | 19 |
| R&D professional level | 3 | 9 | 45 | 24 | 14 | 5 |
| Hire new graduates | 0 | 12 | 44 | 32 | 8 | 5 |
|
How will 2008 compare with 2007 for the
following?
|
Decrease | Same | Increase | |||
| Targeted R&D/sales ratio | 11 | 39 | 20 | |||
| Grants, contracts, etc., for university R&D | 5 | 34 | 30 | |||
| Participation in consortia for precompetitive university research | 5 | 34 | 24 | |||
| Contracts with federal laboratories | 2 | 36 | 11 | |||
A scale of 1 to 6 was used, with 1 representing “significantly less” (less than –5%), 2 “slightly less” (-5% to 0), 3 “approximately the same” (0 to 2.5%), 4 “slightly more” (>2.5% to <5%), 5 “somewhat more” (5% to 10%), and 6 “significantly more” (more than 10%).
The 2008 sample size of 78 may not include all of the 101 companies that responded in 2007.
Some results from the 2008 R&D trends forecast for companies with R&D located in the US
Expected changes in 2008 compared with 2007 experience |
Less than −5% |
−5% to 0 |
>0 to 2.5% |
>2.5% to <5% |
5% to 10% |
More than 10% |
Total company R&D expenditures |
1 |
10 |
34 |
16 |
16 |
22 |
Relative distribution of R&D costs |
||||||
Support of existing business |
8 |
23 |
37 |
15 |
9 |
9 |
Directed basic research |
1 |
8 |
61 |
17 |
7 |
7 |
New business projects |
3 |
4 |
28 |
26 |
21 |
19 |
R&D professional level |
3 |
9 |
45 |
24 |
14 |
5 |
Hire new graduates |
0 |
12 |
44 |
32 |
8 |
5 |
How will 2008 compare with 2007 for the following? |
Decrease |
Same |
Increase |
|||
Targeted R&D/sales ratio |
11 |
39 |
20 |
|||
Grants, contracts, etc., for university R&D |
5 |
34 |
30 |
|||
Participation in consortia for precompetitive university research |
5 |
34 |
24 |
|||
Contracts with federal laboratories |
2 |
36 |
11 |
A scale of 1 to 6 was used, with 1 representing “significantly less” (less than –5%), 2 “slightly less” (-5% to 0), 3 “approximately the same” (0 to 2.5%), 4 “slightly more” (>2.5% to <5%), 5 “somewhat more” (5% to 10%), and 6 “significantly more” (more than 10%).
The 2008 sample size of 78 may not include all of the 101 companies that responded in 2007.

Total industry R&D expenditures have risen since 2004, as shown by the difference between the companies forecasting greater than 5% increases to their R&D budgets and the companies anticipating zero or negative growth. The index, which reflects year-to-year projected changes, also shows the first forecast of positive investments to directed basic research this decade.
(Adapted from J. Scinta, Res.-Technol.


