High-Redshift Supernovae Reveal an Epoch When Cosmic Expansion Was Slowing Down
DOI: 10.1063/1.1784264
Since 1998, overwhelming evidence has been accumulating that distant type Ia supernovae appear systematically dimmer than one would expect from their redshifts in a universe whose expansion is slowing down. One infers the distance of such a supernova from its apparent brightness, and its redshift is a direct measure of the total expansion of the cosmos since the light was emitted. The relation between redshift and distance over a large range of redshifts traces the history of cosmic expansion (see the article by Saul Perlmutter in Physics Today, April 2003, page 53 .)
The supernova data—bolstered by an imposing variety of other, less direct evidence—have led to an evolving consensus called the concordance model: It asserts that the cosmos is currently in an epoch of accelerating expansion driven by a pervasive dark vacuum energy dense enough to overcome the gravitational braking of all the mass in the universe. The model is agnostic about the nature of the dominating vacuum energy, so long as its pressure is sufficiently negative. Somewhat counterintuitively, general relativity asserts that negative pressure would act as a repulsive counterpoise to gravity on the cosmological scale.
The energy of ordinary electromagnetic radiation won’t do; its pressure is positive. The dark energy might be manifesting the optional cosmological constant Λ allowed by the field equations of general relativity. But the magnitude of Λ inferred from the observations is implausibly small by many orders of magnitude. Alternatively, the dark energy might be more dynamical, its density varying in time and space as imagined in a number of “quintessence” theories.
In any case, a cosmology dominated by vacuum energy of unknown character has profound implications for fundamental physics. So supernova observers have been at great pains to seek out, or eliminate, more prosaic astrophysical explanations for the anomalous faintness of high-red-shift supernovae—for example, obscuring dust or possible evolutionary differences between recent supernovae and those of earlier epochs.
Hubble haul
The recent report of 16 new type Ia supernovae discovered with the Hubble Space Telescope (HST) by a team led by Adam Riess of the Space Telescope Science Institute in Baltimore, largely forecloses such astrophysical alternatives to accelerated cosmic expansion. 1 The new supernovae also shed some light on the dark energy’s equation of state. Of the several hundred type Ia supernovae previously reported by groups seeking to trace the history of cosmic expansion, all but three had been discovered with ground-based telescopes. And the limitations of ground-based observation severely inhibit the discovery of supernovae with redshift z greater than one. The redshift parameter z = ▵λ/λ, where λ is the rest-frame wavelength of the emitted light.
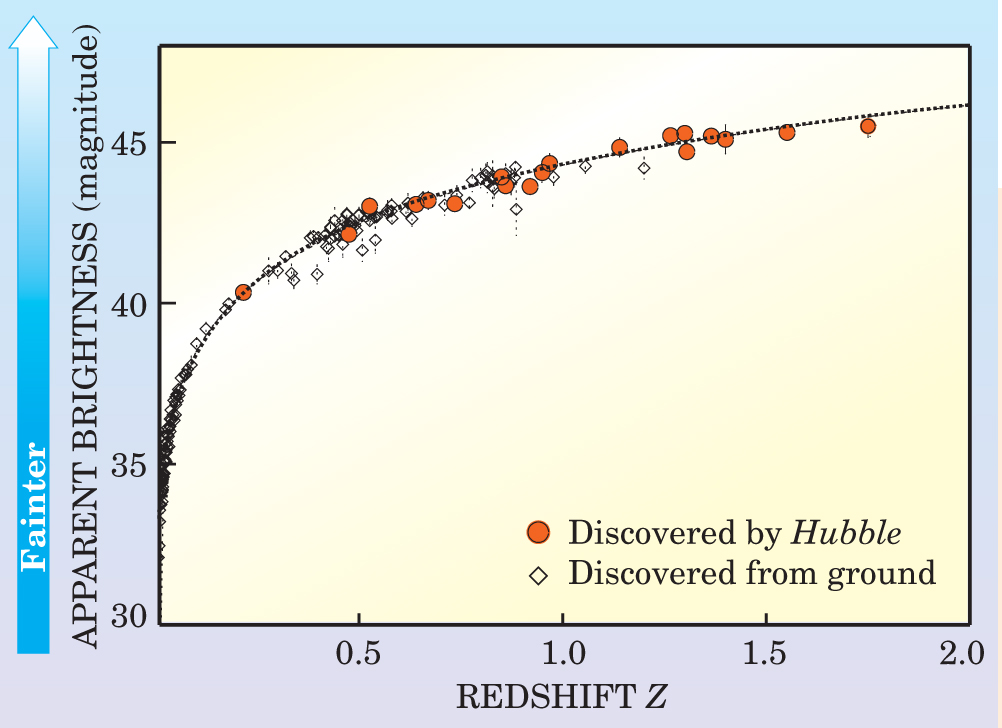
Figure 1 is the so-called Hubble diagram of apparent brightness (presumed to be a measure of distance) versus redshift for the 19 type Ia supernovae discovered with HST . The plot also includes a much larger sample of well-characterized type Ia supernovae, mostly at lower redshifts, previously found with ground-based telescopes.

Figure 1. Hubble diagram of type Ia supernovae plots redshift against apparent peak brightness, which is presumed to be a reliable indicator of distance. (Optical magnitude is an inverse logarithmic measure of brightness.) The 19 red points are for supernovae discovered with the Hubble Space Telescope. They extend to much higher redshifts than the older sample of well-measured type Ia supernovae found with ground-based telescopes. The curve is a theoretical fit to all the supernova data that yields the values Ωm = 0.29 and ΩΛ = 0.71 for the normalized cosmological densities of mass and dark energy.
(Adapted from ref. 1.)
In the cosmic expansion, the linear scale of the universe was 1/(1 + z) of its present value at the time of emission of light now redshifted by z. Looking at a z = 1 supernova explosion, we’re seeing an event that happened when the cosmos was half its present linear size. And we’re seeing the explosion slowed down by the same factor 1 + z. The peaking and waning of the supernova’s brightness monitored over a span of, say, 80 days actually took only 40 days in its rest frame. 2
From deceleration to acceleration
High-z supernova data are particularly important for constraining cosmological parameters and for establishing evidence of an earlier epoch inescapably predicted by all the dark-energy scenarios. The mean mass density of the universe falls with cosmic expansion like the inverse cube of the scale factor R = 1/(1 + z). But the density of any negative-pressure dark energy must fall more slowly. Therefore there must have been an earlier epoch in which attractive mass dominated over repulsive dark energy and thus slowed the cosmic expansion. For the case of Einstein’s cosmological constant, the dark-energy density is fixed for all time and the crossover from earlier deceleration to the present epoch of accelerated expansion would have been at a time roughly corresponding to z = 0.6. (It’s customary to use redshift as a model-independent marker of cosmological time.)
To find the hypothesized crossover time and determine the dark matter’s evolution and equation of state, cosmologists particularly prize type Ia supernovae with z > 1. The observer’s chief problem is that the spectra of such supernovae are significantly shifted to near-IR wavelengths at which Earth’s thermal glow makes ground-based observation of faint objects very difficult.
HST doesn’t have that problem, but it has others. Type Ia supernovae are rare. A large galaxy typically produces about one per century. Given the scarcity of time at ground-based telescopes, observing teams have had to devise search protocols that guarantee a harvest of supernovae for prescheduled follow-up observations. But the even greater scarcity of observing time on HST and the limited field of view of its cameras, have until recently precluded the space telescope from systematic supernova searches. The three type Ia supernovae discovered with HST before the present batch of 16 had all been found by serendipity (see Physics Today, June 2001, page 17 ) or during instrument commissioning.
Delivering the goods
Six of the new HST supernovae exceed z = 1. This unprecedented catch was made possible by three fortunate developments: First, the Advanced Camera for Surveys (ACS), with twice the field of view of its predecessor and five times its sensitivity in the near-IR, was installed during the March 2002 servicing mission. Second, that same mission refurbished the telescope’s NICMOS near-IR camera and multi-object spectrometer. Third, for almost a year starting in the summer of 2002, significant batches of HST time at regular intervals were dedicated to the Great Observatories Origins Deep Survey (GOODS) program.
Although the GOODS program was primarily aimed at questions of galactic evolution, it presented an enviable opportunity for Riess and company to tag along, discover type Ia supernovae, and monitor their light curves—the record of waxing and waning—in the weeks after discovery.
From August 2002 to the following May, the GOODS program took repeated images of two wide patches of sky at intervals of 45 days. The patches were big enough (10 × 15 arc-minutes each) and the exposures deep enough that one could expect to find one or two type Ia supernovae born in each 45-day interval. New supernovae were revealed by electronically subtracting the previous image from each new one. The relative intensities of a new supernova viewed through three different color filters gave a preliminary determination of its type.
A prearranged “piggyback” program provided HST observing time for follow-up measurements of each new supernova every few days for several months. The first task of these follow-ups was the taking of spectra to clinch the type Ia assignments and measure redshifts. Then one must determine the shape of each supernova’s light curve. That’s important because type Ia supernovae are not perfect standard candles. Their intrinsic peak luminosities range over roughly a factor of two. But, happily, that variation is tightly correlated with light-curve shape. So one can use an individual type Ia supernova’s light curve to calibrate its intrinsic luminosity. And, of course, the relationship between intrinsic luminosity and observed brightness is what determines distance.
The theoretical curve in figure 1 is characterized by two parameters, Ωm and ΩΛ, the mean mass and dark-energy densities of the cosmos, normalized so that, if their sum is precisely one, the cosmic mass-energy density has the critical value for which the geometry of the cosmos is flat (Euclidean). The subscript Λ recalls the Einstein cosmological constant. And indeed, first-approximation fits like that in figure 1 treat ΩΛ as constant. But the new HST supernova data make it possible to begin investigating the time dependence of the dark energy.
The widely accepted inflationary Big Bang scenario requires that the cosmic geometry be flat. Therefore the curve in figure 1 was fitted with the constraint that Ωm + ΩΛ = 1. The resulting best fit yields Ωm = 0.29 ± 0.04 and ΩΛ = 0.71, in good agreement with fits to earlier supernova data, observations of the cosmic microwave background, and large-scale galaxy surveys. The initially shocking assertion that there is dark energy, and that its density is about twice that of all forms of mass, has been the mainstay of the concordance model for some years now.
Mimicking acceleration
What if the distances assumed in the Hubble plot are systematically wrong? Obscuring dust might, for example, make the supernovae seem farther away than they actually are, thereby creating an illusion of accelerated cosmic expansion. That dust would have to be of a particularly sneaky kind, called gray dust, that does not reveal itself by reddening what it dims. 3 It’s also conceivable that high-z type Ia supernovae, coming from an epoch poorer in heavy elements than the present, are intrinsically less luminous than their more recent brethren. In that case also, observers would be overestimating distances at high z.
So long as the supernova data near and above z = 1 were meager, both of these alternatives to dark energy had some plausibility. But now, as shown in figure 2, they are largely excluded by the HST data. In this so-called residual Hubble diagram, the vertical axis denotes apparent brightness relative to what one would expect at a given z for an essentially empty cosmos (Ωm ≈ 0) with no dark energy. In such a plot, positive slope means accelerated cosmic expansion and negative slope means decelerated expansion—assuming that apparent brightness really does reflect true distance rather than spurious distance exaggerated by astrophysical dimming.

Figure 2. Residual Hubble diagram of type Ia supernovae plots the departure of apparent brightness from what’s expected for a given redshift in an essentially empty cosmos (Ωm = 0, ΩΛ = 0) with no spurious dimming due to dust or evolutionary differences between recent and ancient supernovae. Accelerated cosmic expansion is indicated by positive slope; deceleration by negative slope. Weighted data points in redshift bins are shown only to illustrate the full supernova sample. Their transition, near z = 0.5, from present acceleration to earlier deceleration is well fitted by the curve with cosmological parameters (Ωm = 0.3 and ΩΛ = 0.7. The supernova data starkly contradict the older model that presumed no dark energy ((Ωm = 1, ΩΛ = 0) and therefore perpetual deceleration. In such a cosmos, the effects of dust or monotonic supernova evolution might simulate acceleration in the recent epoch. But as the two upper curves show, they cannot simulate the transition to deceleration at higher redshifts.
(Adapted from ref. 1.)
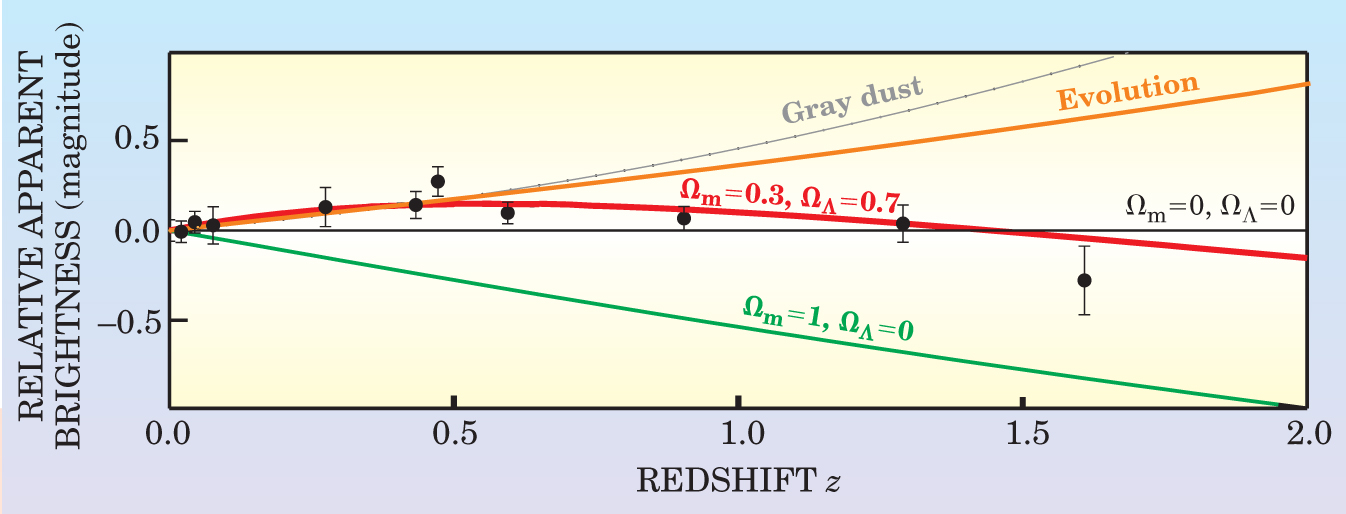
The top curves in figure 2 represent the illusory acceleration mimicked by gray dust or plausible evolutionary changes in supernova luminosity in a critical-density cosmos with no dark energy (Ωm = 1). Both are quite compatible with the data for z < 0.5. But with increasing z, they fail to follow the turndown of the data points and the concordance-model curve that fits them well.
The turnover point somewhere near z = 0.5 marks the transition from the earlier deceleration epoch to the current epoch of accelerating cosmic expansion. The bottom curve shows the perpetual deceleration one would expect to see in an Ωm = 1 cosmos without dark energy—assuming no mischievous dust or evolution. That now obsolete model, which was in fact the theorists’ preferred candidate before the first supernova evidence of cosmic acceleration was reported in 1998, bears no resemblance to the data beyond z = 0.1.
Riess and company have carried out a maximum-likelihood estimate of the transition redshift z t from decelerated to accelerated cosmic expansion. The result, z t = 0.46 ± 0.13, corresponds to a time roughly 5 billion years ago. That’s about 9 billion years after the Big Bang. “The Hubble data have given us conclusive evidence of this earlier epoch,” says Riess. “That’s a clear signature of dark energy, and we’re starting to learn how it behaves.”
The various conjectures as to what the dark energy might be are characterized by the equation-of-state parameter
How constant is dark energy?
For fixed w, general relativity dictates that the dark energy density fall like R −3(1 + w) as the cosmic scale factor R grows. Most quintessence models of dark energy introduce an additional time variation. Based on conjectured cosmic scalar fields slowly “rolling” down a potential-energy incline to a ground state, such models give w itself a potentially observable time derivative. Spatial inhomogeneities, on the other hand, are generally predicted to be imperceptible.
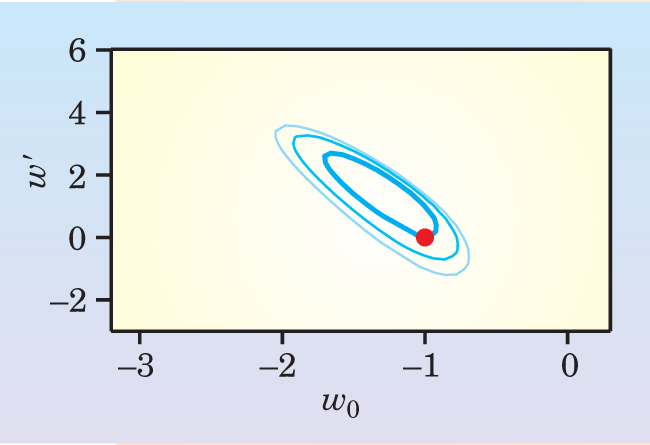
To extract information about the time dependence of the dark energy from the supernova data, Riess and company adopted the linear parameterization w(z) = w 0 + zw’, where w’ is the present value of dw/dz. Figure 3 shows the confidence-level contours in w 0-w’ parameter space resulting from the group’s maximum-likelihood fit to its entire sample of type Ia supernovae. The appropriate point for a cosmological constant (w 0 = −1, w’ = 0) lies just one standard deviation (68% confidence contour) from the best-fit values: w 0 = −1.31 and w’ = +1.48. Imprecise as it still is, this result cuts in half the parameter-space uncertainty area of recent analyses done without benefit of the HST data. At least, it appears to preclude very rapid variation of w in recent epochs.

Figure 3. The equation of state of dark energy is characterized by the parameter w, the ratio of its (negative) pressure to its energy density. The discovery of high-redshift type Ia supernovae with the Hubble Space Telescope makes it possible to examine whether w varies in time. The parameters w 0 and w’, denoting the present value of w and its redshift derivative, were measured by a maximum-likelihood fit to the HST and ground-based data represented in figure
(Adapted from ref. 1.)
In general relativity, it is usual to impose a lower limit of −1 on w. There is some dispute about whether that constraint is rigorously required. If w really is less than −1 and stays that way, our ultimate fate would be a “Big Rip,” in which particularly virulent cosmic expansion would eventually sunder the bonds of planetary systems, atoms, and even nuclei. 4
During the past year, both the Riess team and the Supernova Cosmology Project, led by Perlmutter (Lawrence Berkeley National Laboratory), discovered additional type Ia supernovae with HST that have yet to be reported. Starting this summer, NASA is making available to Riess’s team a year-long HST program called PANS (Probing Acceleration Now with Supernovae), similar to GOODS but this time dedicated to finding type Ia supernovae.
In the long run, detailed investigation of the dark energy by means of supernovae will probably require a purpose-built orbiting telescope like JDEM (Joint Dark Energy Mission), a proposal jointly sponsored by NASA and the US Department of Energy. But there’s little prospect of a JDEM launch before the end of the decade. “So we have to concentrate on HST —while it’s still fully functional,” says Riess. Without another servicing mission, that could be less than two years.
References
1. A. A. Riess et al.,Astrophys. J. (in press), available at http://arXiv.org/abs/astro-ph/0402512 ).
2. G. Goldhaber et al. (Supernova Technology Project), Astrophys. J. 558 359 (2001).https://doi.org/10.1086/322460
3. R. R. Knop et al. (Supernova Technology Project), Astrophys. J. 598, 102 (2003).https://doi.org/10.1086/378560
4. R. Caldwell, M. Kamionkowski, N. Weinberg, Phys. Rev. Lett. 91, 071301 (2003).https://doi.org/10.1103/PhysRevLett.91.071301


