Filming vortex lines reconnecting in a turbulent superfluid
DOI: 10.1063/1.3463701
The classical physics of turbulence in ordinary liquids is difficult enough. But turbulence in superfluids piles on its own special problems. Being manifestations of Bose–Einstein condensation, superfluids are subject to quantum constraints that might seem to thwart turbulence. (See the article by Joe Vinen and Russell Donnelly in Physics Today, April 2007, page 43 .)
Turbulence is largely characterized by the random formation of rotating eddies. So when Richard Feynman in 1955 suggested superfluid turbulence as a theoretical possibility, he had to address the constraint that the curl
Feynman argued that the superfluid component could exhibit rotational flow despite the required vanishing of curl v sf if the turbulence created quantized vortex lines—linear topological defects along which the superfluid component vanishes. He added that reconnection of such vortex lines, when two of them encounter each other, might solve a related problem: Once turbulence has begun in the superfluid component, how can it dissipate in the absence of viscosity?
It wouldn’t be long before Joe Vinen experimentally demonstrated turbulence in superfluid helium-4 and found that the contour integral
In that year Gregory Bewley, a Yale graduate student working in Daniel Lathrop’s lab at the University of Maryland, College Park, developed a technique for rendering quantized vortex lines in He II visible and recording their movement. (Liquid 4He cooled below its T c of 2.17 K is commonly called He II.)
“When Greg and I actually saw the first reconnection event,” recalls Lathrop’s student Matthew Paoletti, “it was a Eureka moment.” Now Paoletti, Lathrop, and theorist Michael Fisher have reported their analysis of some 40 000 vortex reconnection events “filmed” in turbulent He II with Bewley’s technique. 1
The observed reconnection dynamics agree well with what one expects if the principal determining parameter is the “quantum of circulation,” κ ≡ h/m. And the experiment has yielded the first clear evidence that a turbulent superfluid’s velocity distribution differs markedly from what one finds in classical turbulence.
Recording reconnections
In He II, the effective thickness of a quantized vortex line—the distance over which the superfluid component falls to zero—is just a few angstroms. The circulation

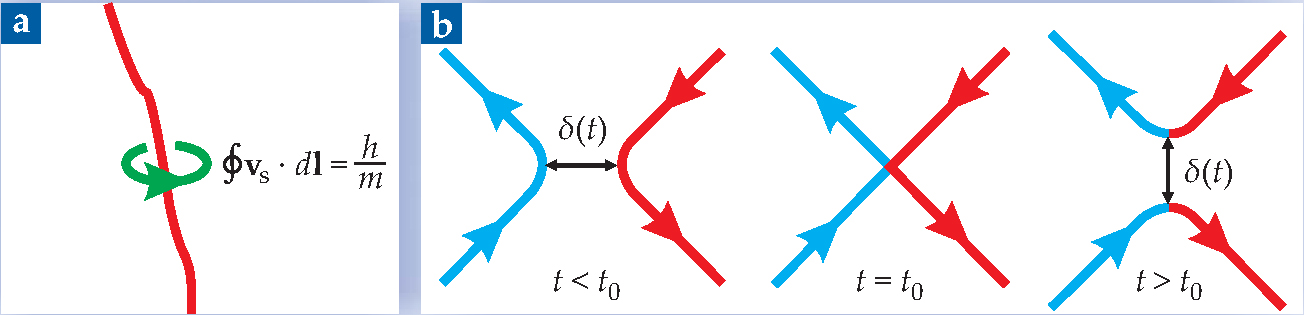
Figure 1. Quantized vortex lines in superflluids. (a) Circulation of superfluid around the vortex line is quantized so that the contour integral of its velocity around any loop enclosing one line is h/m, where m is the relevant boson mass for the particular superfluid. (b) Reconnection of two vortex lines at time t 0. The reconnection dynamics can be described by δ(t), the time dependence of their smallest separation. Colored arrowheads indicate the sense of the superfluid circulation around the vortex lines.
(Adapted from ref. 1.)
The reconnections Feynman envisioned, illustrated in figure
To create and visualize quantized vortex lines, the Maryland experimenters inject a room-temperature gas of 4He and a little hydrogen into quiescent liquid 4He just above its T c in a cryostatic vessel with portholes for laser illumination and filming. The injected hydrogen promptly freezes into a snow of reflective, micron-sized tracer particles. At that moment the team drops the temperature below Tc and begins alternately agitating the He II to turbulence and then digitally filming the tracer particles at about 80 frames per second as the superfluid relaxes back to quiescence.
As Lathrop and company reported in 2006, the tracer particles attach themselves firmly to the quantum vortex lines generated by the turbulence. 2 The pressure gradient that drives them there is a Bernoulli force. It reflects the minimization of kinetic energy when a particle displaces the fastest-flowing superfluid nearest the vortex lines. The particles themselves don’t participate in the circulation, because the superfluid, by its nature, exerts no shear force on them. Their micron size is a double bonus: It renders the lines visible with excellent resolution, and it does so with minimal effect on their dynamics.
In the newly reported experiment, Paoletti filmed the relaxation of turbulence in He II at various temperatures down to 1.7 K. In each cycle he generated turbulence by passing current through a heating coil at the bottom of the cryostat for 5 seconds. Because only the normal component absorbs heat, it alone is driven upward. But that convective flow displaces the superfluid downward in a counterflow that induces turbulence and generates a profusion of quantized vortex lines. Each time the heating current stopped, 10 seconds of filming began. 3
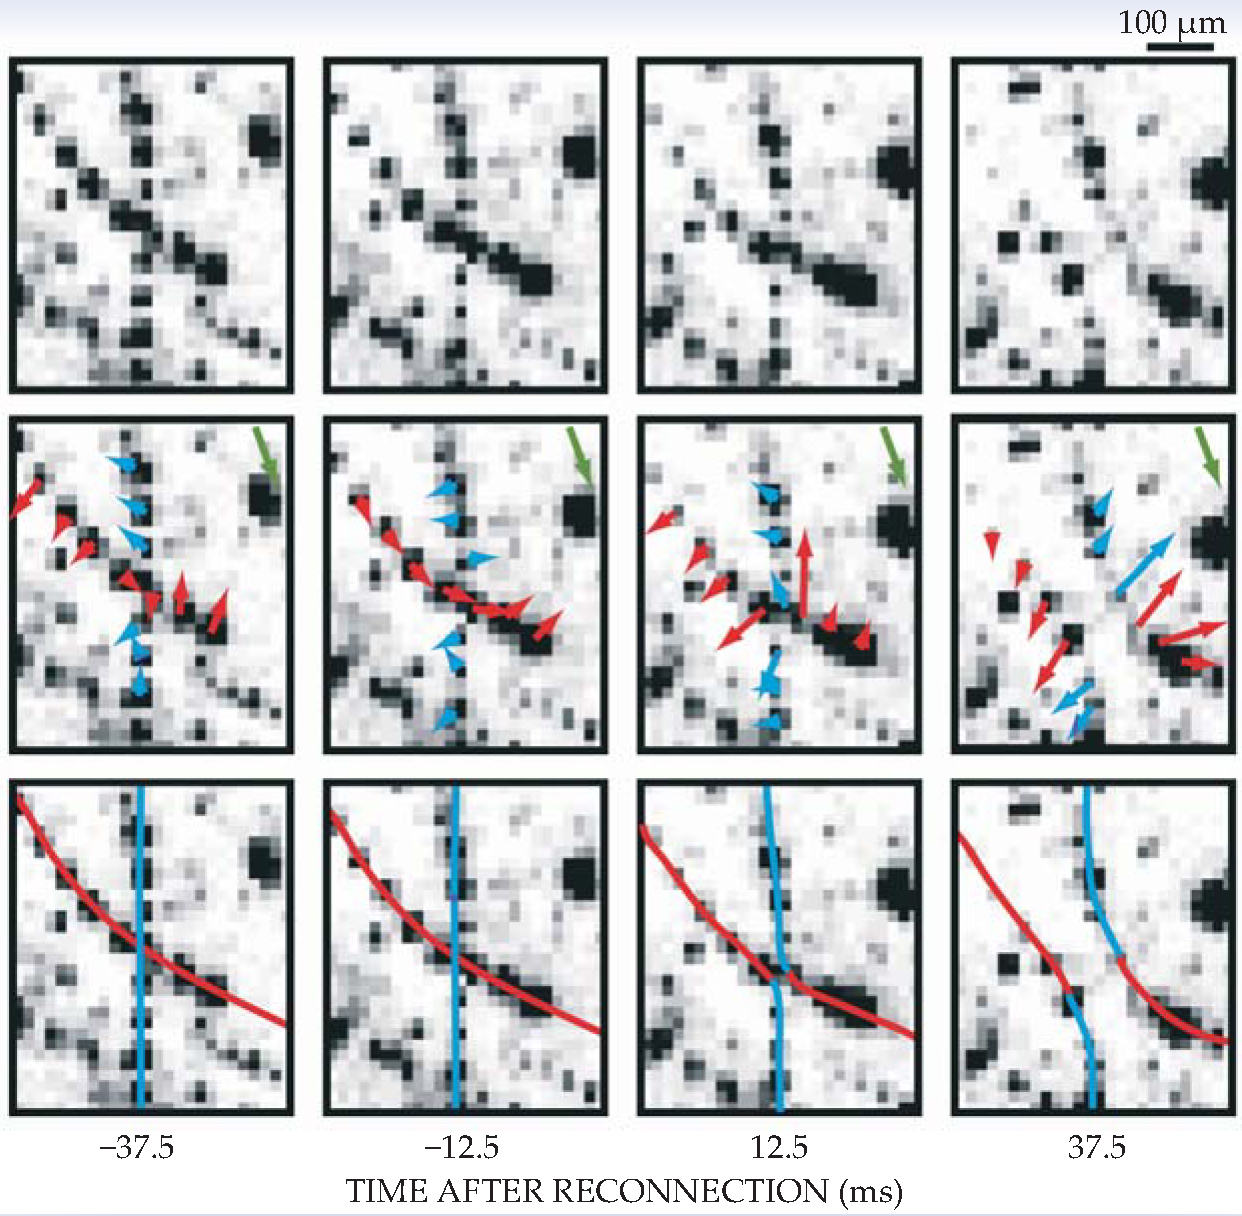
The reconnection analysis is based on about a thousand such minimovies. Figure 2 shows a close-up of one reconnection event, atypical only in that, for display purposes, this cycle was given an unusually high dose of tracer particles. Because the particles do have some small effect on the dynamics, one wants the minimum number that will do the trick.

Figure 2. Close-ups of a reconnection event in superfluid helium-4 digitally filmed in an experiment at the University of Maryland. Reflective tracer particles adhering to the reconnecting vortex lines make them visible in these negative images. In the middle row, the green arrow indicates the local background flow velocity, and the red and blue arrows give background-subtracted velocities for the two vortex lines whose reconnection is delineated by the colored curves in the bottom row.
(Adapted from
With almost a million digitized frames in hand, Paoletti needed an efficient search algorithm for finding event candidates. Reconnection events take about half a second, and they exhibit very fast approach and separation near the crossover point. So the algorithm sought out pairs of tracer particles whose separation either shrank or grew at least fourfold within 0.25 s. A hundred thousand such pairs yielded the 39 000 reconnection events on which the analysis is based.
Analyzing the dynamics
The principal record abstracted from each event was δ(t), the time dependence of the minimum separation between the two reconnecting vortex lines (see figure
where t 0 is the instant of reconnection and A is a dimensionless coefficient of order 1. The equation’s unphysical velocity singularity at t 0 makes it, at best, an asymptotic approximation. But it was deemed suitable for analyzing the Maryland experiment with its 0.01-second intervals between frames. And, indeed, the equation describes the data quite well. “That was our major finding,” says Lathrop. “But a rather broad event-to-event fluctuation in the value of A required further attention.”
The approximate validity of equation
Tentatively attributing the observed event-to-event fluctuation to environmental variables like the proximity of the nearest nonparticipating vortex line, the team fitted the data with a one-parameter correction factor appended to the idealized form of equation
yields the distributions of the free parameters A and c shown in figure 3.

Figure 3. Separately fitting each of the Maryland team’s 39 000 reconnection events with the free parameters of equation
(Adapted from
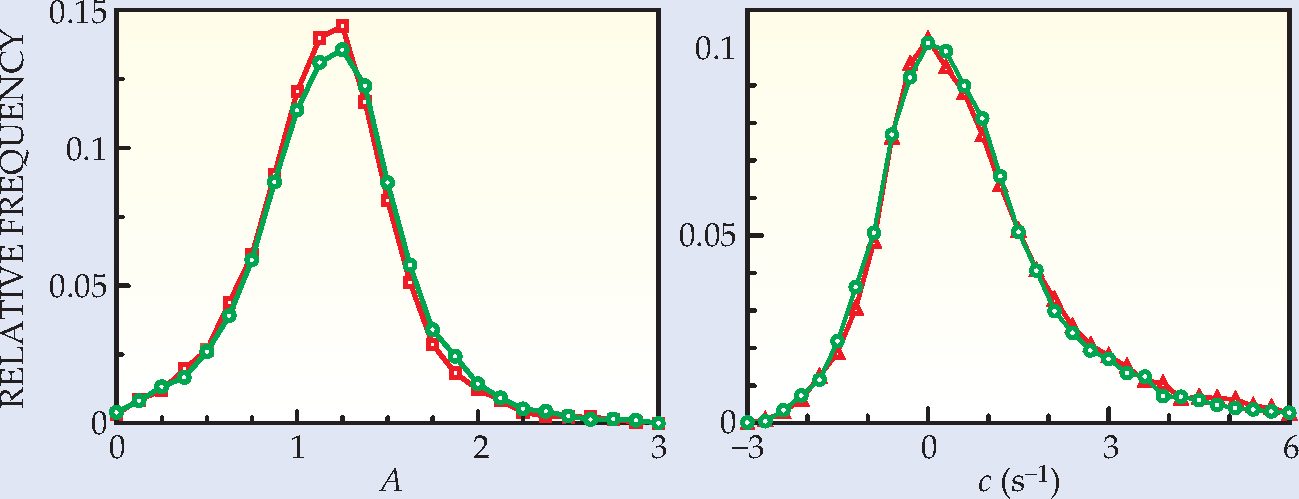
The rather broad A distribution peaks near 1, as expected. The c distribution peaks at zero, where the correction vanishes. But the mean-square value of c can be interpreted as reflecting a characteristic length, which turns out to be about 0.4 mm. That’s a typical spacing between vortex lines in the Maryland experiment, strengthening the idea that spectator vortices nearby are major sources of fluctuation. Temperature variations from run to run, on the other hand, appear to have little effect on the reconnection dynamics.
Dissipation and time reversal
For most events, the digitized data were not equally good before and after t 0. So the analysis divided the 39 000 reconnection events into two groups of roughly equal population: “forward” events, whose reconstruction was based primarily on movie frames before t 0, and “reverse” events based on post-t 0 frames. The separate curves in figure 3 for the two classes show essentially no distinction. This apparent time-reversal symmetry implies that—unlike magnetic reconnections—the reconnection of quantized vortex lines in superfluids generates little or no energy dissipation. The widely used Gross-Pitaevskii theoretical approximation of vortex reconnection in Bose fluids is explicitly time-reversal invariant.
How then can dissipationless reconnection contribute to the relaxation of turbulence in He II? In the two-component superfluid, a quantized vortex line can dissipate energy by friction as it moves through the normal component. But without reconnection, turbulence would produce a tangle of vortex lines so dense that no line could move. Feynman pointed out that reconnection would free up the tangle. In fact, he noted, vortex loops created in double-reconnection events could travel with particular ease.
At lower temperatures, other dissipation mechanisms must become important as the normal component dwindles. It’s thought that the twang of reconnection excites the vortex lines to helical wave motion whose highest-frequency components would dissipate energy by generating phonons in the superfluid even in the absence of a normal component.
“We haven’t tested how dissipation occurs near absolute zero,” says Fisher. “But what we have found, by looking for the first time with resolution good enough to see quantized vortices in action, is that superfluid turbulence is a new beast, quite different from the classical turbulence it appears to resemble at lower resolution.” In turbulent classical liquids, the distribution of velocities is essentially Gaussian. But for superfluids, the quantum theory predicts a much larger high-velocity population generated by reconnection.
Sure enough, Lathrop and company find that the velocity distribution—for all tracer particles, whether or not they’re involved in reconnections—has the 1/v 3 high-velocity tail implied by the reconnection dynamics.
References
1. M. S. Paoletti, M. E. Fisher, D. P. Lathrop, Physica D 239 , 1367 (2010).
2. G. P. Bewley, D. P. Lathrop, K. R. Sreenivasan, Nature 441, 588 (2006). https://doi.org/10.1038/441588a
3. A movie clip with reconnection events is available at http://prl.aps.org/epaps/PRL/v101/i15/e154501/paoletti_movie1.mov .


