Ecology is more chaotic than previously thought
DOI: 10.1063/PT.3.5075
For the past decade, ecologist Stephan Munch has been convinced that chaos must be more common in ecological systems than the prevailing wisdom suggests. Chaos, which is marked by an extreme sensitivity to initial conditions, emerges in complex nonlinear systems (see the article by Adilson Motter and David Campbell, Physics Today, May 2013, page 27 ). Ecosystems teeming with interacting species and influenced by the weather—itself chaotic!—seem to be prime candidates. But when Munch mentioned the possibility of chaotic ecological behavior to his colleagues at the University of California, Santa Cruz, one response was simply, “Didn’t we disprove that in the ’90s?”
The 1990s had indeed seen numerous studies reporting that ecological chaos was rare. Chaos was first introduced to the field two decades earlier in simple theoretical models from Robert May, John Beddington, and their colleagues. The expectation was that chaos could explain the observed fluctuations in animal population sizes. And so ecologists sought evidence of chaos in empirical data, a quest that reached a fever pitch in the 1990s and culminated in a 1995 meta-analysis that found evidence of chaos in only around 10% of the surveyed population time series—the regularly occurring counts of species’ population size at a given location. 1 After that, interest in the topic waned, and no similar analyses were conducted for over 25 years.

Chaos hides in ecological systems. Chaotic dynamics are characterized by an extreme sensitivity to initial conditions and unpredictable long-term behavior. Here, they are represented by the so-called cobweb plot—playfully rendered in the right spiderweb—which is a simple model of chaotic population growth. Although ecological chaos was deemed rare in the 1990s, a new study suggests that, actually, about a third of populations are chaotic. (Illustration by Tanya Rogers.)

In that time, however, the available data improved and expanded. After discussions with Munch, Tanya Rogers, a research ecologist who collaborates with him at the NOAA Southwest Fisheries Science Center laboratory in Santa Cruz, decided that the many new empirical data sets warranted a new analysis. Rogers, Munch, and his graduate student Bethany Johnson hunted for indications of chaos in 172 population time series—notably more than the 27 series in the 1995 study. They now find evidence of chaos in over 30% of the populations, and even that number is likely conservative. 2 The result suggests it may be time to reintroduce chaos into ecology.
One fish, two fish
For the new analysis, Rogers pulled data from the Global Population Dynamics Database (GPDD). 3 The online repository hosts annual counts of the mammal and bird populations at various sites, weekly counts of zooplankton and other marine fauna, and other details for over 1800 species. The GPDD was started in 1994 by the Natural Environment Research Council’s Centre for Population Biology at Imperial College London in collaboration with the National Center for Ecological Analysis and Synthesis at the University of California, Santa Barbara, and the University of Tennessee, Knoxville. It is the largest collection of population data in the world.
The handful of researchers and academics who manage the GPDD have gathered data from published literature and citation trails, data sets on the internet, professional contacts, and books, including long-out-of-print volumes. All data sets have at least 10 data points or 10 years of observation (typically those criteria are synonymous). Most are natural populations, meaning they are unmanaged by humans. And the GPDD team offers its subjective assessment of the data’s quality as a score from one to five.
The sort of population data the GPDD collects originates from academics and various government agencies with research interests and practical concerns, such as managing food and pest species and conserving endangered ones. The NOAA National Marine Fisheries Service, for example, annually assesses the populations of fish and marine mammals in the Atlantic Ocean, the Gulf of Mexico, the Pacific coast, Hawaii, Alaska, and the North Pacific. The reports include species’ geographic range, minimum-population estimates, population trends, and rates of human-caused deaths and injury, among other things. That information comes courtesy of a suite of technologies, including satellite tagging, drone imaging, acoustic sensing, and surveying on board research ships.

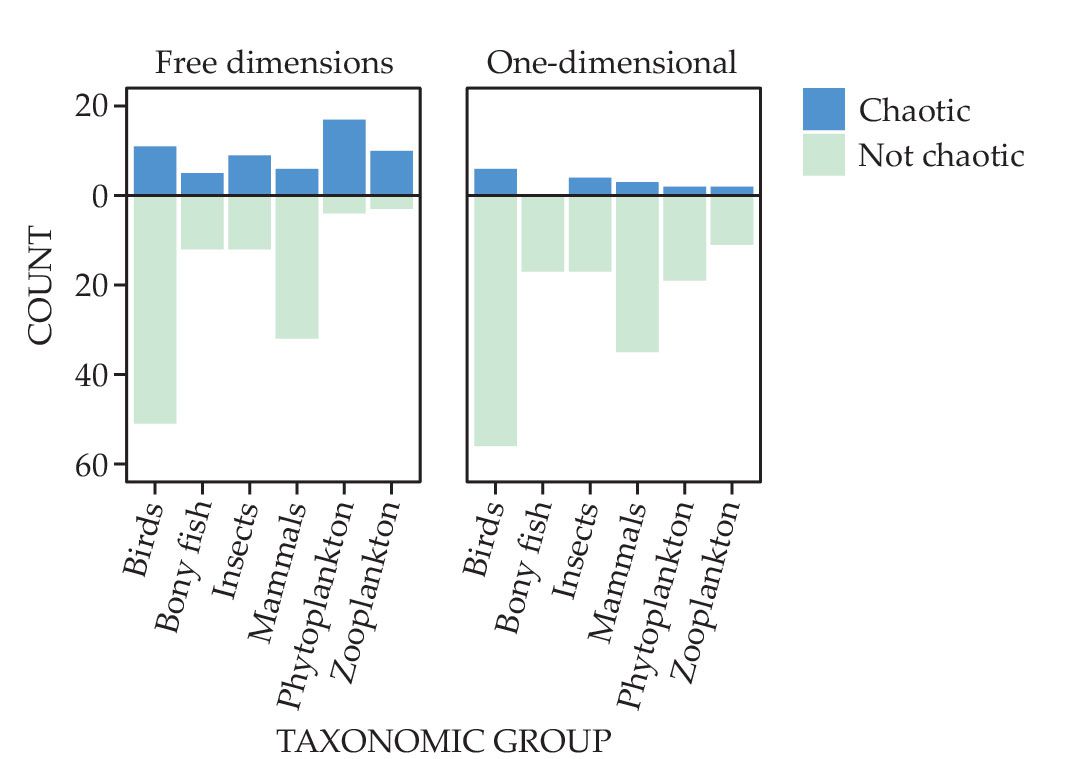
Population dynamics can be chaotic (top bars in blue) or nonchaotic (bottom bars in green). The number of chaotic populations identified varies dramatically with the choice of model used to fit the empirical data, particularly the model dimensionality. One-dimensional models (right), which are commonly used in ecology, identify fewer chaotic populations than models (left) that treat the dimensions—anywhere from two to six—as a fitting parameter for each data set. In the free-dimensions case, shorter-lived species, such as plankton and insects, demonstrate higher rates of chaos. Such species make up most of those on Earth and many of the populations people are interested in managing. (Adapted from ref.
To understand the population data, one must disentangle different categories of behavior: stable, with long-term predictability and return to equilibrium; chaotic, with only short-term predictability; and random, with complete lack of predictability. Any natural process has some amount of random fluctuation, if only as a result of the randomness of the environment around it. So methods must distinguish between inevitable noise and genuine chaos.
Exponential returns
How can one tell if a system is chaotic? In a model, the task is easy: Simply compare runs with minutely different initial conditions. If the trajectories converge over time, the system isn’t chaotic. If they diverge, it is. Of course, real-life ecosystems can’t be re-created with slightly distinct initial conditions. But a model can be fitted to experimental data and then analyzed for how much it converges or diverges—as quantified by negative or positive values, respectively, for the so-called Lyapunov exponent.
Chaos-detection models were largely developed for physical systems, such as chaotic fluctuations in laser emission, in which a small data set consists of thousands of data points with little error. In ecological observations, a typical time series is at best hundreds of data points with plenty of error. Only some of the existing detection methods would reasonably translate to ecology, and no studies had methodically analyzed which ones.
To figure it out, Johnson simulated chaotic, periodic, and other nonchaotic systems and generated population data similar in quantity and quality to that available in the field. She then tested how well different types of models identified which simulated data were chaotic. “We weren’t trying to estimate a Lyapunov exponent to six decimal places,” says Munch. “We just wanted to get the sign right most of the time.” The best three models, the very best of which has been around since the 1990s, were then deployed on the real field data. The researchers found chaos surprisingly prevalent among the birds, fish, insects, mammals, and plankton they tested, as shown in the figure on
Some species are more prone to chaotic behavior than others. Shorter-lived species, including most plankton and insects, have higher rates of chaos than longer-lived species, including most birds and mammals. That trend could be because longer-lived species are less sensitive to the chaotic environment. Or it could simply be a by-product of data limitations. Time series must be taken over longer periods to reach the same number of population generations for mammals as for insects, and in the short term, chaotic dynamics look predictable. The world is populated by far more short-lived species than long-lived ones, so the chaos around us may well be more than the approximately 30% the researchers found.
Managing expectations
So what did older analyses get wrong? One issue is the simplicity of their models: Even today, many ecology studies use one-dimensional models that account for only a single variable. In a 1D model of a crow population, for example, the rate of change in the number of crows depends solely on the current number of crows. A 2D model might add in a dependence on the current number of, say, spiders available to eat. As shown in the figure on
Another limitation in previous work was data availability. Species’ time series are longer now than they were in the 1990s. To get a sense of the influence of data time span, the researchers artificially truncated all the time series to 30 data points. In that case, they found that 24 of the 58 chaotic series were no longer classified as chaotic. On the other hand, for those series with 70 or more data points, 58% were chaotic.
Rogers explains that data limitations are still the biggest hurdle. The GPDD has more than 5000 time series for over 1800 species, but only the 172 she and her collaborators studied were of a sufficient length and quality to analyze. “Our study definitely highlights the value of long-term ecological data collection and increasing access to data,” says Rogers.
Whether a population is chaotic is not simply an academic or philosophical concern. Shorter-lived, disproportionately chaotic species make up many of the populations that people want to manage, either because they’re food sources, such as shrimp, or unwanted pests, such as algal blooms. Most management and conservation strategies are built around the idea of reaching and maintaining a stable equilibrium population, but that concept is meaningless for chaotic dynamics. Conservationists must instead find ways to leverage the short-term predictions still possible in chaotic systems.
Another open question is how climate change might influence the prevalence of ecological chaos. At a minimum, it’s likely to make chaos harder to detect, as the noise and disruptions render population dynamics—chaotic or not—more difficult to predict. As the environment changes and species migrate to more habitable climates (see Physics Today, September 2019, page 16 , and November 2020, page 17 ), how will their population dynamics change?
References
1. S. Ellner, P. Turchin, Am. Nat. 145, 343 (1995). https://doi.org/10.1086/285744
2. T. L. Rogers, B. J. Johnson, S. B. Munch, Nat. Ecol. Evol. 6, 1105 (2022). https://doi.org/10.1038/s41559-022-01787-y
3. J. Prendergast et al., Global Population Dynamics Database, Knowledge Network for Biocomplexity (2010), doi:https://doi.org/10.5063/F1BZ63Z8 .


