Climate modeling innovators are honored with half the physics Nobel
DOI: 10.1063/PT.3.4895

In 1946 John von Neumann at the Institute for Advanced Study in Princeton, New Jersey, began working on a project with meteorologist Carl-Gustaf Rossby: to predict the weather using one of the first programmable computers. Kristine Harper, a former meteorologist and now a historian of science at the University of Copenhagen in Denmark, says, “What von Neumann really had in mind was being able to control the weather, and the military was all over that.”
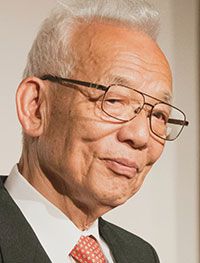
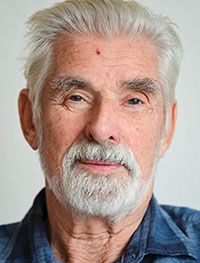
Syukuro Manabe BENGT NYMAN/CC BY 2.0 Klaus Hasselmann FABIAN BIMMER/REUTERS/ALAMY STOCK PHOTO

Jule Charney joined the project in 1948; he and von Neumann made some simplifying assumptions about the atmosphere’s density and disregarded vertical air motion to make the simulation more tractable. The result was the first numerical weather forecast, produced in 1950. Although it predicted a few things correctly, it was also beset with problems. Nevertheless, the rudimentary forecast inspired Joseph Smagorinsky, a US Weather Bureau meteorologist, to adapt the new numerical weather model for studying the climate.
To help with the task, Smagorinsky hired Syukuro Manabe, a recently minted PhD who arrived in Washington, DC, from Japan in 1958. Smagorinsky led the development of a three-dimensional model, and Manabe and his new colleagues got to work constructing a model of the atmosphere that accurately simulated radiative and convective processes. To assess the sensitivity of the atmosphere’s temperature to carbon dioxide, they simulated a doubling of its concentration and found that the surface temperature increased by 2.3 °C, which is close to today’s best estimate of 3 °C documented in the sixth assessment report of the Intergovernmental Panel on Climate Change (IPCC). 1
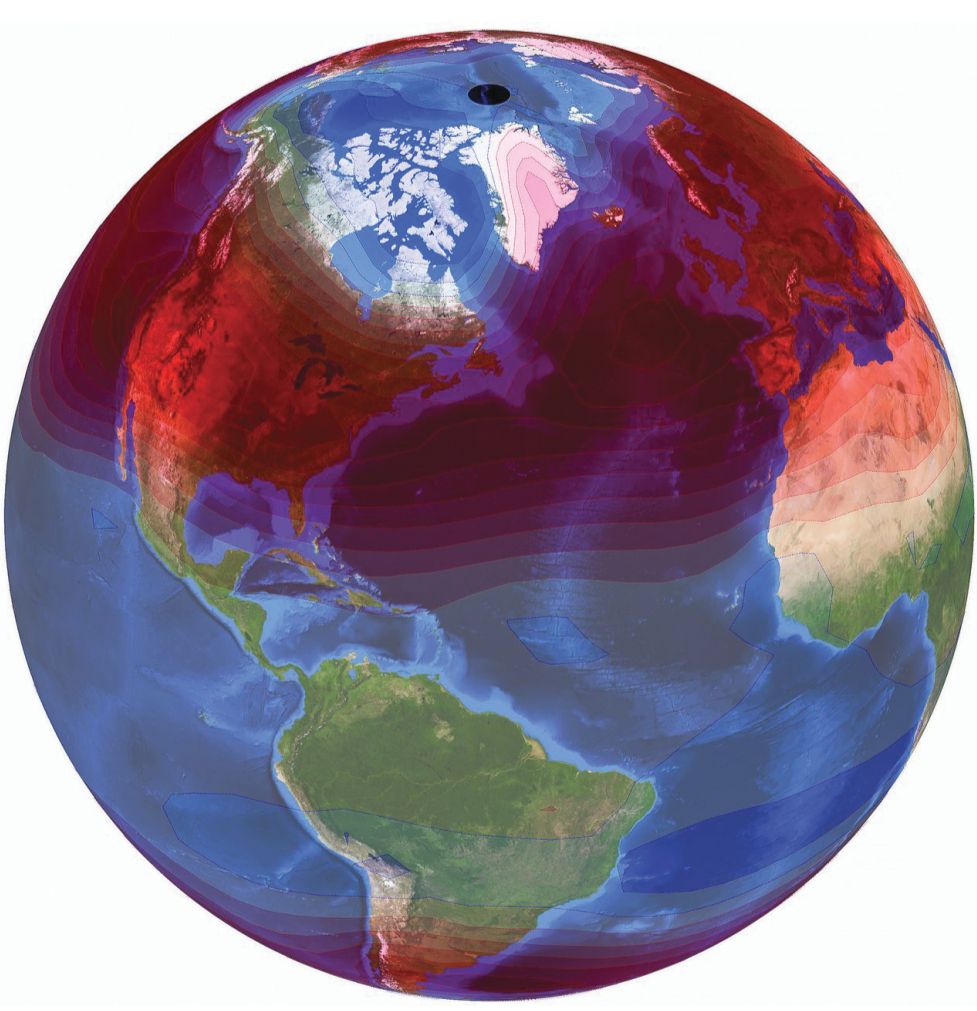
In the 1970s Klaus Hasselmann was working at the Max Planck Institute for Meteorology in Hamburg, Germany, to better analyze climate model results. He developed a stochastic model to simulate the semi-random, chaotic weather in climate models. Later he devised a statistical technique for finding the anthropogenic warming trend in climate data. The variability driven by human action, such as the midlatitude warming in figure
Figure 1.

Anthropogenic warming is characterized by, among other spatial patterns, a significant increase in midlatitude air temperature relative to the tropics. More intense solar radiation near the equator generates temperature and pressure gradients that transport excess heat poleward, as shown here by the concentrated red banding overlying northern Africa, Europe, and North America. Klaus Hasselmann was the first to recognize that unique spatial patterns could be used to detect and attribute the causes of climate change. (From B. D. Santer et al., Science 361, 245, 2018, doi:10.1126/science.aas8806 .)
For their foundational research in modeling and analyzing the complex system that is Earth’s climate, Manabe and Hasselmann were awarded half of this year’s Nobel Prize in Physics from the Royal Swedish Academy of Sciences. The other half was given to Giorgio Parisi for his work in understanding disordered systems (see page 17 of this issue).
“I’m very happy that they put the attention on the climate problem,” said Hasselmann in an interview with Nobel Prize Outreach’s chief scientific officer shortly after the announcement. Manabe told Physics Today, “I never expected to receive this prize. Looking at past winners of the Nobel Physics Prize, they did outstanding research in fundamental physics. Now they [the Nobel committee] may start awarding prizes in our field of Earth science, and I am very encouraged.”
Radiative-transfer model
The greenhouse effect of CO2 on Earth’s atmosphere was first recognized in the mid 19th century (see “Eunice Newton Foote’s nearly forgotten discovery ,” by Maura Shapiro, Physics Today online, 23 August 2021). Despite that early discovery, how Earth’s climate might be changing as a result of the CO2 that people were adding to the atmosphere failed to attract much serious attention. Many physical scientists argued that the ocean absorbed nearly all the additional CO2. Other scientists felt that the actions of humans were too insignificant to sustain a geological effect as consequential as changing Earth’s climate.
That mindset began to change in the mid 20th century. In 1953 Gilbert Plass took advantage of the advances in IR spectroscopy made during World War II to predict that more IR radiation would be absorbed in the atmosphere as more CO2 was added. Using oceanographic measurements, scientists determined that it takes on average 10 years for CO2 in the atmosphere to be absorbed by the ocean. (For more about the early history of climate science, see the article by Spencer Weart, Physics Today, January 1997, page 34 .)
Aware of Plass’s work, Manabe set himself the goal of simulating the greenhouse effect and Earth’s climate. He started with the planet’s radiation budget. Under radiative equilibrium conditions, incoming shortwave solar radiation is balanced by Earth’s outgoing longwave IR radiation. Manabe’s model used a few inputs—incident solar light, Earth’s average surface reflectivity, and the absorptivity of a few greenhouse gases, among others—and solved for the 1D vertical temperature profile of the atmosphere.
In a 1961 paper, Manabe and his collaborator Fritz Möller, a German meteorologist who visited the US from 1959 to 1960, calculated the vertical temperature profile of the atmosphere for various regions and seasons. 2 Despite the simple, 1D representation of the atmosphere, the first results roughly agreed with observations.
Convective adjustments
The vertical temperature profile in Manabe and Möller’s radiative equilibrium model lacked any adjustment that arises from the convective motion of the atmosphere. In a column of air with no convection, the temperature profile varies only by radiative transfer mediated by the greenhouse effect, at a rate of −15 °C/km.
In the real world, however, water vapor absorbs heat near Earth’s surface and condenses as it rises. That phase change helps drive vertical motion in the atmosphere and effectively transfers thermal energy from the surface in the form of latent heat. The observed rate is about −6 °C/km.
To account for the effect of water vapor in the radiative equilibrium model, Manabe and Robert Strickler, a meteorologist at NOAA’s Geophysical Fluid Dynamics Laboratory (GFDL), developed a convective adjustment that set the simulated lapse rate to the observed lapse rate. 3 “There were some pure radiative equilibrium calculations that people had done before, which don’t really get you in the ballpark because they’re not the right basic physics of the atmosphere,” says Nadir Jeevanjee, a research scientist at the GFDL. “Manabe imposed the temperature profile corresponding to convection, which we now know to be the right assumption.”
In 1967 Manabe and Richard Wetherald put all the pieces together to create a first-of-its-kind radiative–convective equilibrium model. 4 They allowed the absolute humidity—that is, the total mass of water in a given volume of air—to fluctuate over time. “When you warm the atmosphere, you want to let the absolute amount of moisture increase because that’s what it tends to do in the real world,” says Jeevanjee. “That was an innovation of the paper.”
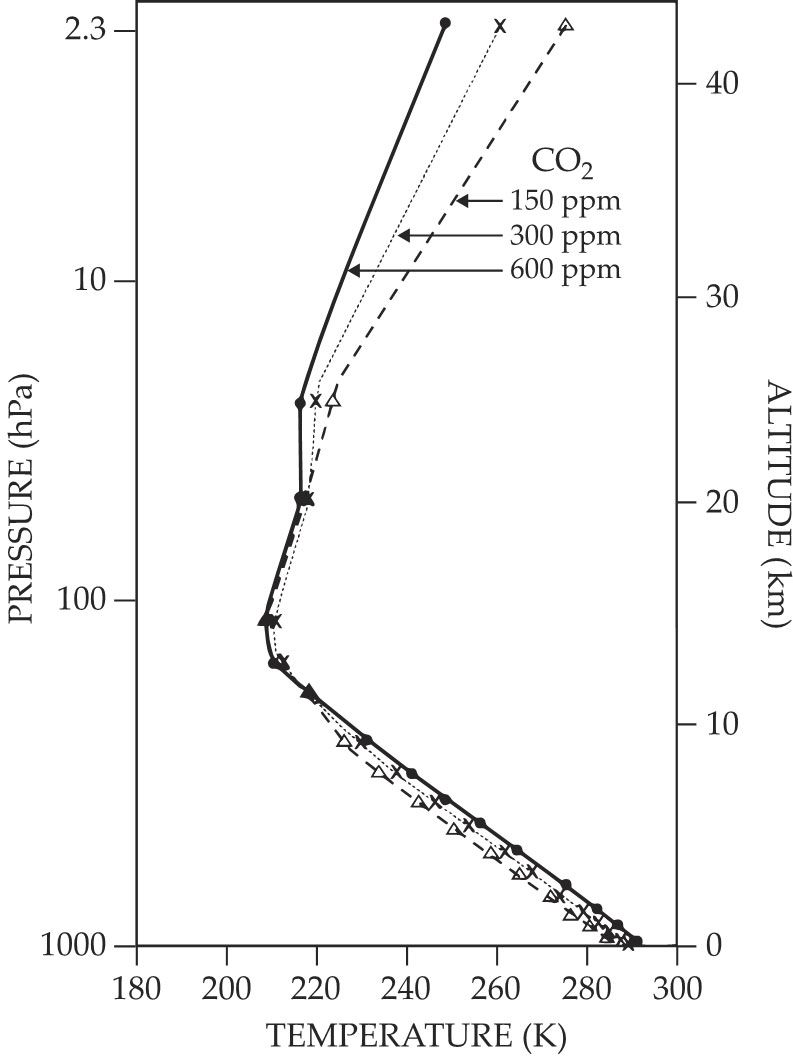
The critical result of the paper was its calculation of the climate sensitivity—an estimate of how much the atmosphere warms if the concentration of CO2 doubles, shown in figure
Figure 2.

Air temperature varies with pressure, or altitude, in the atmosphere and according to the concentration of various greenhouse gases. Syukuro Manabe and Richard Wetherald simulated atmospheric temperature in a simple radiative–convective equilibrium model and in 1967 reported the first quantitative results for how much the atmosphere warms when carbon dioxide doubles. (Adapted from ref.
Ronald Stouffer’s career at the GFDL overlapped with that of Manabe’s for about 20 years. He says that “one of [Manabe’s] many talents was his intuition, or scientific judgment. He was able to determine what you could throw out and what you should keep when you were developing a model.”
Analyzing climate models
While Manabe and other scientists were developing more realistic climate models, fundamental advances were being made in the understanding of weather. Edward Lorenz, a meteorologist who spent most of his career at MIT, found in 1963 that the results of a simulation, whether it’s modeling the atmosphere or some other physical system, can diverge widely for slightly different initial conditions and lead to unpredictable end states (see the article by Adilson Motter and David Campbell, Physics Today, May 2013, page 27 ).
Hasselmann knew of Lorenz’s work and wanted to better incorporate the chaotic nature of weather into climate simulations. He wrote an influential paper in 1976 introducing a model that simulates the climate probabilistically. 5
The stochastic model takes air temperature, wind velocity, and a few other climate variables and uses them in a state vector to describe a climate system. A set of prognostic equations then uses the values of those variables at some initial time to predict their value at future times. Hasselmann—trained in physics and mathematics—also added to his model a form of the Fokker–Planck equation, a partial differential equation that describes random forces and drag acting on particles. He used the equation to represent chaotic weather perturbations.
Hasselmann then turned his attention to looking in simulations for specific signals, particularly the human-induced global warming trend. Previously, scientists had compared the average surface temperature at a location with the time-varying temperature over the course of the simulation to assess whether there was any statistically significant change.
The location-based approach was challenging because of the magnitude and time scale of climate change. The signal of interest—that is, the gradual monotonic increase in Earth’s surface temperature—is almost always below the threshold of weather or natural variability in the climate system. On any given day, for example, weather conditions can cause the air temperature at some location to fluctuate by tens of degrees.
“Hasselmann’s insight was to look at the entire pattern,” says Benjamin Santer, an atmospheric scientist who recently retired from Lawrence Livermore National Laboratory. One such spatial pattern, or fingerprint, is that human-induced warming should manifest as a warmer lower atmosphere, where greenhouse gases are emitted, relative to a cooler upper atmosphere, where heat is lost to space. Observations and simulations, including Manabe and Wetherald’s 1967 work, 4 have yielded that fingerprint many times over.
A 1979 paper by Hasselmann, which Santer calls “the beginning point of the entire detection and attribution field” (see Physics Today, June 2021, page 19 ), stressed the importance of optimal detection. 6 That means looking not necessarily at where or when a signal of interest is strongest but where the noise is lowest or where and when the signal-to-noise ratio is highest.
Models show that the largest surface temperature change is occurring in the Arctic because of ice feedbacks. But the large natural variability there means that a more optimal fingerprint is the surface temperature change in tropical regions, where the natural variability is relatively small.
Hasselmann, Santer, Gabi Hegerl, and others in the field used the approach to identify changes in climate as measured in air temperature, ocean heat content, and other geophysical variables. When asked about working with Hasselmann, Hegerl recalls that “he was a great mentor, who encouraged us to be innovative, critical, curious, and think carefully about science, and he really enjoyed doing science, a joy that was contagious.”
Curiosity and fun
Since its founding in 1988, the IPCC, a body of the United Nations, has asked whether and how humans are causing climate change. The models first built by Manabe and the analysis techniques based on Hasselmann’s work have made it possible to answer that question with ever more accuracy and precision (see the article by Spencer Weart, Physics Today, September 2015, page 46 ).
In 1990 the first IPCC report stated that more information was needed, but by 1995 the success of fingerprinting analyses led the authors of the second report to conclude that the balance of evidence suggested a discernible human influence on climate. In its most recent report, released a few months ago, the IPCC concludes by consensus that the human fingerprint is “unequivocal.” 1 “To me,” says Santer, “that is all traceable back to Hasselmann, the 1979 paper, and his admonition to young scientists like me to look at patterns.”
Anthony Broccoli, a Rutgers University professor and long-time collaborator of Manabe, says of him that “what’s most remarkable is that at the age of 90, the enthusiasm for science and his excitement in talking to people about science is undiminished.” In January 2020 Manabe and Broccoli published a book titled Beyond Global Warming: How Numerical Models Revealed the Secrets of Climate Change, which details how Manabe came to understand the climate system (see Physics Today, September 2020, page 54 ).
On the day of the Nobel Prize in Physics announcement, Manabe said at a Princeton University press conference, “I never imagined that this thing I would begin to study would have such huge consequences. I was doing it just because of my curiosity.”
References
1. V. Masson-Delmotte et al., eds., Climate Change 2021: The Physical Science Basis—Contribution of Working Group I to the Sixth Assessment Report of the Intergovernmental Panel on Climate Change, Cambridge U. Press (in press).
2. S. Manabe, F. Möller, Mon. Weather Rev. 89, 503 (1961). https://doi.org/10.1175/1520-0493(1961)089<0503:OTREAH>2.0.CO;2
3. S. Manabe, R. F. Strickler, J. Atmos. Sci. 21, 361 (1964). https://doi.org/10.1175/1520-0469(1964)021<0361:TEOTAW>2.0.CO;2
4. S. Manabe, R. T. Wetherald, J. Atmos. Sci. 24, 241 (1967). https://doi.org/10.1175/1520-0469(1967)024<0241:TEOTAW>2.0.CO;2
5. K. Hasselmann, Tellus 28, 473 (1976). https://doi.org/10.3402/tellusa.v28i6.11316
6. K. Hasselmann, in Meteorology Over the Tropical Oceans, D. B. Shaw, ed., Royal Meteorological Society (1979), p. 251. Available at https://pure.mpg.de/rest/items/item_3030122_2/component/file_3030123/content .
More about the authors
Alex Lopatka, alopatka@aip.org


