A Puzzling Increase in Earth’s Oblateness
DOI: 10.1063/1.1522155
Axial rotation causes Earth to protrude slightly at its midsection. While scientists have long known the magnitude of Earth’s oblateness, only since the 1970s have they been able to monitor minute changes in it, thanks to the global view provided by satellites. Such changes in the equatorial bulge reflect large-scale redistributions of mass. For example, the satellite measurements can detect such small effects as the seasonal movements of air masses in the atmosphere and the transport of water among oceans, atmosphere, and land.
On top of seasonal signals, the measured oblateness has shown a slight downward trend over the years, amounting each year to a few tens of parts per billion. Geophysicists attribute the decrease principally to postglacial rebound: Since the polar ice sheets melted away at the end of the last ice age about 10 000 years ago, the underlying mantle has been springing back up in a process that continues today. Postglacial rebound is slowly restoring Earth to a more spherical mass distribution.
The tidy picture has now changed with the recent observation that, sometime around 1998, Earth’s oblateness reversed its downward slide and began to increase, as seen in the figure on page 18. “That was something we didn’t expect,” commented geophysicist Bruce Buffett of the University of British Columbia. Christopher Cox and Benjamin F. Chao of NASA’s Goddard Space Flight Center reported the surprising behavior in a recent paper. 1 Several other groups, using different analyses of the same data, have also seen indications of the same effect.

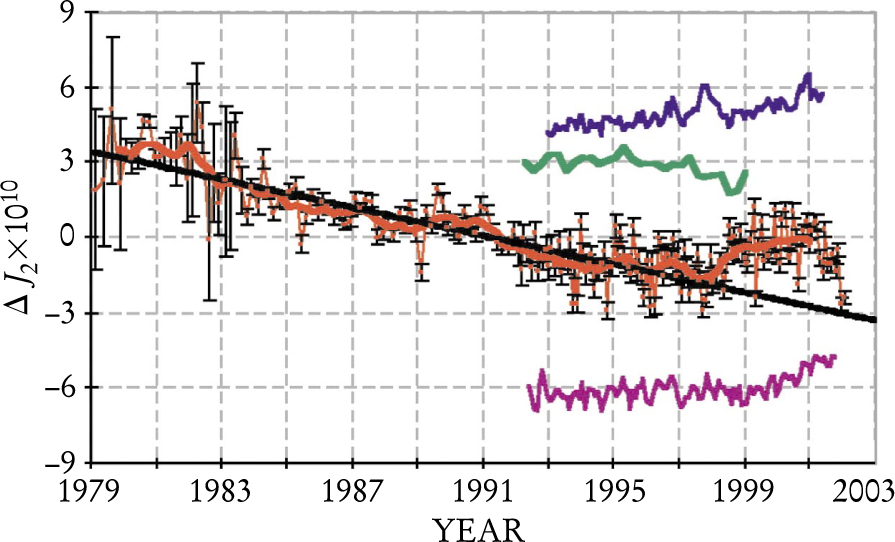
Changes in Earth’s oblateness since 1979. ΔJ 2 is the oblateness after subtraction of the mean, tide-free value and removal of atmospheric and seasonal effects. The downward slope of 2.8 × 10⁻¹¹ per year was interrupted around 1998 by an abrupt increase. The thin red line connects the monthly data points, and the thick red line is a running average. The black line shows a weighted fit to the data before 1997. The offset green curve is the value of ΔJ 2 estimated to be caused by polar-ice melting, as inferred from satellite altimetry data. The blue and purple curves depict values of ΔJ 2 expected to result from ocean redistributions, as inferred from sea-level change that is either uniform (blue) or geographically distributed (purple), but not corrected for thermal expansion.
(Adapted from ref. 1.)
What mass movement could cause so abrupt an effect? That question has sent geophysicists rushing to their computers and databases. In their paper, Cox and Chao surveyed some possibilities: melting of polar ice or mountain glaciers, global sea level rise and mass movements within the oceans, and even material flows within Earth’s fluid outer core. They discussed the evidence for and against each. Various researchers are now exploring some of these scenarios, and a few are coming up with new ideas. Undoubtedly, many of these scenarios will be aired in journal articles and conference reports in the near future.
Inferring Earth’s shape
Qualitatively, oblateness describes the deviation of the gravity field from that of a perfect sphere. Quantitatively, it is a dimensionless number that’s proportional to the difference between the moment of inertia about Earth’s rotational axis and the average moment of inertia about equatorial axes. For Earth, the mean, tide-free oblateness, designated as J 2, is 1.082627 × 10⁻³.
To measure J 2 by a technique known as satellite laser ranging, researchers send a laser pulse from one of several dozen ground stations worldwide toward one of a number of passive, dedicated satellites with retroreflectors. The time for the laser beam to bounce back to the station determines the range of the satellite. From a large collection of such data points, one can determine the exact orbits of each of the satellites, and from those orbits, one can in turn extract the spherical harmonic components of Earth’s gravity field. J 2 is the coefficient of the largest nonspherical term. Higher-degree terms give more details about the mass distribution but are also more difficult to determine.
The figure shows the trend in oblateness measured since 1979. The mean value has been subtracted, as have seasonal, most tidal, and atmospheric effects. Clearly, something happened around 1998 to disrupt the downward trend. It may be the start of an upward slope, or it could be just a bump. Chao said he and his colleagues are eager to see the next few years of data points.
Possible causes
Any scenario to explain the recent increase in J 2 must involve a transport of mass from high to low latitudes. For example, the melting of Antarctic and Greenland ice would carry mass from high latitudes to the ocean at lower latitudes. The shrinking of mountain glaciers, which has been accelerating in recent years, might have a similar effect. In either case, one can estimate the amount of ice that would have to melt to produce the observed redistribution and the rise in global sea level that would result, assuming that the melted water, to first approximation, spread uniformly. In their paper, Cox and Chao concluded that the two scenarios were inconsistent with the changes in sea level and ice height that have been observed by satellites. However, sea-level changes are dominated by thermal expansion at most locations, and other effects might well be camouflaged.
Another possible cause of increased oblateness might be the redistribution of water mass within the ocean. This scenario demands a close examination of data gathered by oceanographers. Interestingly, remarked Victor Zlotnicki of NASA’s Jet Propulsion Laboratory, oceanographers have not traditionally been concerned with Earth’s mass distribution, so this is a new question for them. A number of researchers are now taking a different look at the sea-level heights that have been monitored by the US–French TOPEX/Poseidon satellite and at the numerical models that assimilate these and other oceanographic data; the scientists are trying to remove the effect of thermal expansion and examine the changes in mass distributions.
Still another possibility is that geomagnetic processes could have driven a flow of mass in Earth’s fluid outer core. But geophysicists such as Buffett suspect that the flow would have to be unrealistically large to produce a noticeable flattening of Earth.
Other influences?
Could the oblateness increase have anything to do with the El Niño of 1997–98, which was the strongest one of the 20th century? As Cox and Chao point out, the possibility is intriguing, but arguing against it is the longevity of the oblateness anomaly compared to the more transient time scale of El Niño. Also, El Niño primarily transports water mass in the east–west, rather than north–south, direction.
R. Steven Nerem of the University of Colorado, Boulder, and his collaborators are looking at the possible role played by another recurring meteorological pattern known as the Pacific Decadal Oscillation.
One can’t overlook the possibility that the increase in oblateness is an artifact introduced by the data analysis, warns Byron Tapley of the University of Texas, Austin. Do the models, for example, properly treat the inelasticity of Earth and hence the shape of the deformation caused by tidal pulls?
More light will certainly be shed on this puzzle in the next year as data come in from the Gravity Recovery and Climate Experiment (GRACE), a five-year mission co-sponsored by NASA and the German Aerospace Research Center (DLR); Tapley is the principal investigator. The two GRACE satellites launched last March will map variations in Earth’s gravity field with an expected spatial resolution that’s three orders of magnitude better than those provided by satellite laser ranging. The mission should enable far more accurate measurements of the higher-degree spherical harmonic coefficients (J 3, J 4, and so forth), to provide more details about Earth’s mass distribution.
References
1. C. M. Cox, B. F. Chao, Science 297, 831 (2002).https://doi.org/10.1126/science.1072188


