A droplet that won’t freeze harbors a crystal that won’t melt
DOI: 10.1063/PT.3.3317
To the casual observer, the tiny crystal of gallium visible in the adjacent figure might seem remarkable primarily for its scale, just 40 nm—roughly 100 atoms—in diameter. But for the University of Western Australia’s Alexandra Suvorova, who took the transmission electron microscope (TEM) image, the bigger surprise was that the speck of frozen Ga was there at all. According to the metal’s phase diagram, the observed crystalline structure—a hexagonally packed arrangement known as the γ phase—occurs only at temperatures below 236 K, far cooler than the ambient temperature at which the image was taken.

A buried gem. At the core of the molten gallium nanodroplet shown here, the metal adopts a crystalline form known as the γ phase. The liquid and solid phases coexist over a temperature range of more than 600 K. Interactions between the droplet and the underlying sapphire substrate are thought to cause the anomalous behavior. (Adapted from ref.
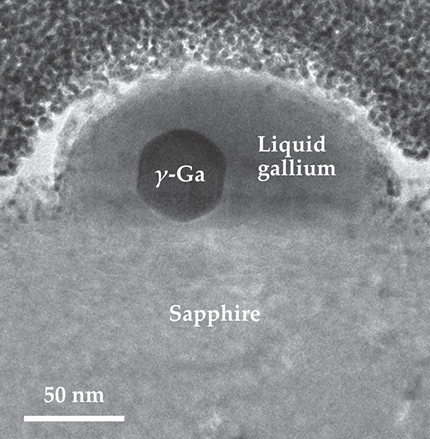
Moreover, the diminutive lump of solid is enveloped in a shell of molten Ga, which seems to fly in the face of conventional rules of thermodynamics. Those rules stipulate that at a fixed pressure, a pure substance’s liquid and solid phases can coexist at precisely one temperature, the melting point. For Ga at atmospheric pressure, that temperature is around 303 K, several kelvin hotter than Suvorova’s droplet. Even when the droplet is chilled below 200 K or heated to 800 K, it retains its two-phase character. The finding, 1 newly reported by a team led by Maria Losurdo (CNR-NANOTEC, Bari, Italy) and April Brown (Duke University), has theorists scratching their heads.
Nicola Gaston, a physicist at the University of Auckland, has been studying metal nanoparticles for more than a decade and says she’s never seen anything quite like it. Experiments have generated indirect evidence of coexistence, she says, “but they’ve never produced anything so clear as this.”
Gaston adds that the earlier experiments tended to suggest solid–liquid coexistence in small temperature windows of “maybe 5 K or 10 K.” Those observations fit with the predictions of numerical models that account for finite-size effects that become significant at nanometer length scales. 2 But the models can’t explain the 600 K coexistence range observed for the Ga nanodroplets.
Losurdo and her colleagues suspect that the unusual behavior is related to the droplet’s interactions with the underlying sapphire support. Because sapphire’s crystalline lattice nearly matches that of γ-Ga in size and shape, the partial crystallization of Ga at the sapphire surface would relieve interfacial stress and reduce the droplet’s energy—even at temperatures ordinarily too high for the solid to exist. At the droplet’s outer surface, the high energetic cost of forming a gas–solid interface would prevent the liquid shell from completely freezing.
When collaborating theorist Kurt Hingerl (Johannes Kepler University Linz) modified standard energy-balance equations to include those surface effects, he got results consistent with the group’s working hypothesis. Follow-up experiments provided yet more supporting evidence: Solid cores failed to materialize in Ga droplets deposited on amorphous glass instead of sapphire. Still, Hingerl acknowledges, the team’s theoretical model remains incomplete. It doesn’t explain, for instance, why only a small fraction of the Ga along the sapphire boundary crystallizes, despite energy balances that indicate an overwhelming preference for the solid–solid interface.
As Gaston sees it, however, the TEM images alone are reason enough for excitement. Interfaces buried in the interiors of metal nanoparticles are both notoriously difficult and important to study. Understanding how they form and evolve is crucial to deploying the particles in phase-change memories, nanoplasmonics, and other applications. (For more on metal nanoparticles, see Physics Today, June 2007, page 26 .) Losurdo and her colleagues aren’t the first group to use TEM to tackle that problem, but they were able to achieve exceptional resolution—high enough, for example, to confirm theoretical predictions that Ga’s solid–liquid interfaces are not atomically abrupt but roughly four atoms thick.
“The quality of the experimental images is fantastic,” comments Gaston. “Soon we’ll be able to combine these kinds of experiments with theory to start sketching out phase diagrams at the nanoscale.”
References
1. M. Losurdo et al., Nat. Mater. 15, 995 (2016). https://doi.org/10.1038/nmat4705
2. A. Aguado, M. F. Jarrold, Annu. Rev. Phys. Chem. 62, 151 (2011). https://doi.org/10.1146/annurev-physchem-032210-103454


