Vehicle design and the physics of traffic safety
DOI: 10.1063/1.2180177
”We tacitly agree to accept a certain level of carnage in order to use the highways in ways we value. At the present time in the US, this tacit agreement says that it is acceptable to sacrifice between 40 000 and 42 000 lives annually.” So said Patricia Waller, then director of the University of Michigan’s Transportation Research Institute, in 2001. 1
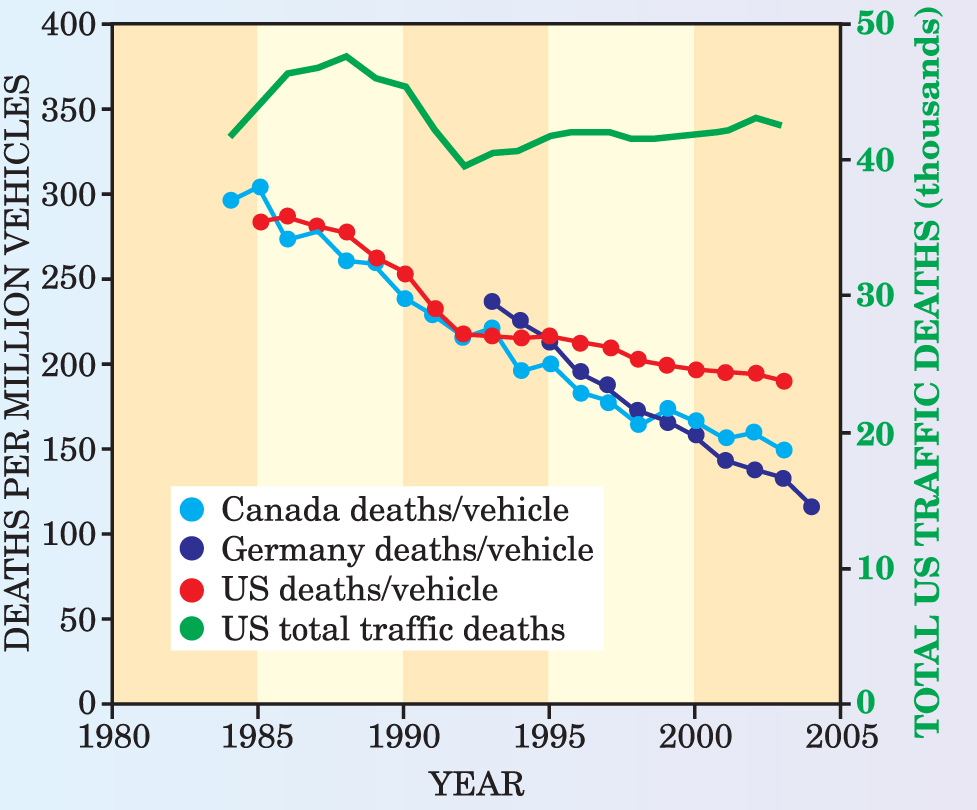
In 2004, the death toll was 42 636. Traffic crashes (see, for example, figure 1) are now the leading cause of death for young people in this country. 2 We rightly congratulate ourselves, our governments, and automobile manufacturers for reducing the danger per vehicle and per vehicle mile. But we can be accused of tolerating the appalling present rate of traffic deaths shown in figure 2. As the figure shows, Germany and Canada, which have more effective programs for reducing traffic injuries, are achieving impressive results.

Figure 2. Downward trend of traffic deaths (including pedestrians and pedalcyclists) per million vehicles (left axis) in the US, Canada, and Germany includes pedestrian and pedalcyclist fatalities. Total US annual traffic deaths (top curve, right axis) has been trending upward since the early 1990s.
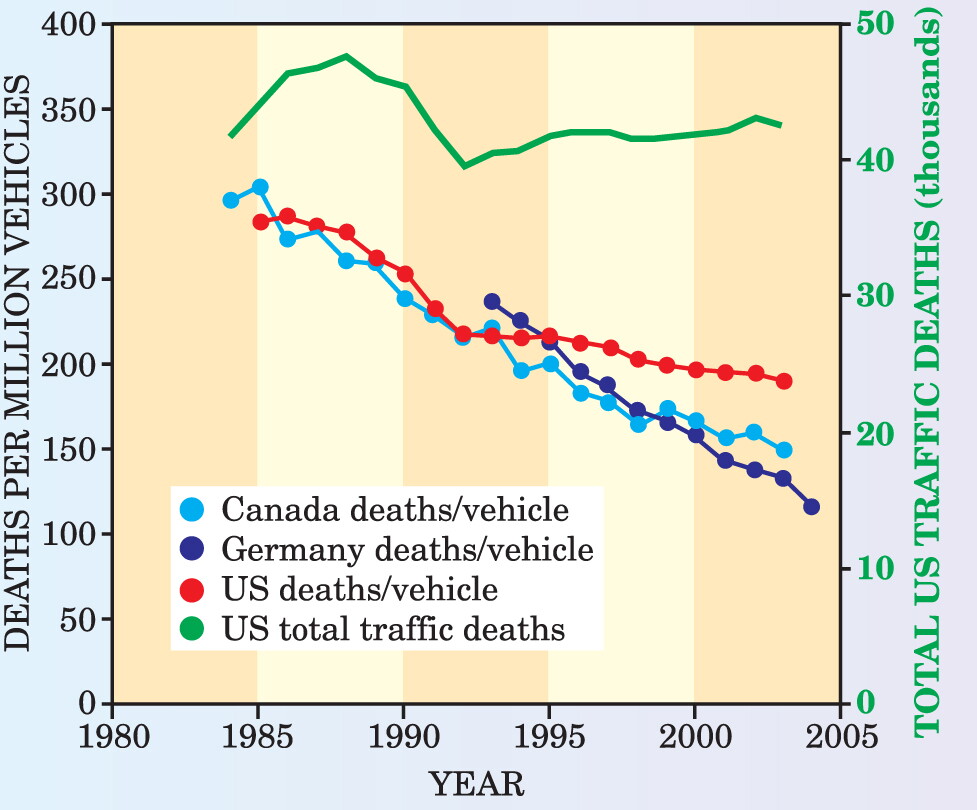

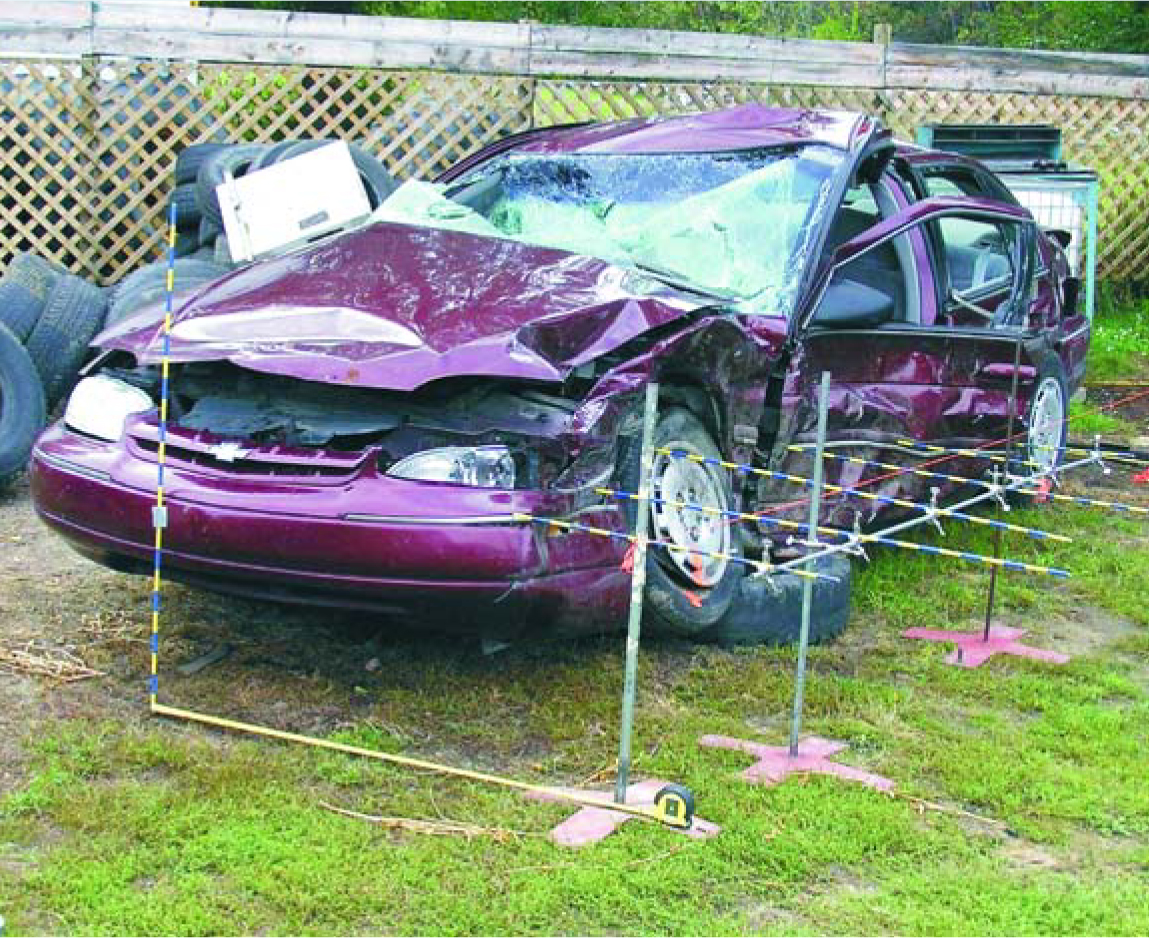
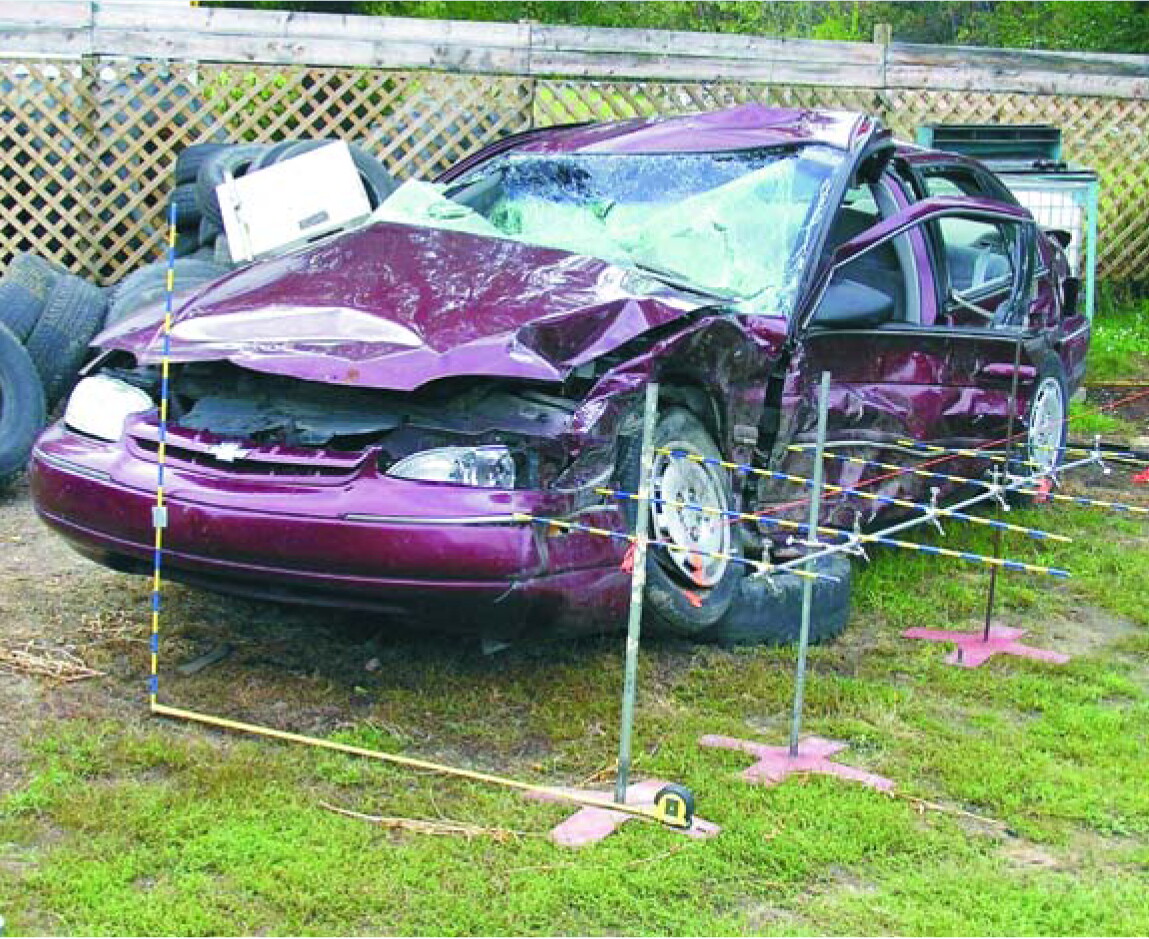
Figure 1. A midsize car struck on the side by a car of similar size suffered severe intrusion into the passenger compartment. In a study of traffic crashes at the University of Michigan, a measuring system determines horizontal deformations of the car relative to its original surface. As described in the article, the analysis of such actual road accidents, together with laboratory test crashes, provides guidance for safer vehicle design.
(Photo courtesy of Joel MacWilliams.)
Crashes and deaths
Crashes resulting in injuries and deaths are caused by poor driving, unsafe roads, and unsafe vehicles. Driver mistakes have many causes, including drowsiness, inexperience, aggressiveness, alcohol, and distractions. “Microsleep” events at the wheel cause perhaps a quarter of all serious crashes. 3 Young male drivers are especially dangerous.
Rural roads (including highways other than interstates) are not well designed. They are often narrow, unlighted, and poorly signed; shoulders may be poor or missing. As rural areas become increasingly suburban, traffic often exceeds road design expectations. Excessive speed on rural roads is encouraged by limited traffic enforcement, and emergency medical service is usually remote. Half of all traffic fatalities in the US occur in counties with fewer than 70 households per square mile. Less than a third of the US population lives in such counties, but they cover 90% of the land area.
While much can be done to address unsafe driving and unsafe roads, the focus of this article is on vehicle design. In this article we assume it is desirable to reduce vehicle mass for better fuel economy, and we address the claim that making cars lighter would increase risk significantly. That claim, resting on simple physics arguments, ignores issues of vehicle structure, incompatibility between vehicles, and passenger restraints that greatly affect the severity of injuries.
Proximate causes of injury
There are two major proximate causes of severe injuries in crashes: The first is hard contact, either when an occupant is struck by a surface intruding into the passenger compartment or when an inadequately restrained occupant strikes against the intact compartment. The second injury scenario, called restrained deceleration, occurs when seatbelts or airbags prevent contact with the compartment. Injuries tend to be less severe, but severe injury may still be caused by forces from the belt or airbag.
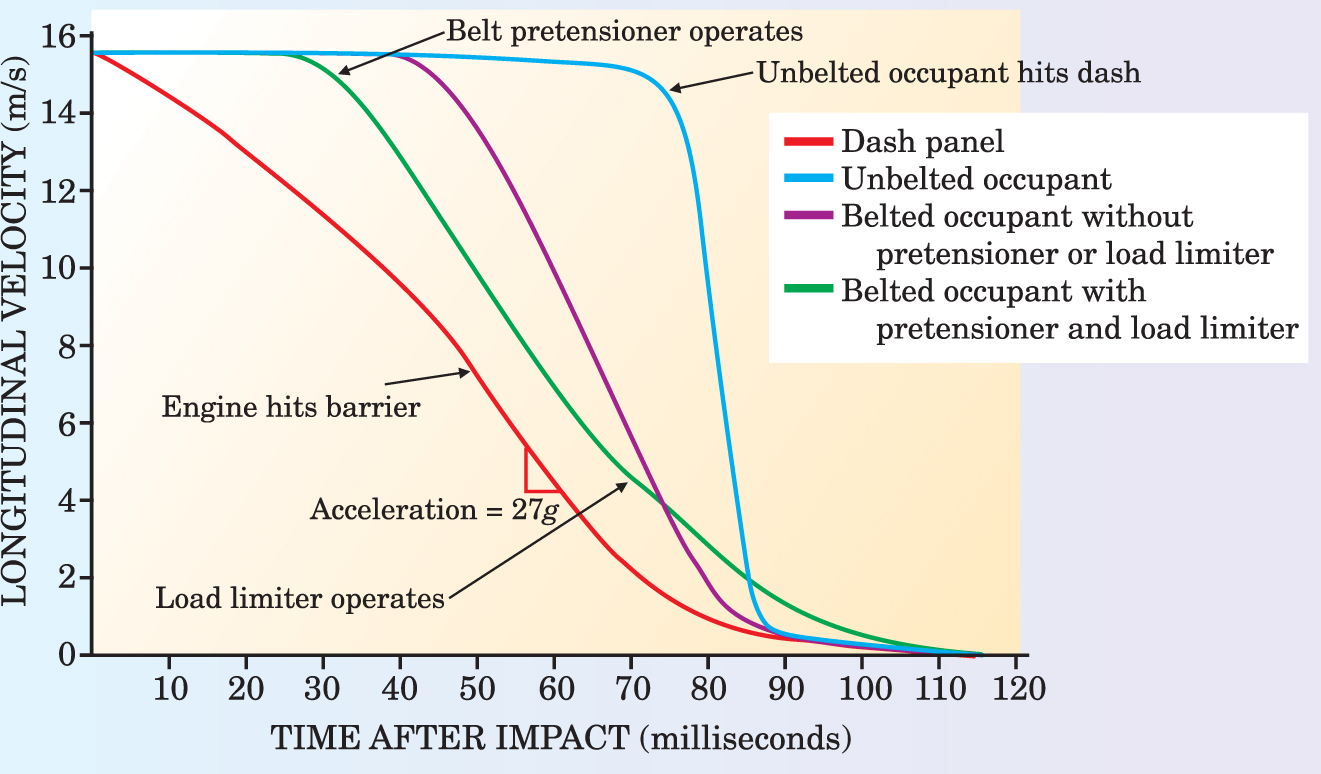
We first examine frontal crash tests. Figure 3 shows idealized velocity-time traces for full frontal crashes of a midsize car into a heavy rigid barrier, all in the fixed barrier’s reference frame. The car’s initial speed is 15.6 m/s (35 mph). A dummy, seated as a right front passenger, is initially 0.5 m away from the dashboard, with no intervening steering wheel. The leftmost trace, with the most gradual deceleration, shows the dashboard’s velocity. The passenger would be safest if his deceleration matched that of the dashboard. If the car’s peak deceleration were applied uniformly to the body, a healthy passenger should survive.

Figure 3. Velocity history of a dummy in the front passenger seat of a car, with various belt restraints, in a 35-mph head-on test crash with a fixed barrier. The red, leftmost curve, representing the car’s dash panel, has a maximum deceleration of 27g about 60 milliseconds after impact.
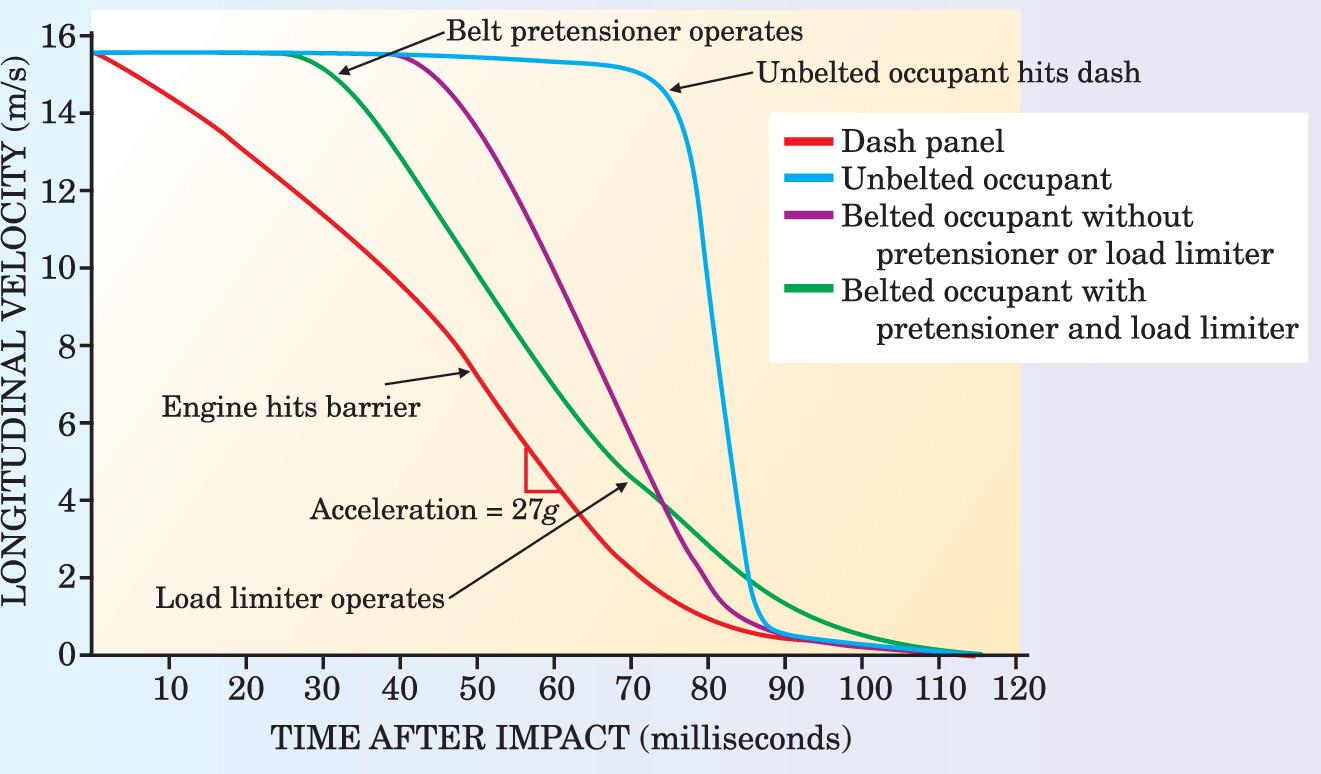
Consider the role of belts. The rightmost trace in figure 3 represents the chest of an unbelted dummy. The dummy continues at the car’s initial speed until it strikes the dash, at which point it decelerates quickly to match the dashboard’s velocity. The resultant forces are extremely dangerous, being both strong and spatially uneven. Next comes the less abrupt trace illustrating constrained deceleration. It represents the chest of a dummy wearing a conventional shoulder-lap belt that prevents the chest from striking the dash.
Most belts have been improved with pretensioners and load limiters. The green trace second from the left represents the chest of a dummy restrained by such a belt. As soon as the vehicle’s sudden deceleration is sensed, the pretensioners initially tighten up slack in the belt, thus starting the passenger’s deceleration earlier. The pretensioners typically use the same sensors as the airbags. Popular models use a pyrotechnic device, sometimes visible at the belt’s floor anchor, to pull the webbing taut. Load limiters let the belt slacken somewhat, later in the crash, so the occupant can use more of the compartment space to decelerate. The limiters can be as simple as releasable folds in the belt, designed to break open when the force is high enough, typically 6 kN (about 1300 lb).
In the above example, belts convert a potentially fatal crash into one that is often survivable. Historically, seat belts have been the most successful of all vehicular safety features. Of course they are effective only when used. Belt use in the US reached 80% in 2004. 4 It’s even higher in states and countries where belt-use laws are stringent. Air bags help distribute the narrowly applied restraining force of a belt, and they offer some protection for unbelted occupants. Belts and bags also help to keep occupants in position. Frontal air bags are effective for a belted driver, but their effectiveness for front passengers is unclear.
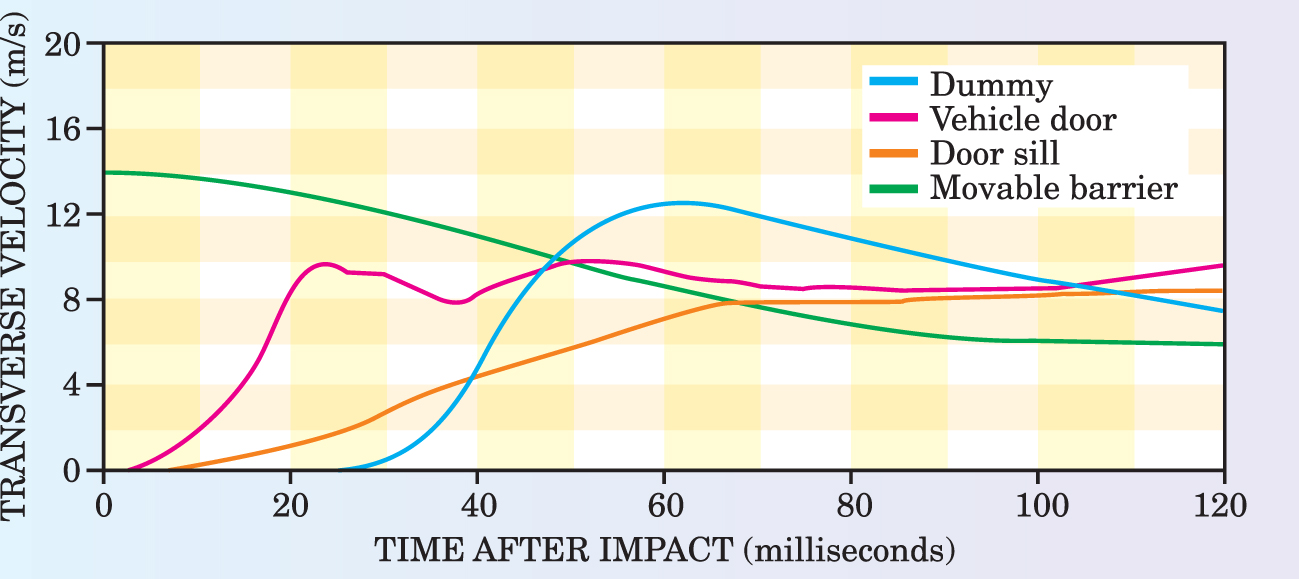
Side impacts are very different from frontal collisions. Intrusion into the passenger compartment is common, and shoulder—lap belts are less effective in limiting lateral motion of the occupant. Figure 4 shows data from a side-impact crash test in which a movable barrier, designed to mimic the mass and shape of a car, strikes the driver’s door at right angles. 5 Measured velocity-time traces show the barrier’s smoothly declining velocity; the sill below the door on the struck side, which roughly describes the overall motion of the car; the early and rapid increase in motion of the driver’s door; and the bottom of the dummy driver.

Figure 4. In a side-impact crash test, a moving barrier (green curve) strikes the driver’s door of a stationary car at right angles at 31 mph, and then decelerates smoothly to 15 mph. The sill (orange curve) below the door roughly corresponds to the resulting lateral motion of the car as a whole. The rapid intrusion of struck door (red) into the passenger compartment propels the dummy driver (blue) to the right. The maximum acceleration of the dummy’s bottom is 70g.
(Adapted from ref. 5.)
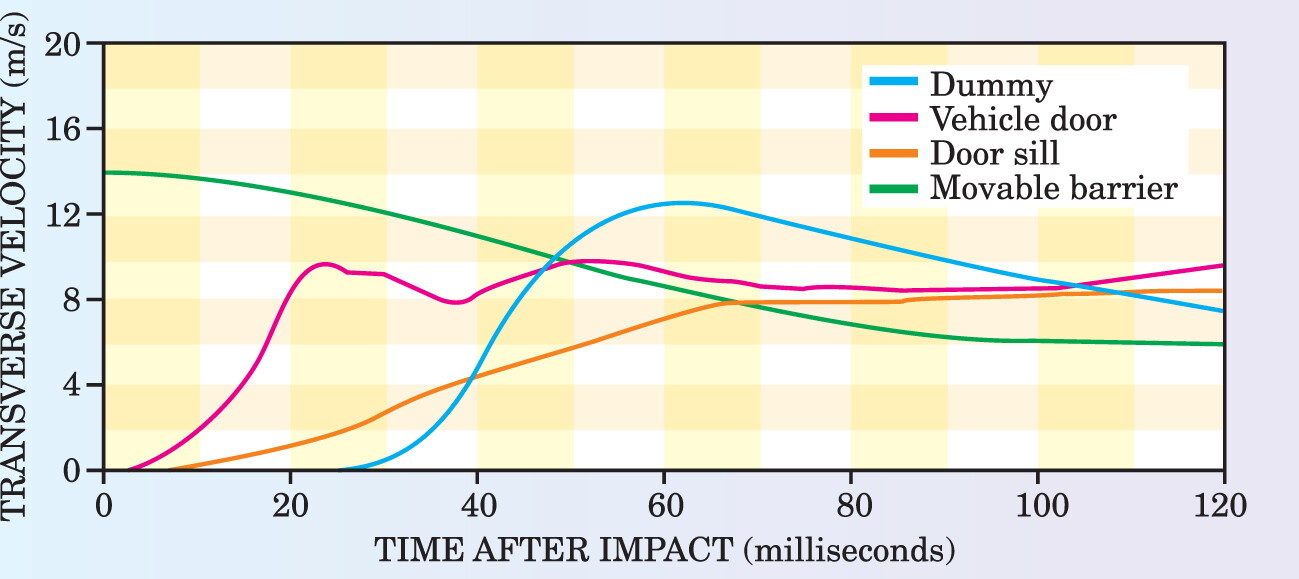
The overall sideways acceleration of the car reaches only about 10g. Not surprisingly, the localized impulses of the struck door and dummy, which are associated with intrusion, occur more quickly. The intrusion-related accelerations are also much larger. The inward acceleration of the door surface is about 1000g, and that of the dummy’s bottom is about 70g. If it lasted only a few milliseconds, such a hard acceleration might not cause injury; 6 but these events last for something like 20 ms.
In these crash tests, the vehicles and dummies are instrumented with accelerometers, providing detailed information unavailable in actual traffic crashes. Such tests set standards that manufacturers strive to meet. Since 1978, the major standardized test has been the frontal crash of a vehicle into a rigid barrier at 35 mph. In recent years there has been extensive development of other crash tests with, for example, frontal offset impact and deformable barriers. In response to crash testing and related computer simulations, manufacturers have made many detailed modifications to improve vehicle crashworthiness. The principal improvements, evident in before-and-after crash test photos, have been strengthened passenger compartments and increased energy absorption in front of the compartments.
As a caveat, it must be said that risks of on-road deaths correlate only roughly with a vehicle’s performance in the major standardized tests. A few kinds of crash tests cannot accommodate the large variation in crashes, vehicle designs, occupants, and their positions. Moreover, a recent analysis of side impacts shows that the actual severity of on-road crashes, measured in terms of Δv, a velocity-change parameter discussed below in the section on accident databases, is much greater than that of the standard side-impact test. 7
Injury data on the relative importance of restrained deceleration and contact with interior surfaces, with and without intrusion, is summarized in the
Proximate causes of severe injury or death to belted drivers
| Percent of Injuries | |
|---|---|
| Restrained deceleration | 13 |
| Contact with surfaces associated with intrusion | 54 |
| Contact with surfaces without intrusion | 24 |
| Other, including fire and flying glass | 9 |
Two-vehicle crashes
Can one take what is learned from single-vehicle crash tests and apply it to two-vehicle crashes? Robert Zobel, head of accident research at Volkswagen, has analyzed the safety of front-to-front crashes of car models that have “passed” the standard frontal crash test using rigid, flat barriers at 35 mph. 9 First, he considered the implications of energy conservation for maintaining the integrity of the passenger compartment. Passing the fixed-barrier test demonstrates that a car is able to absorb its own kinetic energy by deforming its front end without significant intrusion into the compartment. But one must consider the inelastic front-to-front collision between two such cars. Zobel was able to show that the two cars could, in principle, safely dissipate their combined kinetic energy if their closing speed is less than 70 mph, independent of their masses.
But there are two important caveats. First, if one car’s front is unnecessarily stiff, the other car may have to absorb so much of the energy that its passenger compartment is compromised. Second, if the fronts of the colliding cars are not sufficiently similar and homogeneous to assure so-called structural interaction in a head-on crash, there may be penetration into the passenger compartment. Stiff points of one vehicle may simply miss stiff points of the other vehicle. Or stiff points could deform and shift laterally or vertically in the crash, so that they align with soft elements of the opposing vehicle.
Based on National Accident Sampling System Crashworthiness Data System, for crash and model years 1997–2003. Only injuries whose source is clear are counted.
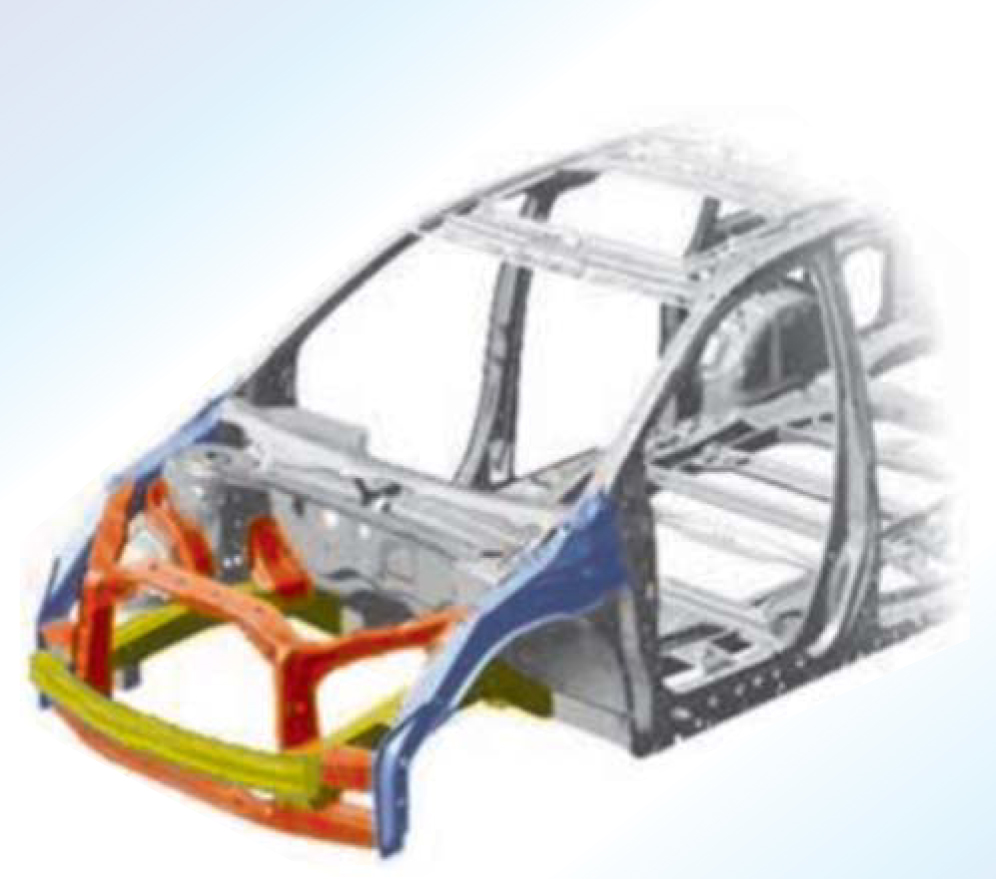
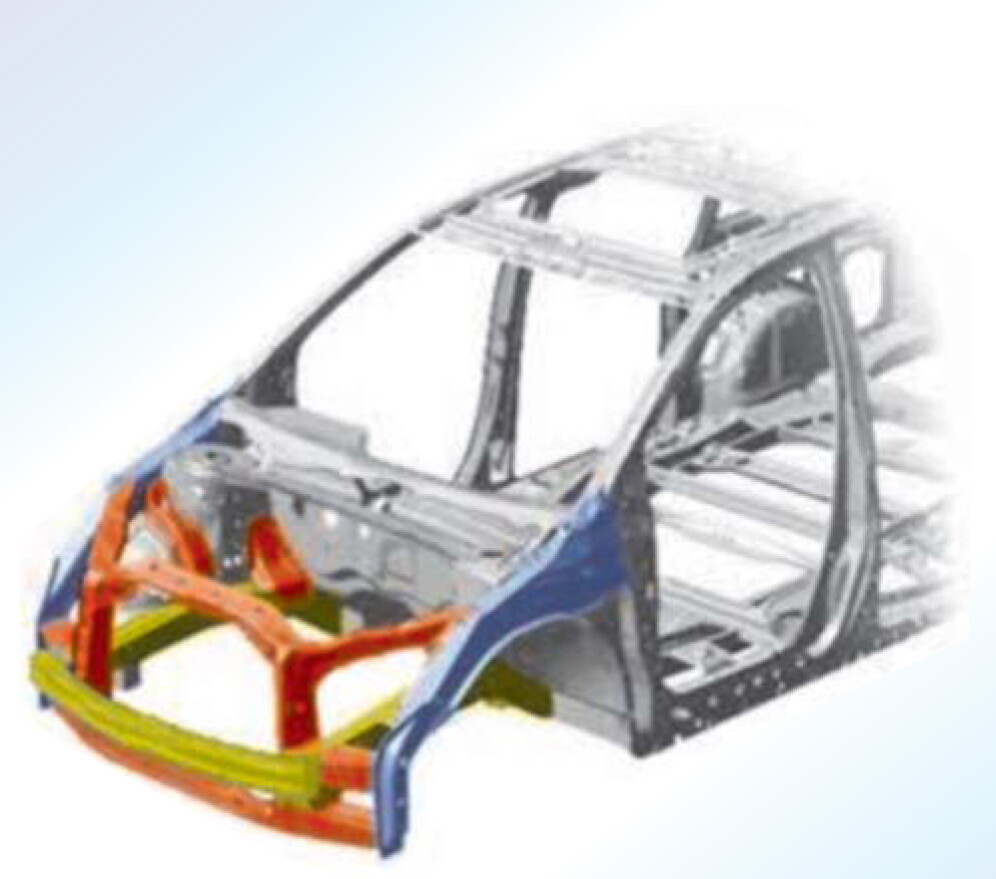
In-depth studies of actual crashes show that structural interaction is often poor. Honda is redesigning its vehicles to assure structural interaction at the vehicle’s front. The front of the 2005 Honda Odyssey minivan, shown in figure 5, is made more nearly homogeneous vertically by reinforced horizontal bars above and below the bumper, and horizontally by added reinforced vertical bars in the wheel wells. Because these additions are made of high-strength steel, vehicle mass is not increased. It will be several years before Honda includes these structural changes in all its new vehicles.

Figure 5. The front frame of Honda’s 2005 Odyssey minivan has been redesigned to distribute the force of a collision with another vehicle more uniformly. Added structures are shown orange and blue, and strengthened preexisting structures are shown yellow.
Zobel’s analysis of front-to-front collisions also considers the restrained deceleration of the occupants. He assumes that the closing speed is less than 70 mph, and that the passenger compartments of both vehicles survive intact. He further assumes that the vehicle masses are not so different that conservation of momentum dictates that deceleration injures occupants of the lighter car. Taking 30g to be the maximum acceptable bodily acceleration, Zobel suggests a maximum safe mass ratio of 1.6 for the two colliding vehicles. Within that ratio, he concludes, it is possible to design the cars to be safe for both sets of occupants in a head-on collision. Ranging in weight from 2250 to 3600 pounds (1 to 1.6 metric tons), almost all US passenger cars fall within this acceptable mass ratio. But cars and light trucks, taken together, do not.
In response to the possibility that fuel-economy regulations might be strengthened, safety experts of major US manufacturers, the National Highway Traffic Safety Administration, the Insurance Institute of Highway Safety, and a 2001 study at the National Research Council have concluded that light vehicles are fundamentally less safe than heavy vehicles. The conclusion was based on statistical analyses in which mass was the primary vehicle characteristic considered. However, attributing the safety records of today’s vehicles primarily to their masses is misleading. The average heavier vehicle tends to be more protective of its occupants also because of its size, higher general quality, and the incorporation of more recent safety features.
That these other factors are more important than mass is suggested by an evaluation of electronic stability controls by Jens-Peter Kreiss and coworkers at Braunschweig University in Germany. They found that stability controls improve safety much more in light vehicles than in heavy vehicles. 10 Kreiss argues that it’s because the heavier (read more expensive) cars were already much more stable. We have found that among cars, risk correlates much more strongly with the blue-book price of the used car than with its mass. 11 As Eberhard Faerber of the German Federal Institute for Roads put it, “If mass appears to be the main parameter … it is because this is the easiest and universal parameter that is collected in all accident databases.” 12
Heavier cars also tend to be larger, with more crush space and occupant space. A recent statistical analysis untangles the effects of size and mass among existing vehicles. 13 The authors find that when vehicle size is held fixed, “weight reduction tends to decrease the overall number of fatalities, but typical corresponding reductions in wheel-base and trackwidth tend to increase fatalities by a nearly equal amount.” It should be pointed out that weight reduction does not necessarily require size reduction.
Front-to-side crashes require separate inquiry. When the front of one vehicle strikes the side of another, injuries in the struck vehicle are likely to be associated with contact, usually with intrusion. Front-to-side crashes have been increasing in relative importance, and now cause more fatalities than front-to-front crashes.
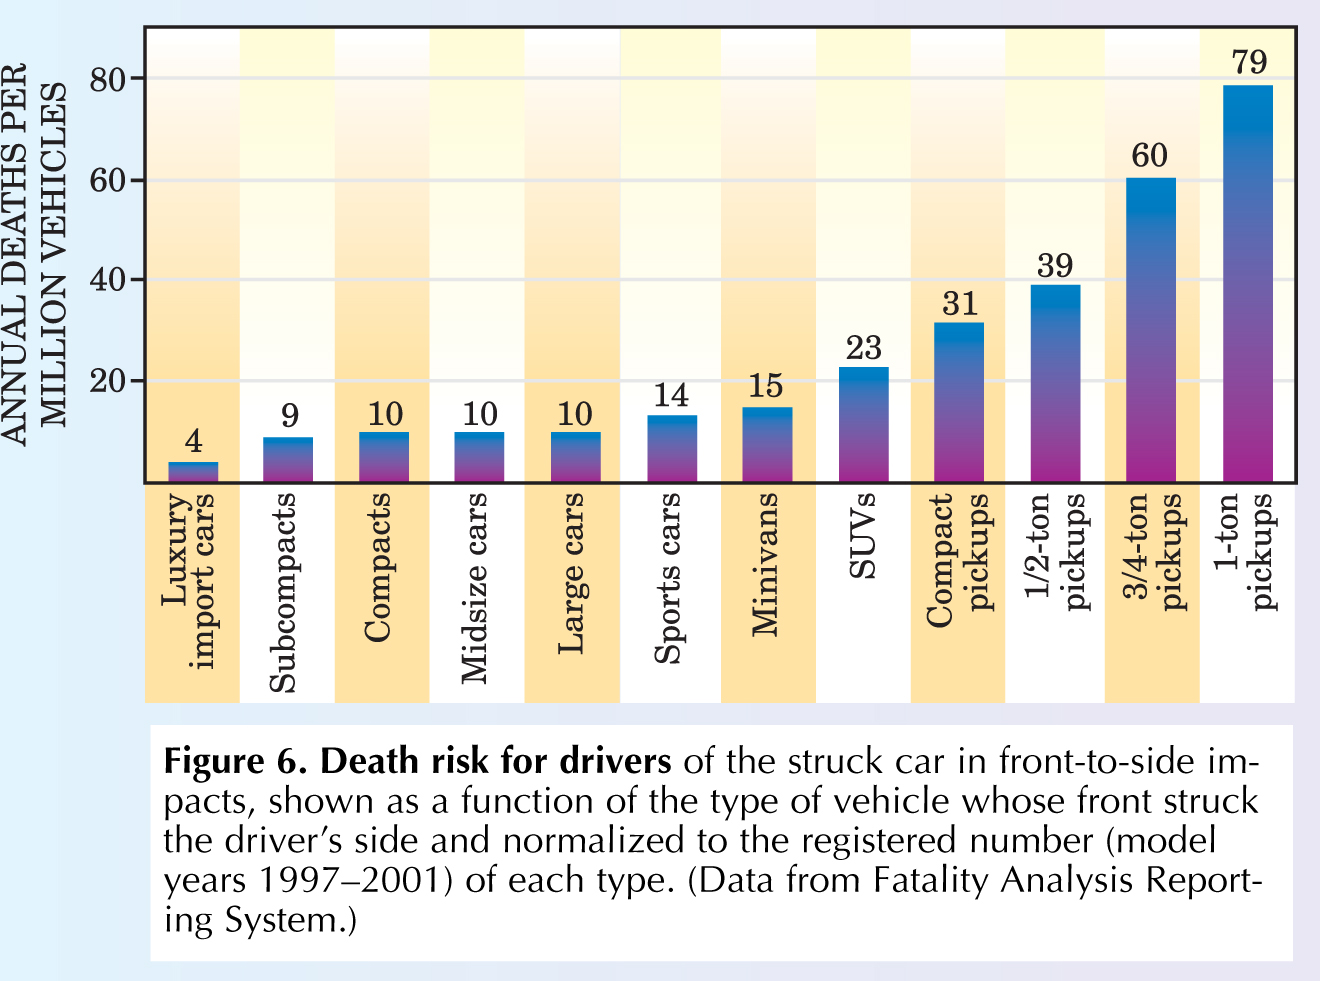
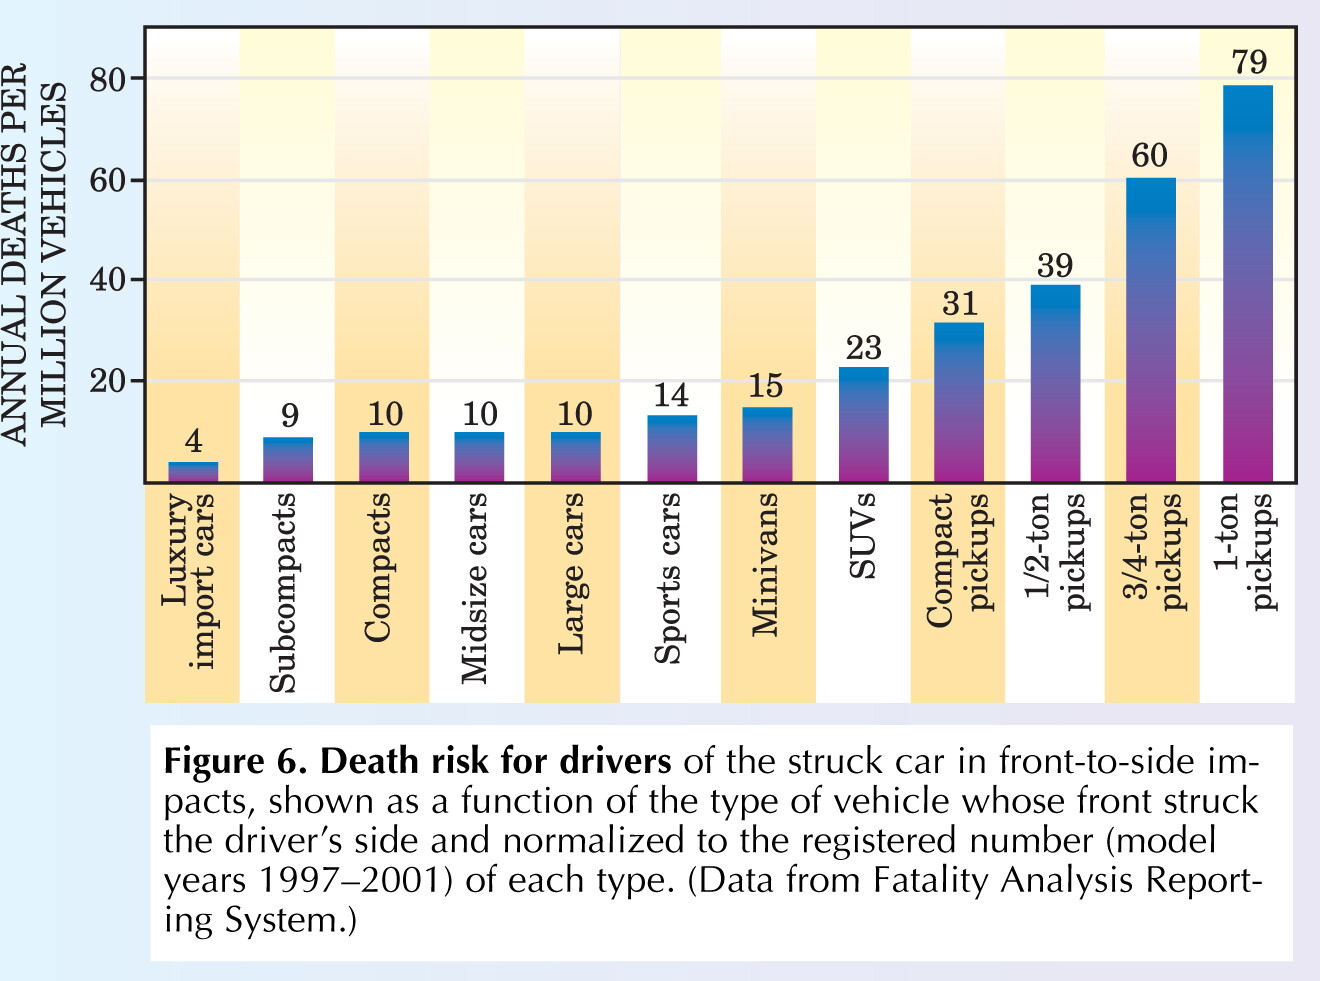
Figure 6 shows how a driver’s risk of death in a typical passenger car depends on the type of vehicle whose front hits his left side. The risk doesn’t change much from subcompact cars to large cars, even though large cars are about 1.6 times as heavy as subcompacts. But being hit by a sport utility vehicle (SUV) more than doubles the struck driver’s risk. Compact and full-size pickup trucks are even more deadly projectiles. Figure 7 suggests why.

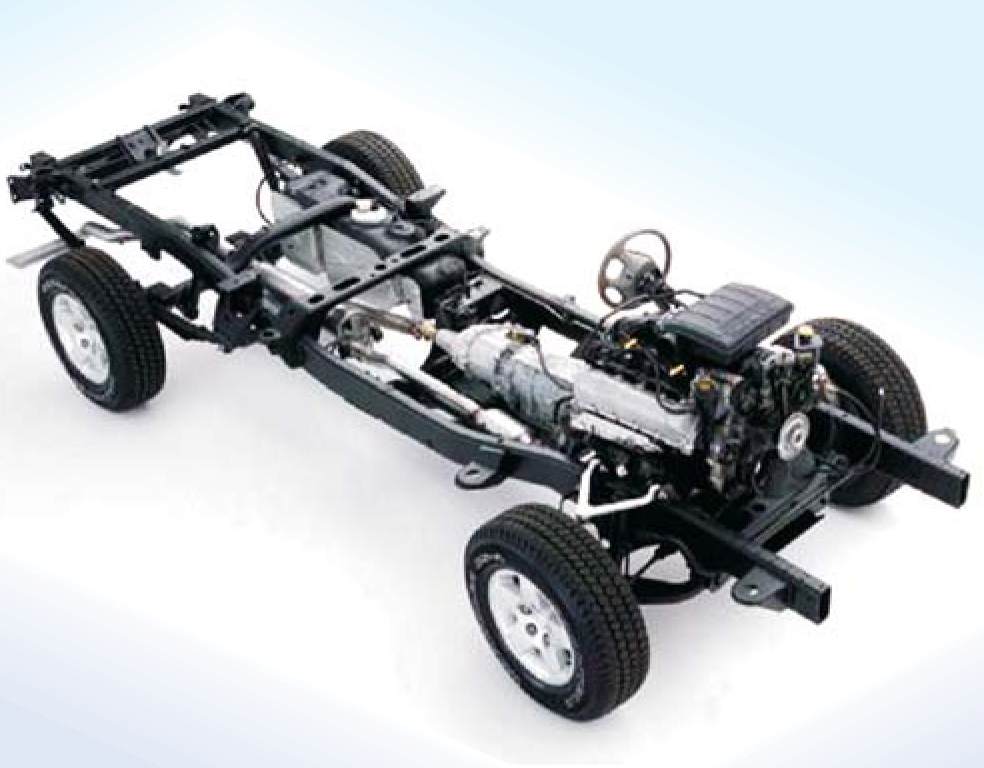
Figure 7. Half-ton 2002 Dodge Ram pickup truck. Its high, stiff horizontal rails are dangerous to the opposing vehicle in a crash. Such rails are typical of the body-on-frame construction of most light trucks, in which the separately built passenger cabin and perhaps a cargo bed are welded onto a stiff chassis.
AUTOMOTIVE ENGINEERING
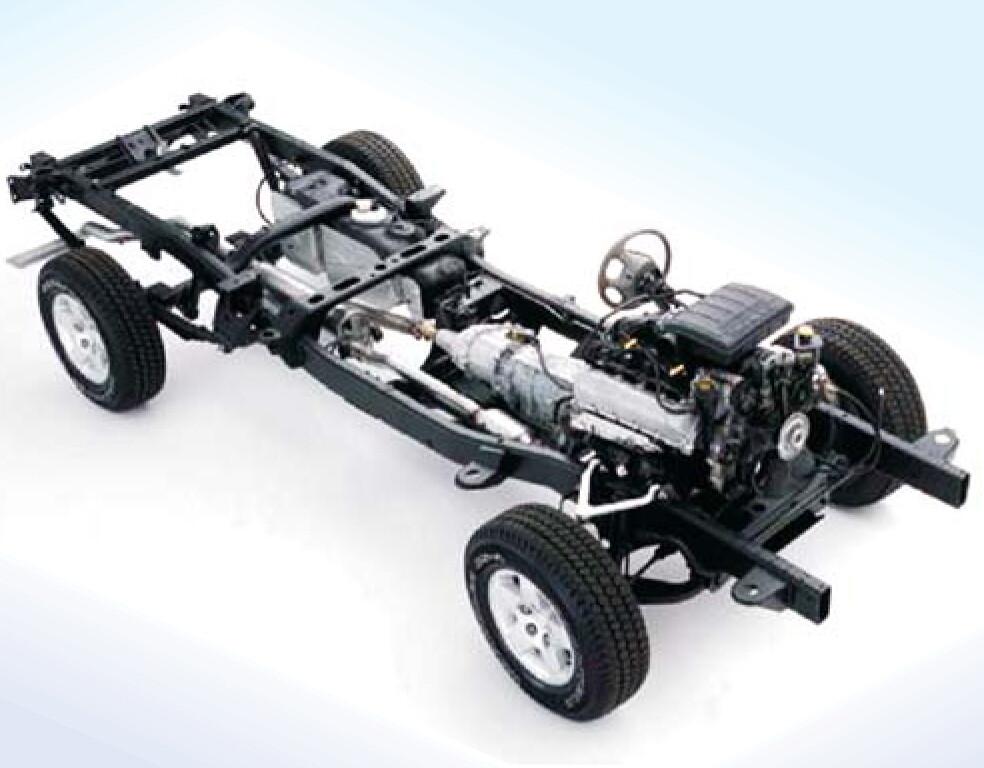

Figure 6. Death risk for drivers of the struck car in front-to-side impacts, shown as a function of the type of vehicle whose front struck the driver’s side and normalized to the registered number (model years 1997–2001) of each type.
(Data from Fatality Analysis Reporting System.)
The disparity in height, stiffness, and mass between light trucks and passenger cars is a major safety issue. On a pickup or SUV, the height and localized stiffness of its front is particularly hazardous for others. The typical pickup truck chassis shown in figure 7 has two horizontal “rails” that are high and extend far to the front. Pickups and body-on-frame SUVs impose high risks on occupants of other vehicles.
The height of the front of SUVs and pickups is thought to be critical to the danger they pose to cars in side impacts. Measurements of frontal test crashes into rigid walls with localized load cells could yield valuable information about the vertical force profile for individual models. But the poor vertical resolution of the US New Car Assessment Program’s current testing mode is inadequate for satisfactory analysis of the design hazards at issue.
Changing the design of light trucks to reduce injuries in front-to-side crashes with cars is made difficult not only by the truck’s greater height, but also by the small separation between the front of the striking truck and the car’s proximate occupant. An ambitious improvement would be the adoption of variable suspension for appropriate light trucks, automatically raising the chassis for off-road use and lowering it at road speeds. Some production vehicles already have adjustable suspensions. In a radical thought experiment, we have estimated that replacing with passenger cars all the light trucks in the US that are used only as “car substitutes” would save three to four thousand lives a year. That’s almost 10% of all traffic fatalities!
Geometry and rollover
Rollovers are associated with roughly one-quarter of traffic deaths. Although electronic stability controls are becoming increasingly important in preventing rollovers, we focus here on the structural issues.
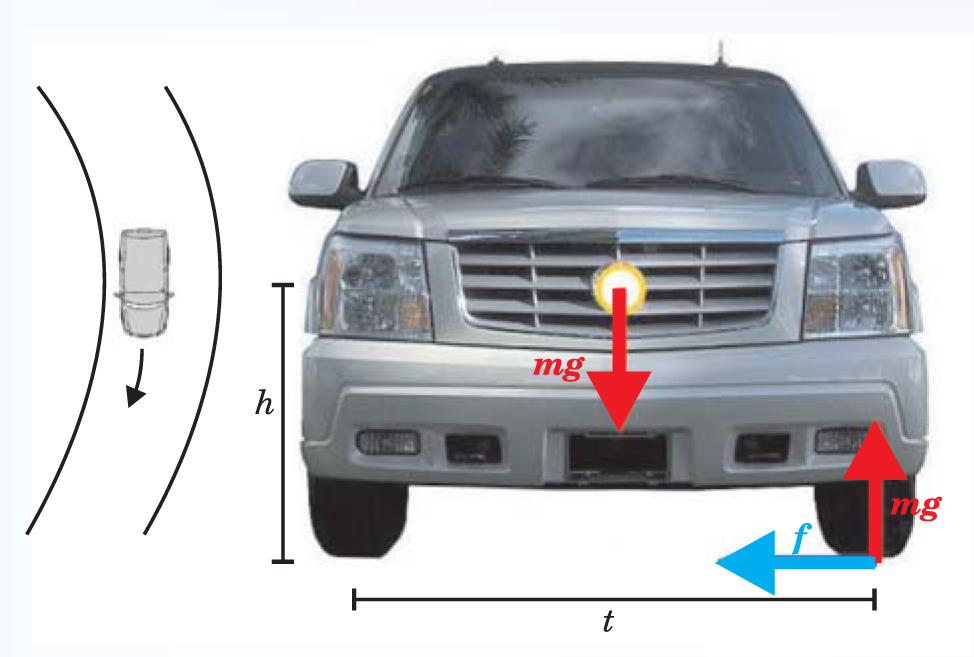
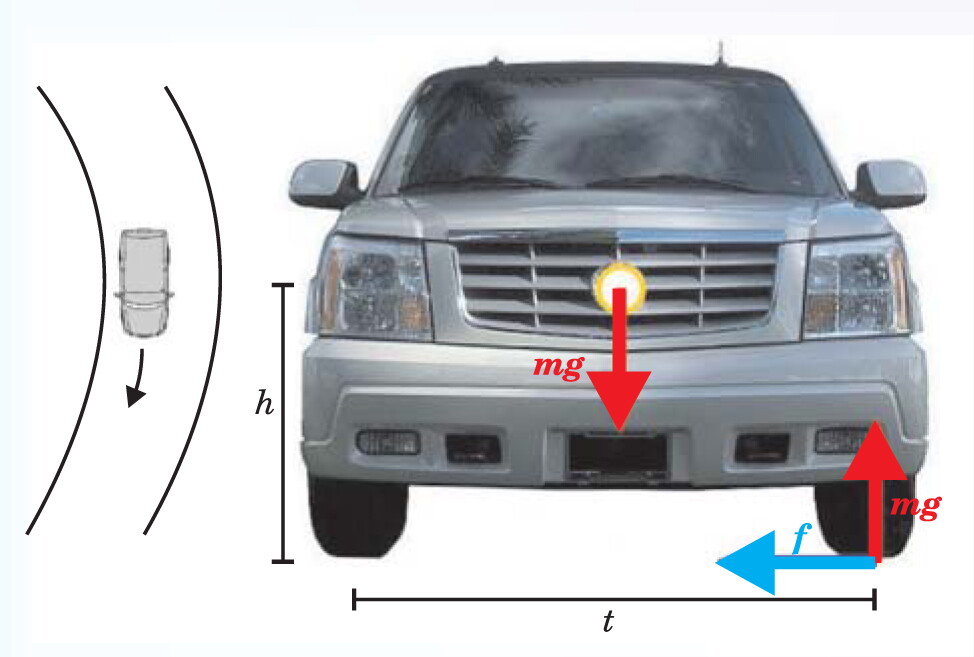
For simplicity, assume that a vehicle of mass m is a rigid body and neglect higher-order effects of the suspension system. Turning the front wheels creates a lateral force f by the ground on the tires, causing an acceleration a = f/m that depends on the speed and radius of the turn. On a level road, the rollover threshold—that is, the condition for the inward tires to just lift off the ground—is then
, where t is the distance between the tires on the same axle, h is the height of the vehicle’s center of gravity, and g is the acceleration of gravity (see figure 8). 14

Figure 8. Simplified force diagram for a right turn at the rollover threshold. On a flat road, the vehicle tends to roll toward the outside. About the longitudinal axis through the vehicle’s center of gravity, forces on the left front wheel produce a clockwise rollover torque mha and an opposing torque mgt, where h is the height of the center of gravity and t is the distance between front wheels. So if the acceleration a, in units of the gravitational acceleration g, exceeds the stability factor t/2h, the car will roll over.
The figure of merit t/2h is called the vehicle’s static stability factor. The SSF of body-on-frame SUVs and pickups is about 1.0 to 1.2. For car-based SUVs or “crossovers” it’s about 1.2, and for a typical sedan it’s 1.4. Since the lateral coefficient of friction µ on a dry road is about 0.8, it would seem that in a hard turn, an SUV would skid without rolling over, because the rollover threshold condition is not met. That is,
However, other factors encourage rollover: The vehicle’s sprung mass tips away from the turn, and added loads, such as passengers, usually raise the center of gravity. More often, a vehicle may trip and roll over if it strikes a curb or another vehicle, or if it veers onto soft or irregular ground. But even then, increased SSF due to wider t or lower h reduces the risk of rollover.
Accident databases
While standardized crash tests and instrumented dummies can shed light on causes of injury, there is no substitute for scrutinizing data from on-road crashes. The Fatality Analysis Reporting System is a national database of all fatal traffic crashes in the US. 2 For each crash, FARS stores hundreds of data entries based on the police report. Another database, the National Accident Sampling Systems Crashworthiness Data System, contains more detailed information on a sample of crashes, fatal and nonfatal, in which investigators measured deformation of the wrecked vehicles, interviewed victims, and had access to police and medical reports. But NASS CDS only covers about one in a thousand severe-injury crashes. With a weight assigned to each crash, the sample is claimed to be statistically representative of the US.
A third data-gathering effort in the US is the Crash Injury Research and Engineering Network. The medical and engineering teams that collaborate in CIREN study very small numbers of crashes in depth. In parts of Europe, such investigation of crashes is more extensive. For example, the German In-Depth Accident Study collects data on large numbers of accidents, with investigators often arriving within minutes of the crash. 15
The in-depth accident databases often record Δv, an interesting speed-related measure determined from the estimated crush energy by expert investigators. For each vehicle, Δv is the velocity change during the crush phase of a crash. To determine Δv, one measures crush distances perpendicular to the original surface at several points at a uniform height on the wreck, as shown on figure 1. These measurements are entered into a software program that calculates Δv by approximating the forces that caused the inelastic crush. The coefficients of the approximation have been determined from crash tests. 16 When it’s available, Δv is often used as an indicator of crash severity.
To determine the risk of injury or death in traffic, one needs so-called exposure data for normalized comparison. For example, the risk of driver death is the ratio of the number of driver deaths to the “exposure” to a potential fatal collision. When one is investigating the risks associated with a particular vehicle characteristic, the measure of exposure might be the relevant number of registered vehicles. Data on registered vehicles include make and model, so that the risk can be determined for different vehicle types. Or an investigation might consider the risks associated with type of road, driver characteristics, or type of crash. Determining the dependence of risk on driver and road characteristics and type of crash is uncertain because of the difficulty in finding credible and unbiased measures of exposure.
Lighter vehicles
Reduction of vehicle masses is of interest for fuel savings. But the perceived implications for safety have been a distraction for researchers and regulators alike. The belief that making vehicles lighter would significantly increase risk has been based primarily on analyses that largely ignore the historical association of mass with size and quality. There has not been adequate focus on design and technological innovation aimed at increasing the safety of lighter vehicles.
The evidence is compelling that body-on-frame light trucks cannot safely coexist with passenger cars under existing conditions. That problem is critical because so many light trucks are used nowadays as car substitutes. Innovative technology with new materials is promising. Light and strong composite materials characterized by high absorption of crush energy per kilogram are being developed, and progress is being made in their manufacture. 17 Such technologies could substantially reduce contact injuries arising from crashes between light trucks and cars. Moreover, these materials could yield vehicle designs that reduce mass for a given interior space. There is also a need for tests and regulations with regard to the crash compatibility of disparate vehicle designs and sizes. Currently no such tests or regulations are being implemented, or even developed, in the US.
Government regulation and manufacturer ingenuity have resulted in impressive technologies for improving the safety of motor vehicles. Zobel has listed such innovations in decreasing order of their importance to safety: seat belts, passenger compartment integrity, electronic stability control, and air bags. We see substantial opportunities for further progress in design: Passenger compartments can be made stronger. Belts and bags can be improved to restrict lateral movement and nudge occupants into optimal position when a crash is imminent. And front ends can be redesigned to increase overall structural interaction between colliding vehicles.
We are especially indebted to Charles Compton, Joel MacWilliams, Matthew Reed, Stephen Summers, and Robert Zobel for substantial help. We also thank John DeCicco, John German, and Stewart Wang for discussions.
References
1. P. F. Waller, Transportation Quarterly 56, 55 (2002).
2. National Highway Traffic Safety Administration, available at http://www-fars.nhtsa.dot.gov .
3. J. A. Horne, L. A. Raynor, Falling Asleep at the Wheel, rep. no. TRL168, Transportation Research Laboratory, Workingham, UK (1995).
4. D. Glassbrenner, Safety Belt Use in 2004—Overall Results, National Highway Traffic Safety Administration rep. no. DOT HS 809 783, US Department of Transportation, Washington, DC (September 2004), available at http://www-nrd.nhtsa.dot.gov/pdf/nrd-30/NCSA/RNotes/2004/809-783 .
5. H. Yonezawa et al., in Proc. 19th International Technical Conference on the Enhanced Safety of Vehicles, National Highway Traffic Safety Administration rep. no. DOT HS 809 825, paper no. 05-0188, US Department of Transportation, Washington, DC (June 2005), available at http://www-nrd.nhtsa.dot.gov/departments/nrd-01/esv/esv.html .
6. U. Seiffert, L. Wech, Automotive Safety Handbook, Society of Automotive Engineers, Warrendale, PA (2003), p. 78.
7. R. A. Arbelaez et al., in Proc. 19th International Technical Conference on the Enhanced Safety of Vehicles, National Highway Traffic Safety Administration rep. no. DOT HS 809 825, paper no. 05-0049, US Department of Transportation, Washington, DC (June 2005), available at http://www-nrd.nhtsa.dot.gov/departments/nrd-01/esv/esv.html .
8. J. Augenstein et al., The Role of Intrusion in Injury Causation in Frontal Crashes, technical paper no. 2005-01-1376, Society of Automotive Engineers, Warrendale, PA (2005) https://doi.org/10.4271/2005-01-1376 .
9. R. Zobel, in Proc. 16th International Technical Conference on the Enhanced Safety of Vehicles, US Department of Transportation, Washington, DC (1999), p. 729.
10. J.-P. Kreiss et al., in Proc. 19th International Technical Conference on the Enhanced Safety of Vehicles, National Highway Traffic Safety Administration rep. no. DOT HS 809 825, paper no. 05-0145, US Department of Transportation, Washington, DC (June 2005), available at http://www-nrd.nhtsa.dot.gov/departments/nrd-01/esv/esv.html .
11. T. Wenzel, M. Ross, Accident Analysis and Prevention 37, 479 (2004) https://doi.org/10.1016/j.aap.2004.08.002 .
12. E. Faerber, in Proc. 17th International Technical Conference on the Enhanced Safety of Vehicles, National Highway Traffic Safety Administration rep. no. DOT HS 809 220, US Department of Transportation, Washington, DC (June 2001).
13. R. Van Auken, J. Zelner, A Further Assessment of the Effects of Vehicle Weight and Size Parameters on Fatality Risk in Model Year 1985–98 Passenger Cars and 1985–97 Light Trucks, pub. no. DRI-TR-03-01, Dynamic Research Inc., Torrance, CA (2003).
14. T. D. Gillespie, Fundamentals of Vehicle Dynamics, Society of Automotive Engineers, Warrendale, PA (1992), chap. 9.
15. G. Rieger et al., in Proc. 19th International Technical Conference on the Enhanced Safety of Vehicles, National Highway Traffic Safety Administration rep. no. DOT HS 809 825, paper no. 05-0053, US Department of Transportation, Washington, DC (June 2005), available at http://www-nrd.nhtsa.dot.gov/departments/nrd-01/esv/esv.html .
16. R. Brach, M. Brach, Vehicle Accident Analysis and Recon-struction Methods, Society of Automotive Engineers, Warrendale, PA (2005), chap. 8.
17. A. B. Lovins et al., Winning the Oil Endgame, Rocky Mountain Institute, Snowmass, CO (2005), p. 57, available at http://www.oilendgame.com/ReadTheBook.html .
More about the authors
Marc Ross, formerly a particle theorist, is a professor of physics at the University of Michigan in Ann Arbor. Deena Patel is a postdoctoral fellow in the university’s physics department. Tom Wenzel is an analyst at Lawrence Berkeley National Laboratory.
Marc Ross, University of Michigan, Ann Arbor, US.
Deena Patel, University of Michigan, Ann Arbor, US.
Tom Wenzel, Lawrence Berkeley National Laboratory.