Measuring the Hubble constant
DOI: 10.1063/PT.3.2148

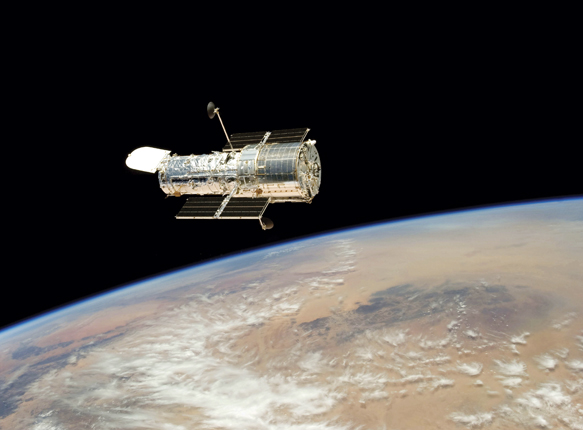
The Hubble Space Telescope orbiting Earth in 2009. (Courtesy of the Space Telescope Science Institute and NASA.)
In 2011 a passionate debate flared up about who deserves the credit for the discovery that our universe is expanding. Here are some of the background facts. By February 1922, US astronomer Vesto Slipher had already measured the redshifts for 41 galaxies. British astrophysicist Arthur Eddington, who listed them in his 1923 book The Mathematical Theory of Relativity (Cambridge University Press), noted that “the great preponderance of positive (receding) velocities is very striking.” He did add, however, that the lack of observations from the Southern Hemisphere precluded any definitive conclusions.
In 1924 Swedish astronomer Knut Lundmark provided tentative, qualitative evidence for the expansion. However, his results did not carry much weight, since he relied on the implausible assumption that all galaxies have the same diameter and his correlation between velocity and distance was not readily apparent.
A stronger case for an expanding universe came from Belgian priest and cosmologist Georges Lemaître who, in 1927, published a paper in French entitled “A homogeneous universe of constant mass and increasing radius accounting for the radial velocity of extragalactic nebulae.” In that paper, Lemaître reported on the expanding-universe solutions to Einstein’s general relativity equations. He also used Slipher’s results in combination with distance estimates, now based on the rather inaccurate assumption that all galaxies have the same luminosity, to propose a tentative “Hubble law” v = H0d, that is, a linear relationship between distance d and recession velocity v. Lemaître derived the value of 625 kilometers per second per megaparsec for the Hubble constant H0. (The expansion rate actually changes with time as 1/t; the “constant” H0 is its present value.)
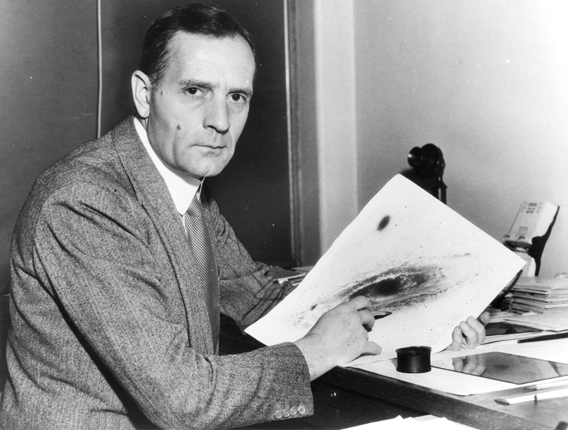
Unfortunately, Lemaître’s paper received little attention. Two years later Edwin Hubble, shown in figure 1, published his seminal paper with improved distance determinations based on the brightnesses of certain classes of stars. His resulting linear relation between recession velocity—again, obtained from Slipher’s redshift data—and distance was more significant and convincing. It became the widely cited origin of the discovery of the expanding universe. The value Hubble obtained for the Hubble constant was 500 km s−1 Mpc−1.

Figure 1. Edwin Hubble with an image of a galaxy. Hubble presented convincing evidence that galaxies recede with a speed proportional to their distance from us. (Hale Observatories, courtesy of the AIP Emilio Segrè Visual Archives.)
A key driver for the recent debate over who discovered the Hubble law was that in the English translation of Lemaître’s paper, which appeared in 1931, certain paragraphs were omitted. Suspicion arose that the omission reflected some form of censorship, possibly encouraged by Hubble. After extensive research, one of us (Livio) discovered conclusive evidence that, following the publication of Hubble’s more precise results, Lemaître, out of modesty, deleted those paragraphs from the translation because he thought they were superseded by Hubble’s work. 1 In brief, Lundmark was the first to offer observational evidence for the expansion, Lemaître made the tentative connection between theory and observations, Hubble and his assistant Milton Humason provided the best observational proof in a series of papers, and all were aided by Slipher’s redshifts.
Early measurements
Ever since the 1920s, physicists have known that we live in an expanding universe. In the framework of general relativity and given the “cosmological principle” that the universe is the same at all locations and in all directions on large scales, the expansion is measured by a single function of time, the scale factor R(t). The evolution of the scale factor is governed by what is known as the Friedmann equation, which describes how the curvature of space is determined by the density of matter and radiation and the density of the so-called dark energy, the physical manifestation of Einstein’s cosmological constant. The most recent observations of the cosmic microwave background, by the Wilkinson Microwave Anisotropy Probe (WMAP) and the Planck space observatory, indicate that matter and dark energy combine so as to produce nearly, if not exactly, zero spatial curvature.
The Hubble constant is a direct measure of the current expansion rate and is the key parameter in determining the age of the universe, t0, through t0 ∝ H0−1. (Matter and dark energy play a smaller role, causing the cosmic expansion to decelerate or accelerate, respectively.) Physical processes such as the growth of cosmic structure and the nucleosynthesis of the light isotopes hydrogen, deuterium, helium-3, helium-4, and lithium-7 depend on the cosmic expansion rate and thereby on the value of H0. So do critical periods in the universe’s history, such as the transition from a radiation-dominated epoch in which the energy density scales as R−4(t) to the matter-dominated universe in which density is proportional to R−3(t). It should therefore come as no surprise that the determination of H0 has been a major observational goal for the past nine decades.
Figure 2a summarizes the early history of H0 measurements. The first values were all roughly 500 km s−1 Mpc−1, with an uncertainty estimated rather naively “to be of the order of 10 percent.” 2 Some 20 years after Hubble’s measurements, astronomer Walter Baade revised the distance to nearby galaxies. Baade recognized that Hubble had confused two generations of pulsating stars used as distance standards; his revised estimates increased distances and reduced H0 by about a factor of two. Measurements of H0 first approached the range of values accepted today (see figure 2b for modern measurements) through the work of Allan Sandage in the late 1950s. Sandage demonstrated that Hubble had mistakenly identified ionized-hydrogen (H II) regions as bright stars and revised the value down to H0 ≈ 75 km s−1 Mpc−1, recognizing that the uncertainty was comparable to the value itself.

Figure 2. Hubble constant measurements. (a) The earliest measurements of H0 were about an order of magnitude greater than measurements made 50 years later. (Adapted from ref.
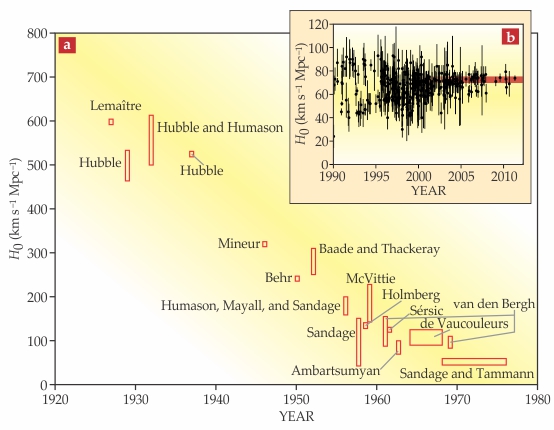
In the three decades that followed, published values of the Hubble constant ranged over a factor of two. One group, led by Sandage, consistently claimed values near 50 km s−1 Mpc−1 ± 10%; another, led by Gérard de Vaucouleurs, persistently measured 100 km s−1 Mpc−1 ± 10%. Those determinations were embarrassing for two reasons. One, obviously, was the smallness of the cited errors, which couldn’t both be correct. The other was that if one took the average of the two values, the deduced age of the universe was shorter than the calculated ages of the oldest star clusters! The eventual resolution of the age discrepancy required two inputs: accurate astrometric distance determinations by the Hipparcos satellite, which somewhat reduced the calculated stellar ages, and the discovery that the cosmic expansion is accelerating, which implied an older age for the universe.
To determine redshifts, and therefore radial velocities, astrophysicists need to look far enough away that cosmic expansion rather than local motions predominantly determine the redshift. Given that, and notwithstanding the challenges posed by the most distant or faintest objects, redshifts can be obtained relatively readily; the problem of measuring the Hubble constant has always primarily been one of determining accurate astronomical distances. The availability of new observing facilities—the Hubble Space Telescope in particular—has allowed for a dramatic improvement in distance determinations.
Cepheids, a primary distance indicator
The simplest and most robust measure of distance comes from geometry via triangulation, with the diameter of Earth’s orbit around the Sun serving as a baseline. Unfortunately, the parallax essential for triangulation can only be detected for stars within the Milky Way at distances of up to about 1 kiloparsec; for even the nearest galaxies, the angular shift would be less than a microarcsecond. Consequently, astrophysicists must use other methods to determine extragalactic distances of tens to hundreds of megaparsecs.
The distances so obtained are relative measures, calibrated from nearby examples within range of parallax analysis, and the objects to which the methods are applied are called primary distance indicators. Secondary distance indicators are objects or systems that are far away from us. Their intrinsic rarity places the nearest examples beyond the range of parallax, and so their distances are calibrated from primary indicators. The sequence continues, forming a distance ladder that reaches areas of the universe where the smooth expansion of the cosmos—the Hubble flow—dominates over local, peculiar motions. Errors in measurement or systematics necessarily propagate along the ladder to the determination of H0.
The most common relative distance indicators employ so-called standard candles that are based on geometrical properties, physical properties, or various correlations. Underlying the notion of standard candles is that the flux of radiation decreases as an inverse square law. Useful standard-candle candidates either have a constant luminosity or are objects whose luminosity can be related to a measurable property that is independent of distance, such as an oscillation period or the decay rate of a transient light curve. They are highly luminous and so can be seen far away.
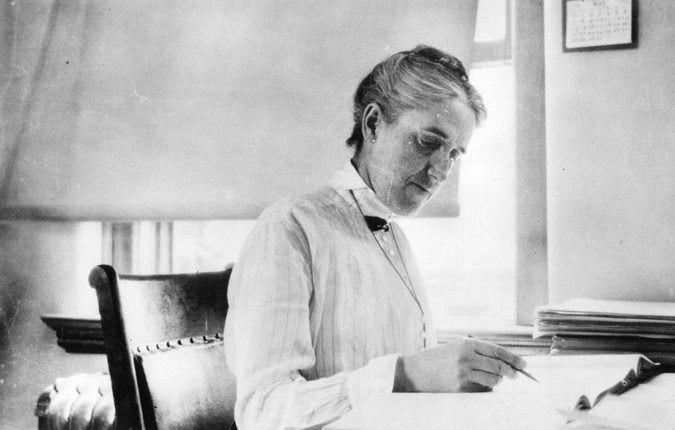
Perhaps the best-known standard candles are pulsing, supergiant stars called Cepheid variables. They are named after the prototype of this class, Delta Cephei, which has a 5.4-day period and, at a distance of 270 parsecs, a parallax angle of 3.7 milliarcseconds. The relative proximity to the Sun of some Cepheids in the Milky Way, their high luminosity (104–105 times the Sun’s), and well-understood stellar physics make them one of the most reliable of the primary distance indicators. In 1912 Henrietta Leavitt, shown in figure 3, realized that the relation between the Cepheids’ period and luminosity could allow those giant stars to serve as standard candles. Hubble used the Cepheids to determine distances to Local Group galaxies, the group of about three dozen nearby galaxies to which the Milky Way belongs.

Figure 3. Henrietta Leavitt, seated at her desk. Leavitt recognized that the relationship between the period and the luminosity of supergiant stars called Cepheid variables implied that the Cepheids would be good distance standards. (Courtesy of the AIP Emilio Segrè Visual Archives, Physics Today Collection.)
The physical process responsible for a Cepheid’s pulsations and the period–luminosity relation begins with a perturbation—a contraction that drives the star away from hydrostatic equilibrium. As a result, the temperature and density of the gas increase. Near the star’s ionization zones—in which the primary reaction is He+ ⇄ He++—as helium becomes doubly ionized, the opacity of the gas increases. Consequently, the gas traps radiation, warms up even more, and further expands. In the ionization zones, the pressure does not decrease as quickly with decreasing density as it would for an ideal gas, so the expansion goes beyond the point where hydrostatic equilibrium would have been achieved for an ideal gas. The excess heating stops only when helium recombination back into He+ reduces the gas opacity and heat is radiated into space. As heat leaves the system, the pressure decreases, the gas contracts, and the cycle starts anew. The pulsation cycle operates only for a small temperature range, and only in a narrow range of stellar masses does the ionization zone occur at a middling depth where ionization and recombination can effectively drive oscillations.
It turns out that the pulsation period is inversely proportional to the square root of the Cepheid’s density and therefore depends on the stellar mass and radius. The luminosity is determined by some power of the mass, but it is also a simple function of temperature and radius. Given the three specific formulas, one expects (and astronomers have observed) a temperature-dependent period–luminosity relation.
Thanks to the high optical resolution and stability of the Hubble Space Telescope and the capabilities of the Wide Field Planetary Camera 2 (WFPC2) instrument installed at the first Hubble servicing mission, observers could resolve individual Cepheids in galaxies as far away as 20 Mpc. One of Hubble’s initial “key projects,” led by Wendy Freedman, Jeremy Mould, and Robert Kennicutt, and another investigation led by Sandage, Gustav Tammann, and Abi Saha, took advantage of that then-new capability to measure the Hubble constant with about 10% precision. The key project, which operated from 1994 to 2001, and several contemporaneous programs also used Cepheids to calibrate tools for analyzing many of the secondary distance indicators mentioned later.
Below we briefly describe the physical basis for long-range distance methods that are presently being used to refine determinations of the Hubble constant. Of the three techniques most commonly employed, one—analysis of supernova light curves—rests on calibration via Cepheids. But approaches based on so-called megamasers and gravitational lensing are at least partially geometric and thus serve to indicate distances independently of Cepheid data.
Extending the ladder
Type Ia supernovae result from the thermonuclear disruptions of mass-accreting white dwarfs made up of carbon and oxygen. At peak brightness, they are extremely bright—a million times brighter than the Cepheids—and, as a class, they show relatively little variation in that peak luminosity. Furthermore, there exists a tight correlation between the peak luminosity of a type Ia supernova and the shape of its brightness-versus-time light curve. As figure 4 shows, the light curve declines more slowly for brighter supernovae. (See also the article by Saul Perlmutter, Physics Today, April 2003, page 53 .)

Figure 4. Type Ia supernova light curves. (a) As shown in these plots of magnitude (a logarithmic measure of luminosity; more negative values are brighter) versus time, luminosity decays more slowly for the brightest supernovae than it does for the fainter ones. (b) With a suitable rescaling of time and brightness, the supernovae plotted in panel a lie on a single curve. Because of that universality, type Ia supernovae can serve as standards for determining distance. (Courtesy of the Supernova Cosmology Project.)
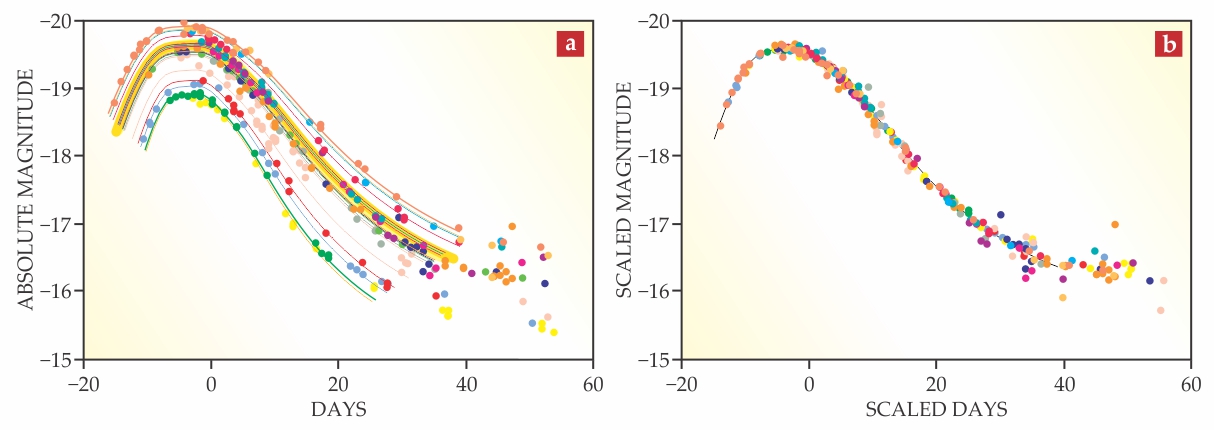
Physicists currently lack a full theoretical understanding of the observed correlations, but the relative homogeneity likely arises because the white dwarfs that blow up as supernovae are at or near the Chandrasekhar limit, the mass above which gravity overcomes electron degeneracy pressure and runaway nuclear fusion ensues. The relation between peak luminosity and light-curve shape may be the result of the following scenario. The peak luminosity of a type Ia supernova is proportional to the mass of nickel-56 that it produces, since the decay of 56Ni is what powers the luminosity. A higher mass of 56Ni, however, also results in more heating and a higher opacity; consequently, the light curve declines more slowly. On its way to us, light from supernovae passes through dust, which reduces its intensity and shifts its color to the red.
Once the light-curve and dust-induced variations are accounted for, type Ia supernovae have a statistical dispersion of about 15% in their optical luminosity and about 10% in the near-IR. The low dispersion and high luminosity of type Ia supernovae have made them the most widely sought long-range standard candle. They can be used to measure distances over a range of 40–5000 Mpc, but they are rare; about one supernova goes off each decade within a distance of about 20 Mpc from us. Thus there are only a few good examples near enough that their host galaxies also include visible Cepheids, and some of those supernovae date to the era of less accurate photographic observations.
The megamaser method, 3 first applied to the galaxy NGC 4258 (shown in figure 5), some 8 Mpc away, has proved to be an effective approach for making direct distance measurements beyond the Local Group. The technique involves submilliarcsecond-resolution imaging and monitoring of water-vapor maser emission from circumnuclear disks surrounding the black hole in active galaxies such as NGC 4258. Basically, if a masing blob that is acted on mainly by the gravitational pull of the central black hole moves in the disk with a velocity v and centripetal acceleration a, then the distance to the disk can be determined through

Figure 5. The galaxy NGC 4258 contains many megamasers, radiating masses of gas whose speed and centripetal acceleration allow observers to determine the distance to the host galaxy. (Courtesy of the Space Telescope Science Institute, NASA, and the European Space Agency.)

where ΔΘ is the apparent angular radius of the orbit and i is the orbit’s inclination, with i = 90° denoting that the orbit is seen edge on.
The inclination can be determined via the angular offset of “systemic” masers from the central black hole. (Systemic masers have velocities close to the recession velocity of the galaxy.) The other parameters on the right-hand side of the equation can be determined with very long baseline interferometry observations of blueshifted and redshifted blobs coupled with monitoring of maser spectra over a long period of time. Thus the distance can be accurately determined. Unfortunately, astronomers have not found any other megamaser system that can be observed with a precision comparable to that for NGC 4258; indeed, the potential precision of the next-best observed candidates—less than a dozen—is several times worse. Rarity of megamaser systems may thus limit the ultimate precision achievable by the method.
When a galaxy lies along the line of sight to a more distant source galaxy, strong gravitational lensing can produce multiple images of the source. If the source happens to be variable, the time delays between the different images can be accurately measured through careful monitoring of light curves. When combined with a model for the mass distribution in the gravitational lens, which determines the gradient of the gravitational potential, the time delays can be used to convert angular separations into absolute distance. As with megamasers, rarity of suitable systems may ultimately be a significant limitation of the lensing method.
A miscellany of methods
Other distance indicators have contributed less in recent times to the accurate measurement of the Hubble constant due to their larger systematic errors or complexity. Those include the Tully–Fisher relation between the luminosity and maximum rotational velocity for a spiral galaxy; the fundamental plane, a correlation among the effective radius, effective surface brightness, and central velocity dispersion in elliptical galaxies; the tip of the red-giant branch, a method based on the luminosity of the brightest red giants in a galaxy; and methods relying on core-collapse supernovae, globular clusters, or planetary nebulae.
Two rather interesting methods have, unfortunately, failed thus far to produce very accurate results. One is based on the Sunyaev–Zeldovich effect. The phenomenon involves the hot (kT ≈ 10 keV) gas trapped in the potential wells of galaxy clusters. Photons from the cosmic microwave background that pass through a cluster have a small probability of interacting with energetic electrons in the intracluster gas. The inverse Compton scattering that ensues boosts the energy of the microwave background photon and, in turn, generates a small distortion in the spectrum of the microwave background at frequencies near 218 GHz—slightly more photons at higher frequencies and slightly fewer at lower frequencies than would otherwise be expected.
The magnitude of the effect is proportional to the integral of the pressure along the line of sight, ∫neTedl, where ne and Te are the electron number density and temperature, respectively. Since the x-ray emission from the intracluster medium is proportional to a different power of the density, a combination of the two measurements can, given some assumptions about the cluster geometry, determine the distance to the cluster without the need to calibrate against other standard candles. At present, systematic uncertainties associated with the method are 15–30%.
The second physical method is that of surface brightness fluctuations. That method, developed primarily by astronomer John Tonry and collaborators, exploits the obvious fact that the ability to resolve stars within galaxies is distance dependent.
4
More specifically, for every region of a galaxy one can measure the average flux per pixel, g, and the pixel-to-pixel root-mean-square variation, σ. Since the flux obtained in a pixel is received from N stars of average flux
The Hubble constant and dark energy
The new standard model of cosmology, largely established in the past 15 years, is dominated by two poorly understood components, dark matter and dark energy. Dark energy, the cause attributed to the accelerating expansion of the universe, is the larger enigma. It may represent the energy of the vacuum, but in that case its observed density is puzzlingly low. It may be associated with some scalar field, but the time dependence of that field remains an open question.
The empirical approach to understanding dark energy is to measure its equation-of-state parameter, w = P/ρc2, where P is the pressure, ρ is the density, and c is the speed of light. If the dark energy represents vacuum energy (or, equivalently, Einstein’s cosmological constant), then w = −1. Alternatively, the cosmic acceleration could result from a decaying scalar field, a low-energy imitation of the field that drives inflation. If so, it may be possible to detect a time dependence of w or a scale dependence indicating a breakdown of general relativity.
A wide range of ultraprecise cosmological measurements in the planning stages may address the nature of the dark energy. Measurements of the Hubble constant based on local objects with redshifts of up to about 0.1 should yield a precision approaching 1%. Combined with the precise cosmic microwave background observations from WMAP, the Atacama Cosmology Telescope, the South Pole Telescope, and the Planck satellite, those measurements can constrain w to about 2%.
Local measurements of H0 are complementary to other, higher-redshift probes. Indeed, we’d be remiss if we did not note an apparent tension, at the 3σ level, between current measurements of H0 based on local objects and its deduced value based on the standard cosmological model and new Planck results for the cosmic microwave background. That tension may be the harbinger of new physics, but past experience indicates that discrepancies below 3σ often disappear when more data are available.
Toward more precise determinations
To achieve the goal of 1% precision in local distance measurements requires refinements to mitigate the systematic errors that dominated prior uncertainties. Here we focus on progress with the distance-ladder approach, though we expect progress on other fronts as well.
Only the better distance indicators are likely to yield improved precision. Moreover, they will achieve that end only if, to the extent possible, all the individual exemplars are treated identically in constructing the distance ladder. The availability of multiple types of distance indicators may offer a way to crosscheck distance determinations, but only if the various indicators are independent and offer comparable precision.
With a number of crucial refinements made possible in recent years, the ladder connecting geometrical distances to Cepheids and type Ia supernovae has the potential to reach the desired goal of 1% precision. New instruments on Hubble—in particular, the Advanced Camera for Surveys and the Wide Field Camera 3 (WFC3)—have doubled the telescope’s range and thus have afforded an eight-fold increase in opportunities for calibrating supernovae via Cepheids. Greater accuracy comes from the replacement of older, problematic data with modern digital data. Past calibrations of type Ia supernovae via Cepheids made use of photographic plates obtained in 1937, 1960, and 1974. Those analog data could not readily benefit from modern digital techniques used, for example, to remove background light from the host galaxy and ensure that all observations are looking at the same portion of the spectral energy distribution. Other supernova data obtained within the Wide Field Planetary Camera 2 range suffered from a missed peak in the luminosity or heavy extinction due to dust, or they were atypical of type Ia supernovae. The SH0ES (Supernova H0 for the Equation of State) team led by one of us (Riess) and Lucas Macri is halfway through calibrating 17 ideal type Ia supernovae with the help of the new Hubble instruments.
After 10 years of radio observations of the water megamasers in orbit around NGC 4258’s supermassive black hole, Elizabeth Humphreys and colleagues have recently determined the distance to the galaxy 5 to be 7.60 Mpc, with an uncertainty of 3%. The improved distance estimate will serve to better calibrate Cepheids. New instruments on Hubble allowed Macri and colleagues to discover hundreds of Cepheids in NGC 4258 and to calibrate their luminosities. 6 The SH0ES team observed those Cepheids in the near-IR with the WFC3 to reduce past systematic uncertainties in the dependence of Cepheid luminosities on the star’s chemical composition and on the variety of obscuring dust.
Another improvement came from observing Cepheids with a given range of periods both in galaxies hosting supernovae and in NGC 4258, the anchor of the SH0ES distance ladder. Armed with such observations, astrophysicists can reduce systematic uncertainties in the period–luminosity relation. Observations of Cepheids in supernova host galaxies and NGC 4258 have now been taken with the same instrument, a move that removes uncertainties in flux calibration. Those improvements reduced the uncertainty in the Hubble constant to about 5% by 2009 and 3% two years later. 7 Yet just as the SH0ES distance ladder was completed, construction had begun on a potentially more powerful distance ladder.
Trigonometric parallaxes to Cepheids in the Milky Way can, in principle, anchor a distance ladder to reach 1% precision. Using the fine guidance sensors on board Hubble, in 2007 the astrometry science team led by G. Fritz Benedict measured the parallaxes of the 10 nearest Cepheids 8 with a mean error of 3%. Their sample provides an anchor for the distance ladder that’s different from the one used by the SH0ES team or the earlier key project. A ladder built on that alternate anchor gives similar results for the value of H0, but at the cost of giving back the reductions in systematic errors realized by the SH0ES team.
However, the new spatial-scanning capability of the WFC3 can provide even better parallax measurements and crucial flux measurements of bright Cepheids. A group led by Riess and Stefano Casertano has begun to use spatial scanning to measure parallaxes of the less common and previously uncalibrated longer-period Cepheids prevalent at distances of 1–3 kpc. By the end of this decade the European Space Agency’s Gaia mission will also provide Cepheid parallaxes out to 10 kpc. Recent mid-IR calibrations of Cepheids as part of the Carnegie Hubble Program can further improve the reliability of the local span of the distance ladder. 9
If the measurements enabled by WFC3 are to serve as the anchor for a new, potent distance ladder, the improvements in techniques related to secondary distance indicators already achieved will also need to be retained and extended. Type Ia supernovae have less scatter in the near-IR than the optical, so near-IR measurements may put a 1% measurement of H0 within reach. When the new ladder is completed during Hubble’s third and likely final decade, it will be a powerful tool, sturdy enough to probe the mysteries that still remain in the standard cosmological model.
References
1. M. Livio, Nature 479, 171 (2011). https://doi.org/10.1038/479171a
2. E. Hubble, M. L. Humason, Astrophys. J. 74, 43 (1931). https://doi.org/10.1086/143323
3. J. Herrnstein et al., Nature 400, 539 (1999). https://doi.org/10.1038/22972
4. J. L. Tonry, Astrophys. J. 373, L1 (1991). https://doi.org/10.1086/186037
5. E. M. L. Humphreys et al., Astrophys. J. 775, 13 (2013). https://doi.org/10.1088/0004-637X/775/1/13
6. L. M. Macri et al., Astrophys. J. 652, 1133 (2006). https://doi.org/10.1086/508530
7. A. G. Riess et al., Astrophys. J. 730, 119 (2011). https://doi.org/10.1088/0004-637X/730/2/119
8. G. F. Benedict et al., Astron. J. 133, 1810 (2007). https://doi.org/10.1086/511980
9. A. J. Monson et al., Astrophys. J. 759, 146 (2012). https://doi.org/10.1088/0004-637X/759/2/146
10. V. Trimble, arXiv:1307.2289 .
More about the authors
Mario Livio is an astrophysicist at the Space Telescope Science Institute in Baltimore, Maryland. Adam Riess is an astrophysicist at the STScI and a professor of astronomy and physics at the Johns Hopkins University in Baltimore.


