Visualizing many-body dynamics
DOI: 10.1063/PT.3.2428
New experimental tools are providing ever-finer glimpses into the attosecond world of electron motion in molecules. But at those time scales, the dynamics are often intractably complicated by strong electron–electron correlations. Embodied in the full many-body wavefunction, such correlations greatly encumber the task of deciphering the experimental results. (See Physics Today, May 2012, page 16 .)
A variety of methods have been developed for calculating the time-dependent wavefunction of electronic excited states. Any technique, though, must distill the results down to a comprehensible picture of the essential features. As Anthony Dutoi has recently shown, an approach based on what’s known as the one-body reduced density operator provides a compact way to extract and visualize many aspects of the dynamics.
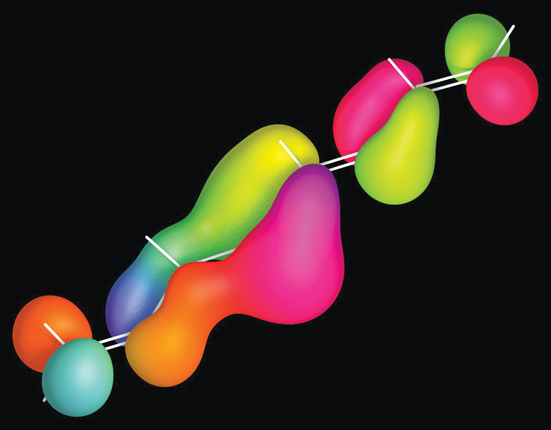
This sample visualization is a snapshot from a simulation tracing the evolution of an electronic excitation in the molecule H2C=CH−BH−BH−CH=CH−CH=CH2; the white lines represent the molecular bonds. The excitation originated at the carbon–carbon double bond at the lower left. Here, a femtosecond later, the excitation’s dominant component—the most-occupied natural particle orbital—is coherently spread along the entire length. Colors map the phase of the one-electron wavefunction; the color gradients indicate net momentum to the left. A similar visualization (not shown) of the vacancy or hole created by the excitation reveals it remains trapped in its original location. (A. D. Dutoi, Mol. Phys. 112, 1, 2014, doi:10.1080/00268976.2013.845311 ; image submitted by Anthony Dutoi.)

Image submitted by Anthony Dutoi.
To submit candidate images for Back Scatter, visit http://contact.physicstoday.org .


