What’s your survey telling you?
DOI: 10.1063/1.2812135

It may seem easy to construct a survey, and in fact, no one ever died trying to make one. But there are hundreds of ways to do it wrong and only a few ways to do it right. The right ways are documented in an extensive body of scientific literature on questionnaire design. That research has shown that the ways questions are worded and answer choices are presented affect the answers that respondents give. It also has shown that the ways questions are presented affect respondents’ willingness to answer.
You may ask, Is research done on a topic like this really science? The answer is yes, if the researcher follows certain principles. Usually the researcher will design an experiment in which multiple versions of a question or questionnaire are shown to respondents. The best research uses a representative, random sample of respondents, which allows the researcher to make inferences about how the results would generalize to the population. In addition, journal-published research on surveys goes through the same rigorous peer review process as research in the physical sciences.
In this tutorial we discuss some of the main findings from the scientific literature on question wording and survey design. You may want to consider them if you are planning to conduct any type of survey for your institution, company, class, or committee.
Asking questions
The world is complicated, but questionnaires should be kept simple. The respondents are giving you their time pro bono. Make sure that the questions are easy to answer and that they give you the data you need.
Ensuring that the questions give you the right data is perhaps the most important part of any survey. Behind every survey should be a research question or a hypothesis that you want to test. Only questions that directly address the research question or hypothesis should appear on the survey. Avoid the temptation to put in a question merely because you think it would be interesting to know the answer. It’s only interesting if it directly speaks to the research question or hypothesis. Always ensure that the interpretation of your results is based on the questions you actually asked.
Subtle differences in wording can make a large difference in answers. Say that you ask, “How important is this policy?” The question may sound straightforward, but actually, it does not contain enough information for the respondents to answer it or for you to interpret the results. Do you really want to know how important the policy is to the respondents, or do you want to know the respondents’ opinion about how important the policy is to some group, such as the faculty or even to society in general? Rewrite your question to make such distinctions clear.
Avoid the use of the word “not” in questionnaires. Respondents read questions quickly and may miss the word altogether, thus creating what is called measurement error. Reword your question; or if that is not possible, capitalize “NOT” to make it stand out.
Research has long shown that answers to balanced questions are different from answers to unbalanced questions. A question that is balanced acknowledges the possibility of different opinions on a topic. For example, this question is balanced: “Do you agree or disagree that a mission to Mars should be funded at the expense of all other NASA programs?” Here is an unbalanced version: “Do you agree that a mission to Mars should be funded at the expense of all other NASA programs?” Balanced questions reduce the tendency of respondents to endorse the viewpoint presented in the question. 1,2
Providing correct answer sets
Survey data don’t always reflect reality; sometimes they are artifacts of the answer choices provided. In one experiment, 3 researchers asked two groups of students how much time they spend studying. One group was given the answer choices
-
▸ less than .5 hour per day
-
▸ .5–1 hour per day
-
▸ 1–1.5 hours per day
-
▸ 1.5–2 hours per day
-
▸ 2–2.5 hours per day
-
▸ more than 2.5 hours per day.
The other group was asked to choose from a similar set of six selections that began with “less than 2.5 hours per day” and ended with “more than 4.5 hours per day.” On a paper questionnaire, 23% of the first group reported studying more than 2.5 hours per day. But among the second group, 69% reported studying more than 2.5 hours per day. Clearly, respondents reacted to the answer choices given, reporting more hours when the answer choices included longer time periods. In this case a better way to put the question is to ask, “How many hours per day do you study? ______ hours.”
In general, answer sets usually yield better data when they provide more choices rather than fewer. For example, using a three-point scale—too hard, about right, too easy—yields less useful data than a five-point scale that also includes “much too hard” and “much too easy.” Many respondents avoid answers at the extremes. So their answers will cluster in the middle of a 3-point scale but show differentiation on a 5-point scale.

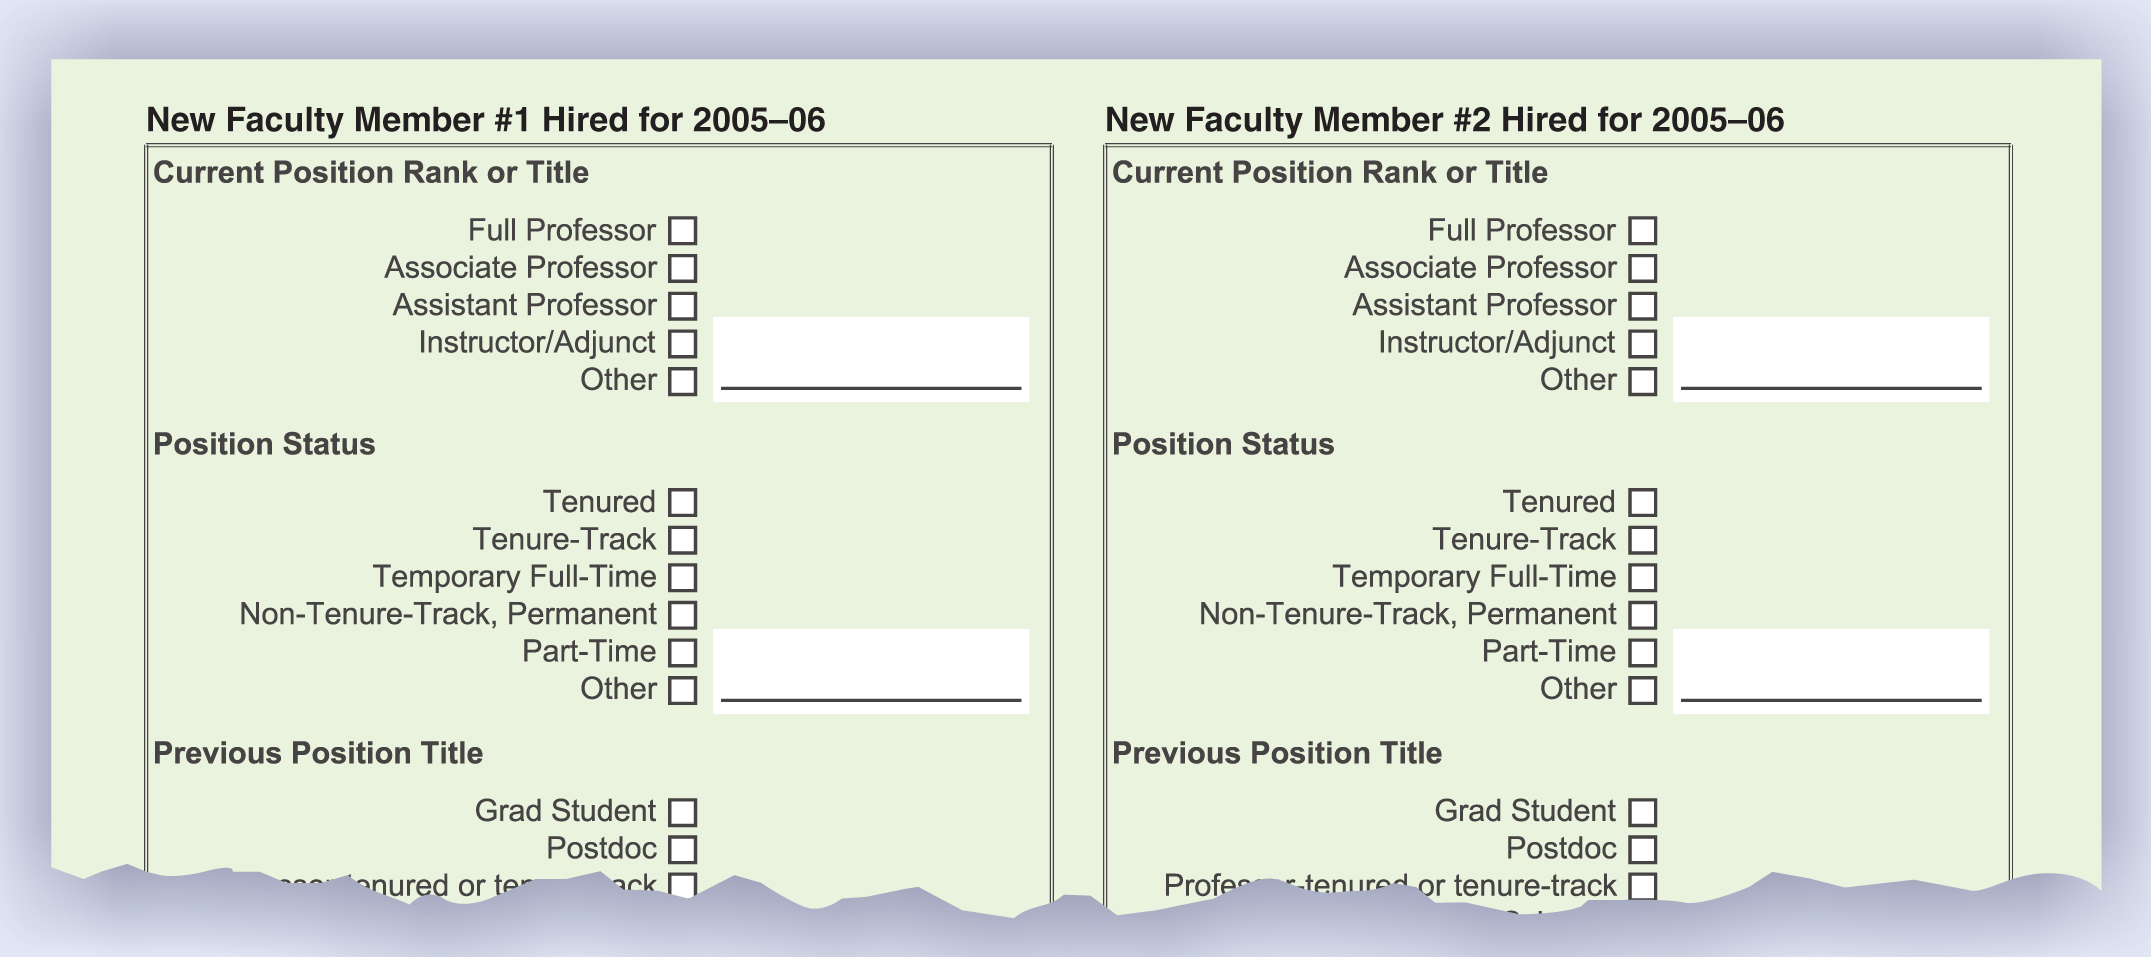
In an academic workforce study prepared by the American Institute of Physics, respondents were asked about the characteristics of the faculty they hired. The inquiry could have been presented as a matrix, but response rate increases if separate questions are asked about each new hire: The questionnaire is longer, but it’s easier to answer.
Inexperienced researchers will often ask a yes–no question when they could have collected better data by asking something more precise. For example, asking “Do you attend the annual meetings of the Society of Really Smart Physicists? Yes/no” yields lower-quality data than asking “During the last two years, how many meetings of SRSP have you attended?” The revised question is also superior because it provides a reference period (two years) and allows the respondents to better focus their answers.
Asking a more precise question usually provides better data, but sometimes it places too much of a burden on the respondents. The classic example is a question about income. Respondents may not be willing to tell you their exact salary, but they may be willing to check an appropriate category.
Increasing response rates
Sometimes novice survey researchers err on the side of making a questionnaire short in the hopes that the respondents will believe that it is easy to answer. However, shortening the questionnaire sometimes backfires and results in a questionnaire that is difficult to answer and produces a concomitant reduced response rate.
Here is an example of a question that is both difficult to answer and whose results are impossible to interpret. 3
Which of these five statements best describes this dean:
-
▸ Innovative but lacking in leadership qualities
-
▸ About the same on innovation and leadership qualities
-
▸ Stronger on leadership than innovation
-
▸ A born leader
-
▸ A real innovator.
The committee was interested in faculty members’ evaluations of the dean on two qualities: leadership and innovation. However, questions that present so much information in the answer choices require significant effort on the part of the respondents, who must carefully consider the differences among the choices before answering. In this case, two separate questions should be asked: one about leadership, one about innovation. The one-question approach actually increases the burden on respondents.
Another common example of a compact presentation being a poor choice is a matrix with questions down one side and answer choices across the top. This format makes it difficult for respondents to answer, and should be avoided. The figure shows a better approach.
First impressions matter. The first few questions set a tone, and respondents will develop assumptions about the entire questionnaire and about the goals of the project. If they develop the wrong assumptions, many will drop out and you will get a poor response rate. The first question on a survey should be relatively easy to answer and interesting to the respondents. Demographic questions should never be first. They may be easy to answer, but they are not interesting.
Poor decisions about question wording, answer choices, and format can make a questionnaire difficult for respondents to answer and difficult for you to interpret. Be aware of the burden you are placing on your colleagues or your students in terms of the time required to complete the questionnaire. Don’t ask for more detail or information than you need. Above all, take the time to familiarize yourself with the research on survey design, or find an expert. Most universities have either a survey research center or a faculty member who is an expert in survey design. Ask for help, because in designing a questionnaire, common sense is necessary but NOT sufficient.
References
1. H. Schuman, S. Presser, Questions and Answers in Attitude Surveys: Experiments on Question Form, Wording, and Context, Sage, Thousand Oaks, CA (1996).
2. E. Shaeffer et al., Public Opin. Q. 69, 417 (2005). https://doi.org/10.1093/poq/nfi028
3. D. A. Dillman, Mail and Internet Surveys: The Tailored Design Method, 2nd ed., Wiley, Hoboken, NJ (2007).
More about the authors
Rachel Ivie is research manager at the American Institute of Physics Statistical Research Center, and Roman Czujko is the center’s director.
Rachel Ivie, American Institute of Physics Statistical Research Center, US .
Roman Czujko, American Institute of Physics Statistical Research Center, US .


