Waking up to temperature inversions
DOI: 10.1063/PT.3.4051

In the troposphere, the bottom layer of the atmosphere, low-lying air warmed by the ground is usually at a higher temperature than the air above it. When the warm air rises and the cooler upper air descends, the lower atmosphere naturally mixes, a process that can disperse pollution concentrated near the ground. Sometimes, though, air next to the ground cools faster than the air above it. Warmer, lighter air then lies above cooler, heavier air and the freshening effects of mixing are suppressed. Meteorologists call that phenomenon a surface-based temperature inversion.
Early warning of such an event can be extremely beneficial to areas prone to strong or persistent inversions. At the county health department where I work, in Pittsburgh, Pennsylvania, advance notice of an inversion allows us—pollution inspectors, engineers, health professionals, emergency responders, and others—to better prepare for deterioration of air quality and its potential effects: malodors, asthma attacks, increased hospitalization, and the like. Inversions can even have some surprising consequences. For example, they can contribute to aerosol spray drift, a significant problem when farmers and others apply pesticides.
In this Quick Study, I explain the causes of surface-based inversions and describe some of the data meteorologists use to confirm and forecast them.
Understanding inversions
Over the course of time, the atmosphere can be calm and stable, violently unsettled, or anything in between. The inversions that bring unhealthy levels of pollution are associated with a stable atmosphere.
In a word, surface temperature inversions are about energy loss at the ground or energy gain above. They generally occur under the influence of high pressure. The dry, clear air that typically accompanies high-pressure systems facilitates the radiation of energy from the ground during the night. Figure
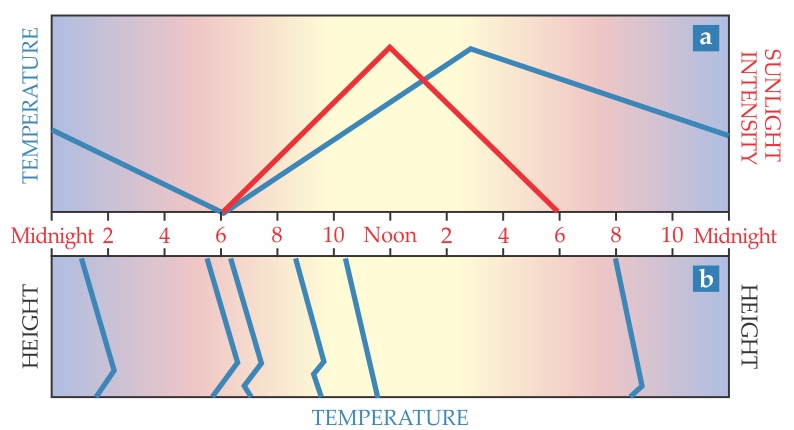
Figure 1.

Temperature inversions tend to be strongest when sunlight is least intense, in the early hours of the morning. (a) Temperature (blue line) and solar intensity (red line) vary regularly during the course of a typical 24-hour day. (b) Temperature profiles—that is, plots of temperature as a function of altitude—also evolve throughout the day. Before the Sun rises, the profile shows a temperature inversion; the air temperature near the ground increases with height. In Pittsburgh, Pennsylvania, such inversions occur just under half the time. By 10:00am or so, the sun has burnt off the early-morning inversion; near the ground, temperature falls with altitude, typically at a rate of 0.65 °C/100 m. By 8:00pm, after the sunset, a new inversion starts to form. (Images courtesy of the Allegheny County Health Department.)
Several other mechanisms can cause warm air to reside above cool air and create an inversion. Energy gain aloft can be achieved, for example, when strong, persistent southern winds inject energy into higher air. Or a warm front might advance into an area and override cooler, denser air with warmer, lighter air. In Pittsburgh and other places with frigid winters, energy loss at the ground can be accelerated by snow and ice cover.
Forecasting and detection
Artistry often is creatively combined with science in the crafting of a weather forecast. After years of observing the atmosphere, studying patterns, and learning about prognostic products, meteorologists develop an intuition that can be applied to analysis and its attendant forecasting of temperature inversions and other events. That’s the good news. The bad news is that a lot of variables combine to produce a weather event, and they interact in complex ways. So the clarity with which meteorologists can see upcoming weather conditions can turn out to be not so good, especially if the forecasters are tasked with predicting exact time and place.
Be that as it may, meteorologists are eager for data that can help in their forecasts. At least twice a day—shortly after 6:00am eastern standard time (EST) and again 12 hours later—the US National Weather Service (NWS) launches about 90 measurement transmitters, called radiosondes, from the US and the Pacific Islands; it also supports 10 radiosonde stations from the islands in the Caribbean region. The transmitters, tethered to balloons that carry them aloft (see figure
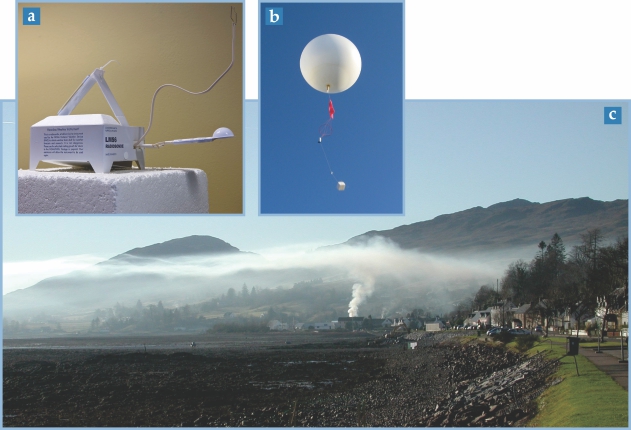
Figure 2.

Radiosondes collect data in the atmosphere and transmit them to the ground. (a) A typical radiosonde is (b) tethered to a balloon that carries it aloft. The data it collects can help meteorologists document and predict (c) pollution-trapping temperature inversions. (Radiosonde photo courtesy of the National Weather Service; balloon photo courtesy of the Radiosonde Museum of North America; photo of inversion over Lochcarron, Scotland, by JohanTheGhost, CC BY-SA 3.0 .)
The daily radiosonde observations are reported at 7:00am and 7:00pm EST and are used throughout much of the world to help interpret weather conditions in the upper atmosphere. In air-pollution meteorology, the observations are critical to characterizing the potential for air dispersion in the lower portion of the atmospheric boundary layer, which extends from Earth’s surface up to a few kilometers, depending on atmospheric conditions.
Meteorologists often combine the morning radiosonde results with satellite data and other observations to produce their forecasts. The vertical component of wind velocity, which also indicates horizontal air motion and the extent of atmospheric mixing, is one particularly important bit of information that is derived from radiosonde data. Forecasters in the Pittsburgh area are keenly interested in conditions west of Pittsburgh, because airflow in the US is generally from west to east.
The NWS issues a wide array of aids, such as historic, real-time, and prognostic maps and charts that supplement radiosonde data by showing surface and higher-altitude temperature, moisture, and winds. NOAA also produces helpful prognostic tools. Its state-of-the-art model, with 3 km resolution, takes clouds and convection into account and is updated every hour to incorporate the latest radar data. Such models can be particularly useful for fine-tuning a forecast of the strength of a surface inversion.
Pittsburgh and its hilly environs
The Allegheny County Health Department considers the area it serves to have an inversion if the Pittsburgh NWS office reports temperatures aboveground that are at least 1 °C higher than ground temperature. According to that definition, the Steel City sees a morning inversion about 160 days a year. The radiosonde data have been fairly consistent during the past 10 years, although inversions seem to be a little more frequent now than they were a decade ago. Typically the highest temperature occurs about 240 m aboveground, where it is about 4 °C warmer than at the surface. Inversions over Pittsburgh tend to dissipate by about 3.5 hours after sunrise. In the plentiful valleys and low-lying surrounding areas, inversions can be particularly intense and persistent.
The season of the year influences inversions. After all, the angle at which the Sun’s rays hit Earth and the amount of time between sunrise and sunset are crucial to the warming of the planet’s surface. Intrayear trends are not strong for the Pittsburgh area, but they are visible in the monthly data. In the fall months, inversions are relatively strong, persistent, and frequent. If you’d like to visit us when the inversions are at their shortest and weakest (although still quite frequent), come in the summer. Abbreviated, weak summertime inversions make sense for a city in the northern US. In summer, when the Sun sets later in the day and rises earlier in the morning, there’s less time for the inversion to form at night. And if a ground-level inversion does form, the morning sun quickly warms Earth to dissipate it.
I acknowledge the assistance of Christopher Letzelter and Fiona Gao at the Allegheny County Health Department, Matthew Kramer at the Pittsburgh National Weather Service, and Stanley Penkala at Air Science Consultants in Bridgeville, Pennsylvania.
References
► L. M. Grenci, J. M. Nese, D. Babb, A World of Weather: Fundamentals of Meteorology, 6th ed., Kendall Hunt (2018), chap. 8.
► J. W. Enz, V. Hofman, A. Thostenson, Air Temperature Inversions: Causes, Characteristics and Potential Effects on Pesticide Spray Drift, rep. no. AE1705 (rev.), North Dakota State University Extension Service (November 2017).
► National Weather Service, “Radiosonde Observation,” www.weather.gov/upperair/factsheet .
More about the authors
Tony Sadar is a certified consulting meteorologist and air pollution administrator with the Allegheny County Health Department in Pittsburgh, Pennsylvania. He also teaches courses in environmental science at Geneva College in Beaver Falls.


