Turbulence in breaking waves
DOI: 10.1063/PT.3.3339


Ocean water covers 71% of Earth. And all of it is affected by turbulence, which mixes the ocean by transferring momentum, heat, chemicals, and organisms. Near the ocean’s surface, turbulence significantly influences the exchange of gas, heat, and momentum between the ocean and the atmosphere; those exchanges, in turn, affect weather and climate. Near-surface turbulence is greatest within breaking waves, in the whitecaps formed when a brisk ocean wind drags across the sea surface. There, turbulence, as measured by the rate at which energy is dissipated in turbulent motion, can exceed oceanic background values by more than seven orders of magnitude.
Whitecaps are white because they contain bubbles of air that are entrained and fragmented by the fluid turbulence generated by surface waves as they break. Those bubbles influence many of the exchange processes that affect weather and climate. As they dissolve in a breaking wave, they enhance the transport of greenhouse gases between the atmosphere and the ocean. After the wave breaks, rising bubbles scavenge and transport organic materials that become part of the droplets formed when the bubbles burst. The droplets and their chemical and biological baggage are an important source of cloud and ice nuclei over the oceans; they also alter the radiative transfer properties of the atmosphere.
The numbers and sizes of the bubbles entrained by breaking waves influence exchange processes, and those qualities are intimately linked to the fluid turbulence in the wave crest. Pressure fluctuations driven by turbulent flow threaten to rupture the bubbles by distorting them from their spheroidal form into irregular shapes. Small bubbles are stabilized against rupture by surface tension, but large bubbles are ripped apart. The scale at which the distorting and stabilizing forces are balanced—the Hinze scale—is connected to energy dissipation rates in the upper ocean. In a plot displaying how the number of bubbles decreases as a function of bubble size, the rate of falloff would abruptly increase at the Hinze scale. Empirically, two of us (Deane and Stokes) have found the scale to be roughly 1 mm in breaking ocean waves.
Our interest in whitecap turbulence is motivated by its relationship to bubble entrainment and breakup. How do the Hinze scale and therefore the bubble-size distribution change as wind forcing increases from a gentle breeze to a tropical cyclone? Ideally, turbulence measurements would be made in situ, in the open ocean. However, measurements in wind-driven seas pose many challenges. For example, early in the wave-breaking process, air can make up as much as 50% of a whitecap, a fraction that makes the region effectively impenetrable to probes that use sound or light. Moreover, it’s no easy task to mount instrumentation to within a few tens of centimeters of the sea surface during storms in which individual wave heights can reach beyond 10 meters.
Measuring turbulence in the lab
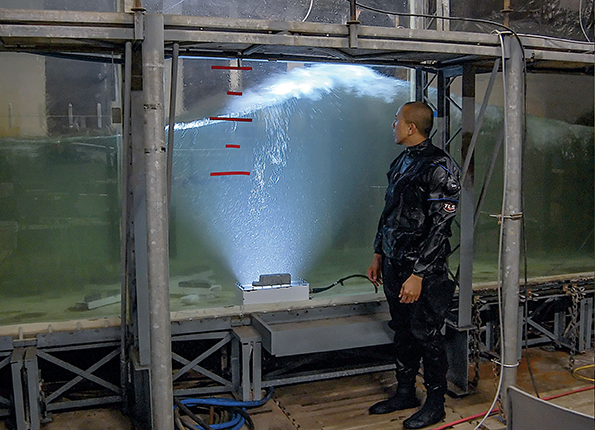
In view of the difficulty of field measurements, we turned to the hydraulics laboratory at the Scripps Institution of Oceanography at the University of California, San Diego. There, we could reproducibly generate breaking waves under controlled laboratory conditions; figure 1 shows an example. We used three different methods to measure the rate of turbulent energy-density dissipation during the first second or so of active wave breaking.

Figure 1. The breaking laboratory wave seen here is moving from right to left and is lit from beneath. We analyzed turbulent, air-entraining flow in white, foamy wave regions like that shown just below the water surface. Electrical engineer James Uyloan helps show the scale of the experiment.
First, we used surface displacement measurements made upstream and downstream of the break point to calculate the total energy in the wave before and after breaking. The difference in those energies approximates the total energy lost to breaking, though the estimate needs to be refined to account for the potential energy associated with suspended bubbles. Once that correction was made, we determined the dissipation rate averaged over the volume of the whitecap and duration of the measurements. In our second approach, we estimated the Hinze scale from the break points in bubble-size distributions obtained from tedious, manual analysis of photographs taken through the glass wall of the wave tank. In conjunction with a model for bubble fragmentation, such a determination also yields a value for the average turbulent dissipation rate.
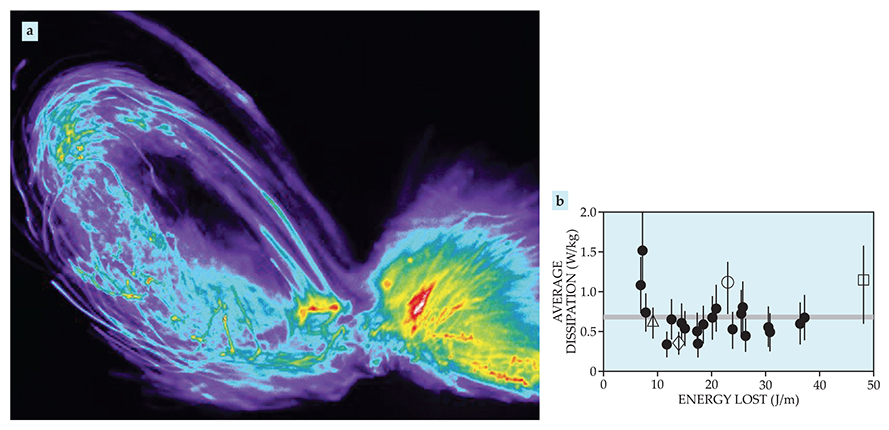
The third method relies on the probabilistic bioluminescent flash response of single-celled marine organisms called dinoflagellates as an indicator of fluid shear stress. We measured the stimulated bioluminescence in breaking crests with sensitive cameras mounted on a robotic motion system programmed to track individual breaking waves. From images such as the one shown in figure 2a, we could obtain maps of the time-varying fluid shear stress inside breaking waves, and from such maps we could determine the turbulent dissipation.

Figure 2. Bioluminescence in response to shear stress is one tool we use to measure turbulent dissipation. (a) Flash-rate images such as this one obtained with dinoflagellates enable quantitative maps of the time-varying fluid shear stress in a breaking wave. (In this false-color image, warm colors indicate more intense bioluminescence.) The wave generating the pattern moved from left to right. (b) Experiments on four waves contributed to this plot, in which the average rate of turbulent energy-density dissipation in waves is shown as a function of the total energy lost, normalized by the width of the wave tank. Filled circles indicate results obtained via wave-height or bubble-distribution measurements. Open symbols indicate results obtained from bioluminescence; each open symbol represents its own wave. The total energy lost in the four waves differs from trial to trial, but the average dissipation rate does not, a phenomenon we call turbulence saturation.
Turbulence saturation
We applied our three measurement methods to the breaking crests generated by four waves. Three of the waves had steep slopes, and they each had a different dominant wavelength. The fourth wave had a gentle slope. Figure 2b shows one of the surprising results of our study: For all four waves, the average turbulent energy-density dissipation lies in the relatively small range of 0.8 ± 0.4 W/kg. And not only is the average dissipation nearly constant, it is significantly larger than the 10−5 to 10−2 W/kg generally observed near the surface.
We use the term turbulence saturation to describe the invariance of turbulence intensity with wavelength and slope. One consequence of the saturation is that the Hinze scale is largely independent of wave slope or scale. Such invariance is observed in the laboratory bubble-size distributions, for which the Hinze scale is 1.5 ± 0.3 mm. The few determinations of the Hinze scale obtained from ocean data lie in the larger range of 0.7–1.7 mm. One possible explanation for turbulence saturation is that the bubbles themselves somehow limit the degree of turbulence intensity. Another is that, for longer or more steeply sloped waves, the breaking wave penetrates more deeply into the ocean and the large wave’s greater energy is dissipated because of the increased volume of water affected rather than greater turbulence intensity.
Whatever its cause, turbulence saturation would have important implications for bubble-mediated exchange processes across the air–sea interface. A limit on fluid turbulence would mean that the laboratory breakers we studied have a two-phase flow, bubble Hinze scale, and air fraction similar to those in 10-m-high storm waves. Evidence for such scale invariance in the ocean was obtained by Zhongxiang Zhao and colleagues, who measured underwater acoustic noise in tropical cyclones having wind speeds of 10 m/s and 50 m/s. Not surprisingly, they found that the overall power of the noise increased with increasing wind speed. But the shape of the noise spectrum, which is closely related to the numbers and sizes of bubbles formed within breaking wave crests, remained relatively constant. On the other hand, observations by Johannes Gemmrich of fluid turbulence in waves breaking on a freshwater lake do not show evidence of turbulence saturation. The paucity of field observations and the differences in field and laboratory studies make the study of turbulent dissipation in wave crests an exciting and active area of research.
References
1. G. B. Deane, M. D. Stokes, “Scale dependence of bubble creation mechanisms in breaking waves,” Nature 418, 839 (2002). https://doi.org/10.1038/nature00967
2. G. B. Deane, M. D. Stokes, A. H. Callaghan, “The saturation of fluid turbulence in breaking laboratory waves and implications for whitecaps,” J. Phys. Oceanogr. 46, 975 (2016). https://doi.org/10.1175/JPO-D-14-0187.1
3. J. Gemmrich, “Strong turbulence in the wave crest region,” J. Phys. Oceanogr. 40, 583 (2010). https://doi.org/10.1175/2009JPO4179.1
4. J. Gemmrich, “Bubble-induced turbulence suppression in Langmuir circulation,” Geophys. Res. Lett. 39, L10604 (2012). https://doi.org/10.1029/2012GL051691
5. Z. Zhao, E. A. D’Asaro, J. A. Nystuen, “The sound of tropical cyclones,” J. Phys. Oceanogr. 44, 2763 (2014). https://doi.org/10.1175/JPO-D-14-0040.1
More about the authors
Grant Deane and Dale Stokes are research oceanographers at the Scripps Institution of Oceanography in La Jolla, California. Adrian Callaghan is a project scientist at Scripps, currently on assignment at Imperial College London.


