Sunspots and their cycle
DOI: 10.1063/PT.3.5183


Looking through clouds or haze, people have glimpsed sunspots for thousands of years. But it was only with the magnification provided by the telescopes of Galileo Galilei and others that sunspots could be studied in detail and tracked as they crossed the solar disk. With that newfound ease and visibility, the science advanced quickly. As early as 1613, Galileo published a book with a wonderfully detailed sequence of drawings that showed the Sun’s rotation.
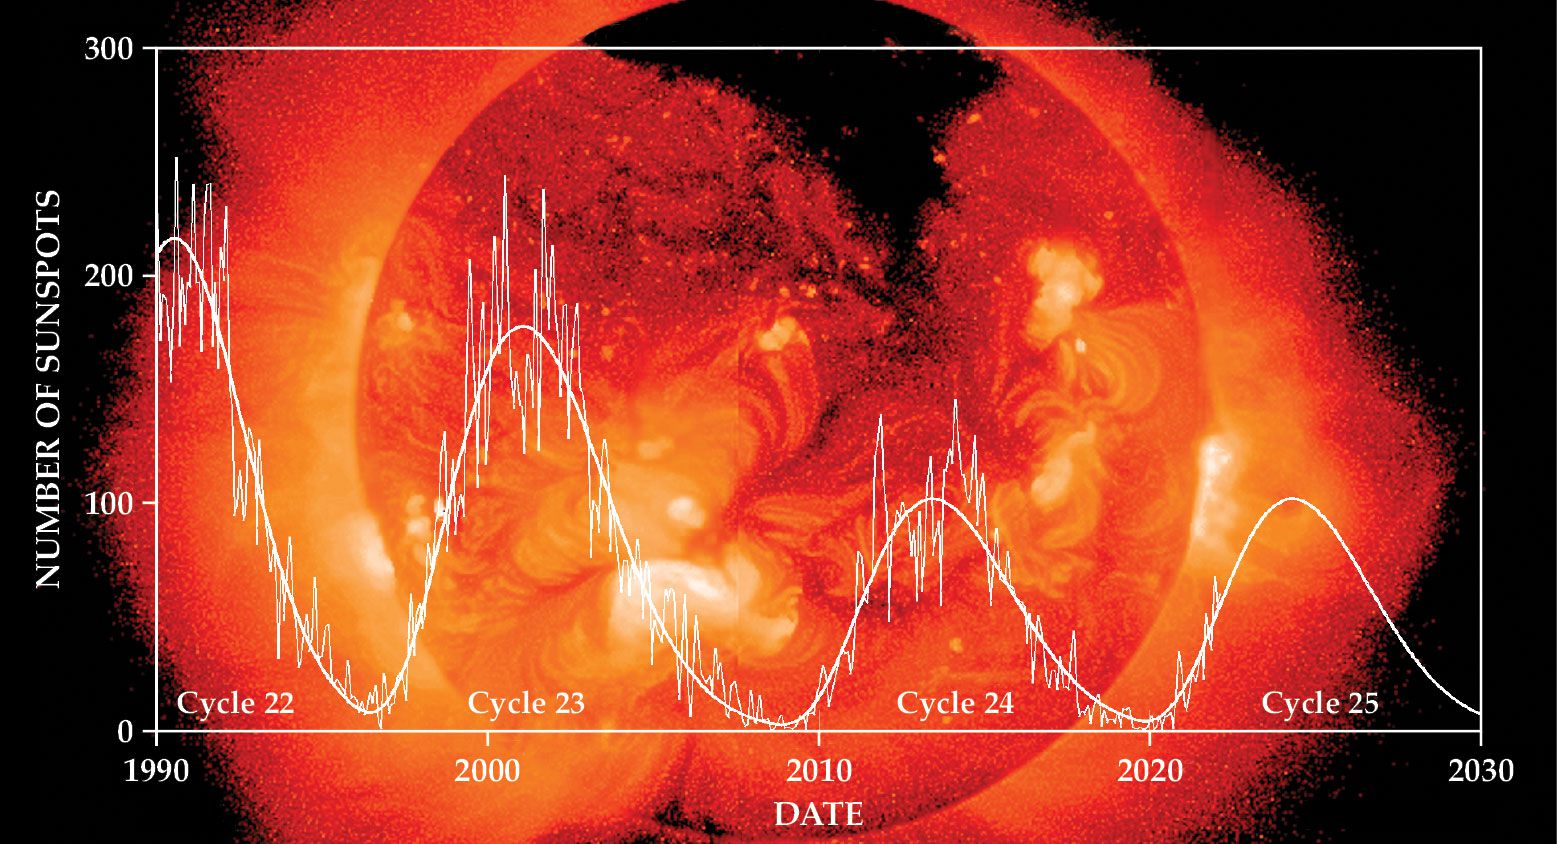
In the mid 19th century, Heinrich Schwabe realized that the number of sunspots varies cyclically. Rudolf Wolf soon found that they peak roughly every 11 years, as shown in figure
Figure 1.

The sunspot cycle. The periodic change in the Sun’s magnetic activity is measured by the variation in the number of sunspots on its surface. The rightmost part of the curve shows a prediction of the future sunspot activity. The background is an x-ray image from the Japanese Yohkoh spacecraft. At that wavelength, several-million-kelvin gas (orange) appears bright against regions of lower-density gas (black) extending toward the north pole—a magnetically defined “coronal hole,” which is the source of the fast solar-wind streams. (Courtesy of David Hathaway and Lisa Upton.)
A measure of magnetism
In 1908, George Ellery Hale used a new spectrograph and solar telescope at the Mount Wilson Observatory to determine that sunspots are fundamentally a magnetic phenomenon. The strength of the field in the spots can be measured using the Zeeman effect, a splitting of certain spectral lines by an amount dependent on the amplitude of the magnetic field. Sunspots typically have magnetic field strengths of 1000–3000 gauss, thousands of times stronger than the Sun’s global magnetic field.
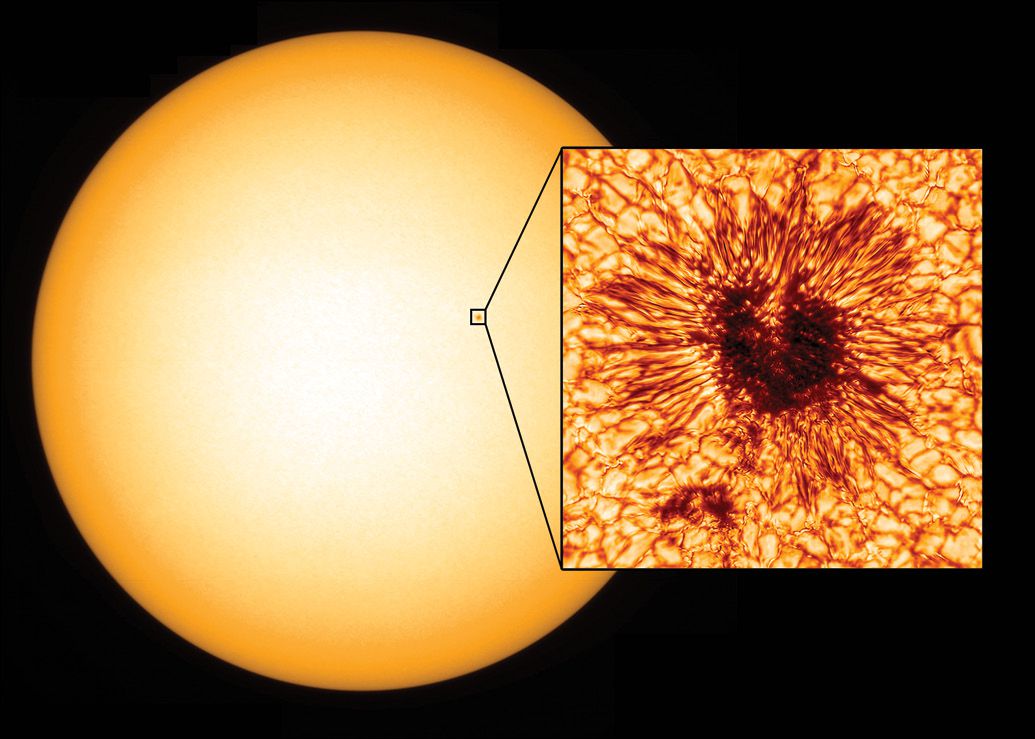
The strong field reduces the energy brought to the surface by convection and makes the sunspot about 1000 K cooler than the surrounding photosphere—the Sun’s visible surface (see figure
Figure 2.

A sunspot, up close. This high-resolution image (inset) was taken at 530 nm by the Daniel K. Inouye Solar Telescope on 28 January 2020. The wavelength corresponds to the green-yellow part of the visible spectrum—close to the Sun’s maximum brightness and, not coincidentally, the human eye’s maximum sensitivity. The sunspot is produced by the joint action of intense magnetic fields and rising hot gas. Notice the dark umbra and surrounding fibrils (the penumbra), around which appear background solar granules. A wider view from the Global Oscillation Network Group telescopes shows the whole Sun and the relative size of the 15 000-km-wide (Earth-sized) sunspot. (Courtesy of NSO/NSF/AURA.)
The National Solar Observatory’s new Daniel K. Inouye Solar Telescope, with a 4-m aperture, sits on the rim of Haleakala Crater in Hawaii at an altitude of 3000 m. Its enhanced performance at IR wavelengths allows better studies of sunspots, given the increased sensitivity to magnetic fields of the Zeeman effect in this part of the spectrum.
Normally, sunspots occur in groups, and individual spots are linked to others of opposite magnetic polarity, with additional magnetic complexity being produced in part as magnetic field lines in the solar convection zone get twisted and kinked as they rise into the photosphere. Scientists actually track the solar activity using the Wolf sunspot number, the number of individual spots added to 10 times the number of different groups.
The daily sunspot number is recorded by several institutions, including the World Data Center at the Royal Observatory of Belgium, in Brussels. Its website, which displays the sunspot cycle traced back more than 300 years, is updated monthly at http://sidc.oma.be/silso . Other sites tracking the sunspot cycle include the National Solar Observatory’s Synoptic Optical Long-Term Investigations of the Sun (SOLIS), recently relocated to the grounds of the Big Bear Solar Observatory in California. SOLIS’s suite of instruments provides a complete view of solar phenomena on a range of spatial scales—from hundreds of kilometers to the full solar disk—and on time scales from seconds to decades.
The sunspot cycle is actually a manifestation of a more general solar cycle of magnetic-linked activity, including solar prominences—relatively cool (a few 10 000 K) chromospheric plasma, suspended in the corona by the Sun’s magnetic field—and coronal holes, regions of highly extended magnetic field lines, which are the source of the fast solar wind. The activity also results in the occurrence of abrupt solar flares, during which the coronal plasma might reach tens of millions of kelvin or be propelled into the solar system as coronal mass ejections.
Observatories and tracking
Every day at http://solarmonitor.org , you can see a variety of telescopic observations and links to other solar-activity data. The website includes magnetic field maps and extreme-UV images from NASA’s Solar Dynamics Observatory. X-ray images from the defunct Yohkoh spacecraft and its current Hinode successor, for instance, show enhanced emission of hot (several million K) plasma in regions that overlay the sunspots, revealing the effects of concentrated magnetic fields in the corona.
In-depth studies of the evolution of the Sun’s magnetic field reveal that the full magnetic solar cycle lasts 22 years. The Sun’s differential rotation—faster at its equator than its poles—causes the field complexity to increase over a period of years. The increased complexity generates sunspots and coronal mass ejections, which release stored magnetic energy and allow the Sun’s global magnetic field to return to its initial state, but with the magnetic polarity reversed, after about 11 years. (See the article by Gordon Holman, Physics Today, April 2012, page 56 .)
In a given 11-year period between minima of solar activity, sunspot groups show a characteristic magnetic pattern of positive and negative polarities, with one polarity dominating in the leading spots in the group and the opposite polarity in the following spots (with an inverted sign in the northern and southern hemispheres). In the next 11-year cycle, that characteristic magnetic polarity behavior reverses until the Sun returns again to its initial state after more than two decades.
Over the past three decades, a system of solar observing stations known as the Global Oscillation Network Group has been mapping the Sun’s surface from six sites longitudinally distributed around Earth and provides images nearly continuously. Space-based observatories, such as NASA’s Parker Solar Probe and the European Space Agency’s Solar Orbiter, will continue to orbit the Sun ever more closely over the next few years.
Solar Orbiter has captured the first images of sunspots in the photosphere from a new perspective, away from the Sun–Earth line. In 2024, Parker Solar Probe will pass only 6.2 million km above the Sun’s surface, making it the first space mission to sample plasma and magnetic fields in the Sun’s extended atmosphere directly (see the article by Nour Raouafi, Physics Today, November 2022, page 28 ).
In addition to the new Inouye Solar Telescope, other terrestrial observatories with capabilities to take high-resolution sunspot images include the 1-m Swedish Solar Telescope and the Leibniz Institute for Solar Physics’s 1.6 m Gregor telescope, both in the Canary Islands, and the New Jersey Institute of Technology’s 1.6 m Goode Solar Telescope at the Big Bear Solar Observatory. Those telescopes all use adaptive optics to correct atmospheric distortions and sharpen the sunspot images.
But even casual observers—using simple, safely filtered solar telescopes—can, like Galileo, follow sunspots day-to-day or year-to-year and get a sense for the complicated magnetic processes happening in the solar atmosphere.
References
► National Center for Atmospheric Research High Altitude Observatory, https://www2.hao.ucar.edu/ .
► Solar Physics Group at NASA’s Marshall Space Flight Center, https://solarscience.msfc.nasa.gov .
► The European Space Agency’s Solar Orbiter, https://www.esa.int/Science_Exploration/Space_Science/Solar_Orbiter .
► Daniel K. Inouye Solar Telescope, https://nso.edu/telescopes/dki-solar-telescope/ .
► J. Brody, The Enigma of Sunspots: A Story of Discovery and Scientific Revolution, Floris Books (2002).
► L. Golub, J. M. Pasachoff, The Sun, U. Chicago Press (2017).
► J. B. Zirker, Sunquakes: Probing the Interior of the Sun, Johns Hopkins U. Press (2003).
More about the authors
Jay Pasachoff (1943–2022) was the Field Memorial Professor of Astronomy at Williams College in Williamstown, Massachusetts. Dan Seaton is a principal scientist in the department of solar and heliospheric physics at the Southwest Research Institute in Boulder, Colorado. Kevin Reardon is a scientist at the National Solar Observatory and an adjunct professor at the University of Colorado Boulder.


