Seeing is believing? Sonographic artifacts
DOI: 10.1063/1.2718769
Medical diagnostic imaging with ultrasound—sonography—is accomplished with a pulse–echo technique similar to radar and sonar. An array transducer emits a short pulse of ultrasound with a frequency between 2 and 15 MHz. As that pulse travels through the anatomical structures of the human body, a stream of echoes produced by impedance changes is generated and returned to the transducer. Asonographic instrument processes the returning echo stream and digitally stores it as a gray-scale scan line. Subsequent pulses directed to different portions of the anatomy are imaged, and in time a two-or three-dimensional image is written into memory. Between 92 and 256 scan lines make up a 2D frame and many 2D frames can be stacked to form a 3D picture.
Sonographic instruments display gray-scale anatomical images, and frame rates are fast enough that movement can be followed in real time. In some cases, Doppler-shifted echoes caused by tissue or blood-flow movement are detected and color coded to indicate the direction of motion. For further details about color Doppler in particular and diagnostic ultrasound in general, see the article by Carr Everbach on page 44.
The imaging process relies on several assumptions:
-
▸ Echo amplitude is proportional to reflector scattering strength (echogenicity).
-
▸ The transducer emits a single, main beam of ultrasound, and echoes originate only from objects on the axis of that beam.
-
▸ Multiple reflections between objects do not occur.
-
▸ Sound travels in straight lines at a speed of 1540 m/s.
-
▸ All echoes from a given pulse are received before the next pulse emission.
-
▸ Doppler shifts do not exceed the Nyquist limit of half the pulse-repetition frequency.
If any of these assumptions is violated, the image does not correctly represent the structure or motion it intends to capture. Such errors, called imaging artifacts, fall into three main classes: attenuation, propagation, and aliasing.
A closer look at artifacts
Attenuation imposes fundamental limitations on sonography by directly limiting the penetration, or imaging depth. Because attenuation is frequency dependent, one might view the depth limit from a different perspective: Any given application requires a certain amount of penetration; thus, attenuation sets an upper bound on the frequency that can be used. That frequency bound, in turn, limits detail, contrast, and temporal resolutions—all qualities that improve with increasing frequency.
In principle, attenuation can arise either from longitudinal-mode to longitudinal-mode scattering or from absorption. But in soft tissue, absorption is dominant, so it is possible for low-echogenicity tissue to have high attenuation, or for attenuation to be low in tissue that scatters well.
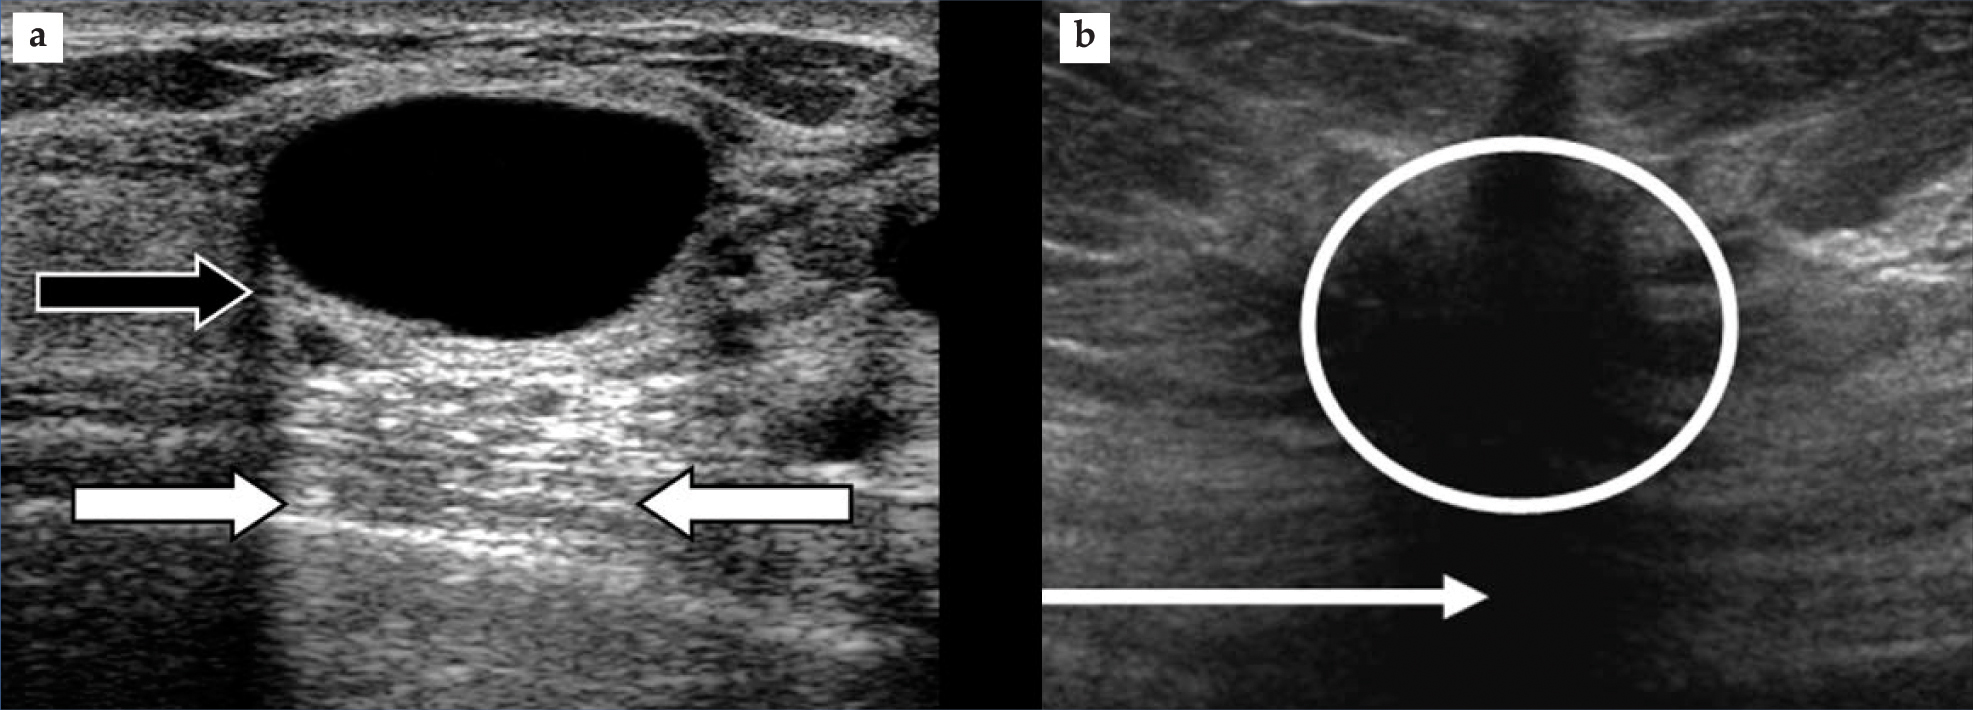
Published research suggests that the absorption occurs primarily at the molecular level. Most often, attenuation-related artifacts arise when the scattering strength and attenuation of an object are either both high or both low. The first case yields an artifactual shadowing, or echo weakening, that lies behind the object and that may be helpful in identifying high-attenuation structures such as stones, bones, and calcified abnormalities. The second case leads to echo strengthening behind the object, manifested as a brightening. That so-called enhancement helps identify cystic abnormalities; figure 1(a) furnishes an example. Less common are the cases of weak scattering, or hypoechogenicity, with shadow (but see figure

Figure 1. Attenuation artifacts. (a) Visible in this breast image are an anechoic cyst (black region) and enhancement (between white arrows). Note, as well, a shadow emanating from the edge of the cyst (black arrow). The shadow arises because refraction at the cyst’s edge causes beam spreading that reduces beam intensity and thus weakens the echoes. (b) This breast image shows a hypoechoic carcinoma (circled) and a shadow (arrow). Two characteristics help to identify the structure as a carcinoma and not a cyst. First is the ragged edges around the lesion and second is the shadow, which contrasts with the enhanced brightness seen in panel a.
(Images courtesy of Philips Ultrasound.)
Several artifacts occur if propagation assumptions are violated. For example, the off-axis beams that result from the interference pattern of the multi-element array transducer may be strong enough that structures off the main-beam axis are registered incorrectly as lying on the main axis. The result is a lateral misplacement on the sonogram. Another example: The thickness of the beam in the direction perpendicular to the scan plane defined by the beam axis and the scanning direction results in a third dimension to the scanned volume. However, all the echo information is collapsed onto a 2D image frame, and the image thus includes off-axis echoes. If the beam thickness is significantly larger than the thickness of the object to be imaged, regions that should appear echo free will not. So, for example, a cyst may appear to be solid like a carcinoma.
Reverberations—additional echoes from the object—yield artifactual images on a sonogram. If the sound speed in the tissue is faster than the assumed value, objects will appear smaller and closer than they should. If the speed is slower, objects will be lengthened and spread out. If echoes from one pulse are still returning when the next pulse is emitted, they will be placed too close to the surface; the sonographic instrument will present them as early echoes from the later pulse rather than late echoes from the earlier one.
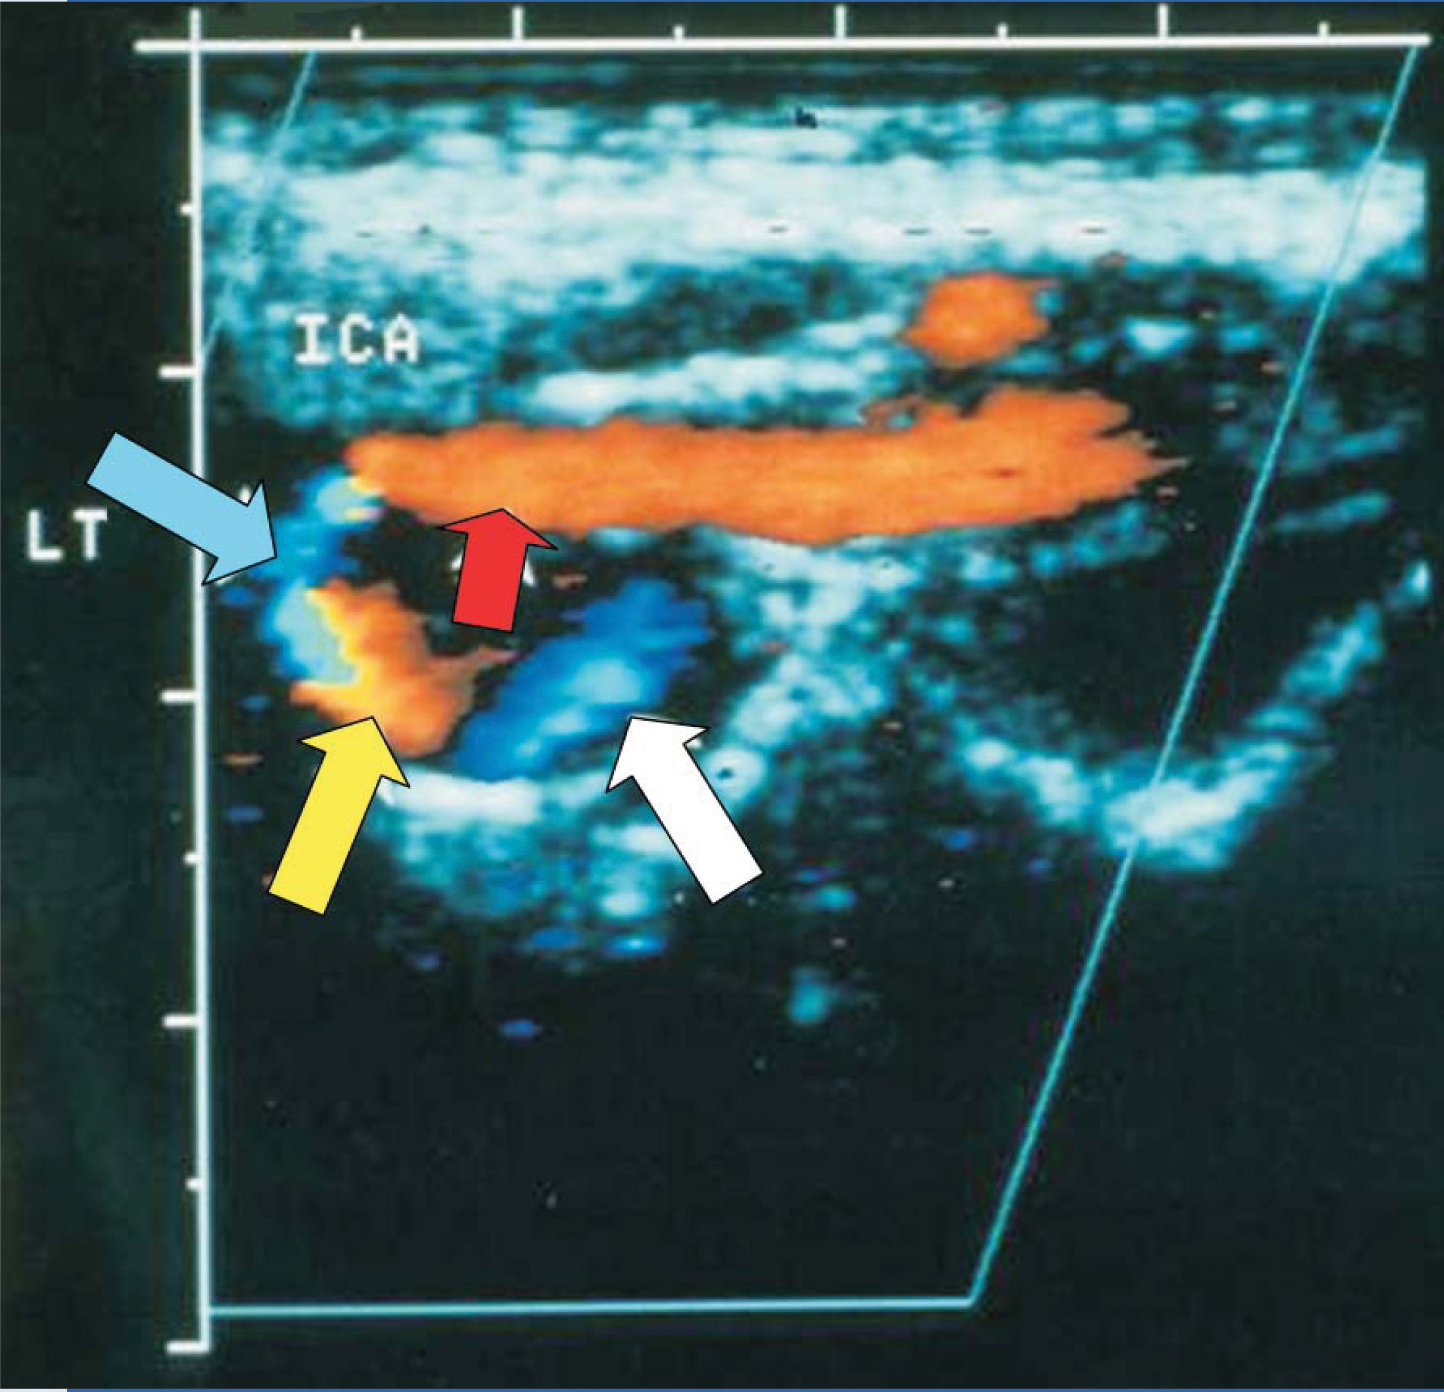
In a manner similar to police, weather, and aviation radar, Doppler ultrasound detects Doppler shifts caused by reflector motion. In color Doppler imaging, those shifts are presented in color, which allows cardiac-wall motion or blood flow to be imaged along with a gray-scale anatomical image. If the Doppler shift is too great—in technical terms, if it exceeds the Nyquist limit—instrumentation may misrepresent the direction of the shift and give a so-called aliasing artifact. Figure 2 shows an example.

Figure 2. Blood flow in a tortuous left (LT) internal carotid artery (ICA), which feeds the brain from the neck. This color Doppler image was created with ultrasound entering from the top. Orange and blue portions indicate negative and positive Doppler shifts, respectively, and the tick marks indicate 5-mm intervals. The blood flow is to the left (red arrow) and then counterclockwise (other arrows). The orange (yellow arrow) and blue (white arrow) regions show downward and upward flow, respectively; the narrow black region that separates them has a 90° Doppler angle and hence zero Doppler shift. The only problematic region is the blue one indicated by the blue arrow. It appears to be a region with positive Doppler shift and upward motion. However, that interpretation is inconsistent with the rest of the image. The explanation is aliasing. That is, because the blood flow is nearly parallel to the ultrasound beam, the Doppler angle is small and the Doppler shift exceeds the Nyquist limit. As a result, the sonographic instrument presents the region’s downward blood flow as having a positive Doppler shift.
(Image from F. Kremkau,
The many kinds of artifacts that can appear on sonograms are double-edged swords. They can, of course, lead to errors in sonogram interpretation. On the other hand, if they are properly understood, they can furnish valuable clues that help doctors better identify the objects imaged and the motions encountered in ultrasound examinations.
References
1. F. Kremkau, Diagnostic Ultrasound: Principles and Instruments, 7th ed., Elsevier Saunders, Philadelphia (2006).
2. T. Szabo, Diagnostic Ultrasound Imaging: Inside Out, Elsevier Academic Press, Burlington, MA (2004).
More about the authors
Frederick Kremkau is a professor and director of the center for medical ultrasound at the Wake Forest University School of Medicine in Winston–Salem, North Carolina.
Frederick W. Kremkau, Wake Forest University, School of Medicine, Winston–Salem, North Carolina, US .


