Follow the light: Ellipsometry and polarimetry
DOI: 10.1063/1.3141950
A nondestructive probe that works in real time, functions in any transparent medium, and responds only to films and interfaces may sound almost too good to be true, especially to those who study biological entities. Consider, in addition, a picometer sensitivity to layer thicknesses and the ability to make spectroscopic measurements, and the possibilities appear endless. Those attributes of ellipsometry and polarimetry are well known in integrated-circuits technology, where they have been used for years to determine thicknesses and other properties of films. In fact, without them, the performance, information-storage, and data-processing capabilities of computers would be no better than they were about 15 years ago.
Two polarizations are better than one
As with glare-removing, polarized sunglasses, ellipsometry and polarimetry work because the reflection of obliquely incident light depends on the light’s polarization state. Polarization is a property of any transverse wave. In the context of light, polarization refers to the trajectory traced at a given point in space by the tip of the electric-field vector of the propagating light wave. For linear polarization, the trajectory is a straight line, and the field simply increases and decreases with time. For circular polarization, the trajectory is a circle. More generally, the trajectory is elliptical, and one speaks of right- or left-handed polarization depending on the sense of the path.
In particular, “transverse-magnetic” waves, polarized parallel (p) to the plane of incidence, undergo different phase and amplitude changes on reflection from those of “transverse-electric” waves, whose polarization is perpendicular (s) to the incidence plane. Just how TM and TE waves reflect depends in detail on the properties of the reflector. The reflections themselves are described mathematically by the complex-valued reflectances r p and r s, defined as the ratios of emerging to incident complex electric fields. With an ellip-someter such as that shown in figure 1, one determines the quotient ρ ≡r p/r s; with a polarimeter one also determines the power reflectances

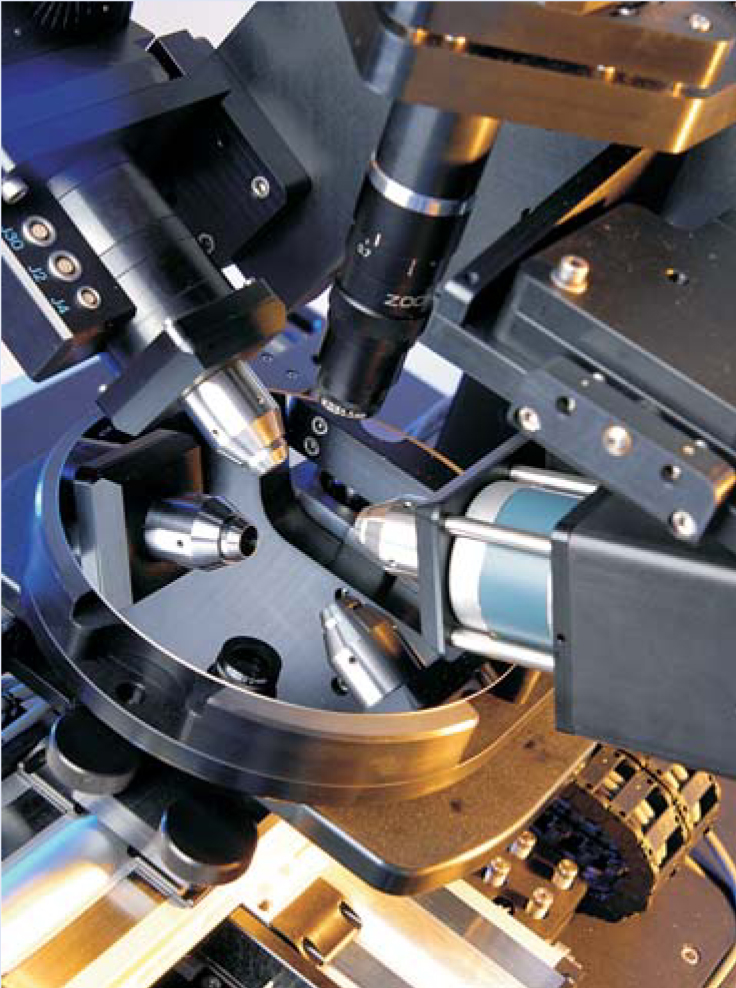
Figure 1. Ellipsometers analyze the reflections of polarized light to determine various material properties. In this photograph, the left arm provides the incoming beam and the right one collects the outgoing light. Both are reflected in the eight-inch-diameter silicon wafer whose properties are being measured. The components described in the text are hidden in the arms.
(Courtesy of J. A. Woollam Co Inc.)
For ellipsometers that operate in the visible to near-UV spectral range, it is easy to measure ρ with a combination of off-the-shelf components: polarizers, which pass only the field component along the polarization axis, and compensators—waveplates or retarders that introduce a phase delay between orthogonal field components. A common configuration includes a polarizer, a rotating compensator, a sample, and a second polarizer termed the analyzer. The rotating compensator, which can be placed either before or after the sample, modulates the polarization state of light reaching the analyzer. The intensity of the light leaving the analyzer is thus also modulated and is decoded to give ρ. In polarimetry, the average intensity is also used to determine R p and R s.
Ellipsometry is now a mature and varied technique, applicable over a wide wavelength range. Data analysis continues to evolve, and these days practitioners can deal with samples that are multilayered, anisotropic, graded, inhomogeneous, and so forth. Physicists have developed numerous dispersion models for extracting such fundamental material properties as bandgaps, band-structure critical points, phonon spectra, mobile-charge properties, and molecular-vibration signatures. The last entry in the further readings list gives some idea of the current scope of applications.
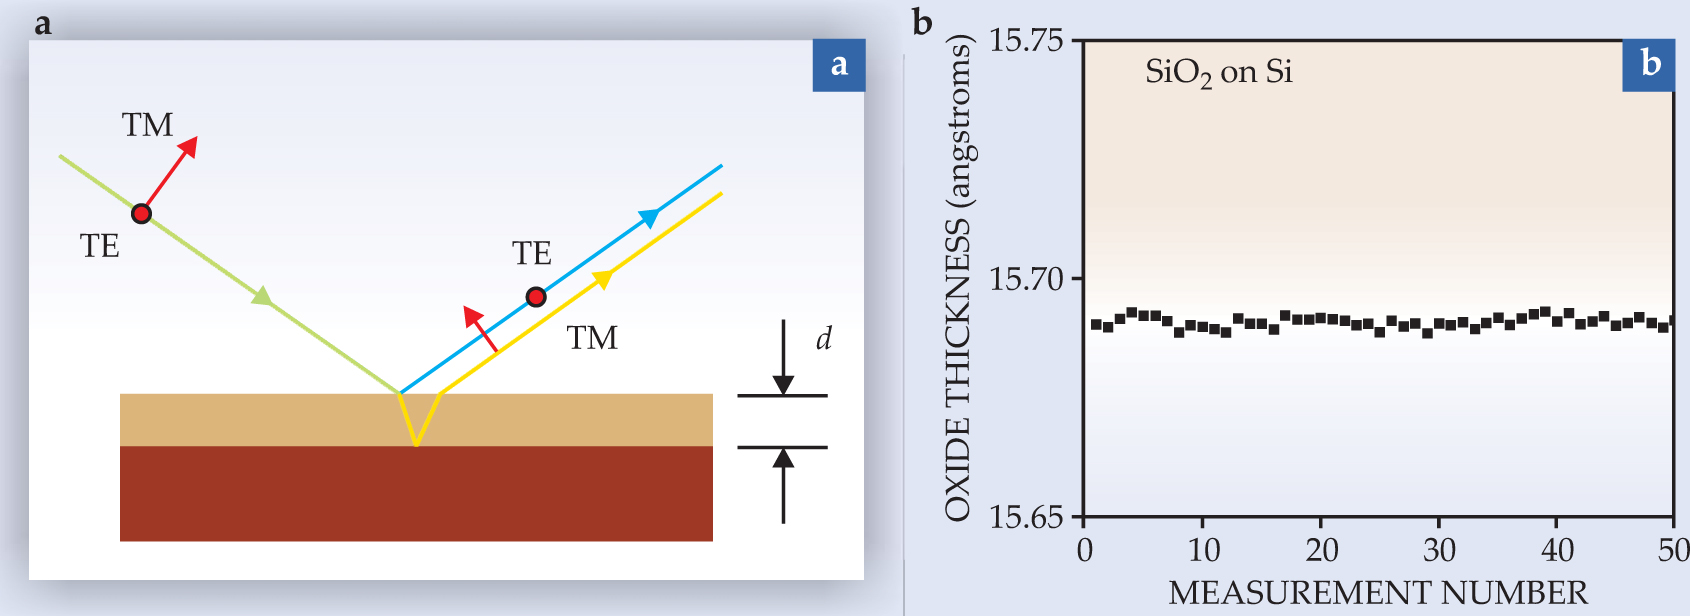
Film-thickness measurement represents an application that can be understood in simple terms. Such measurements are of industrial interest because, for example, the insulating gates in field-effect transistors are only a few atoms thick. Figure 2(a) shows a plane wave incident on a sample that has a transparent layer on top of it. Light strikes the topmost surface at the so-called Brewster angle. For this special circumstance, the TM component passes through the transparent surface without reflection. However, at least part of the TE component is reflected from the surface. The result is a phase difference between the TM and TE components essentially given by (4πndcosθ)/λ, where n is the refractive index of the film, d is the film’s thickness, and θ is the angle of refraction in the layer. That phase difference can be measured to parts-per-million accuracy. Thus one can achieve picometer-scale sensitivity by using micron-scale wavelengths. Figure

Figure 2. Ellipsometric thin film measurement. (a) Light polarized in each of two orthogonal directions (indicated in red) impinges on a thin film at the Brewster angle. For this special incidence, light polarized parallel to the plane of incidence (transverse magnetic) is not reflected from the surface, but light polarized orthogonal to the plane (transverse electric) is. The phase difference between the TM light reflected from the interface and the TE light reflected from the surface is easily measured and yields nd, the product of the index of refraction and the film thickness. (b) Repeated measurements of the thickness of a silicon dioxide (SiO2) film show the sensitivity that can be consistently achieved.
(Data courtesy of Jon Opsal.)
As shown by the thin-film example, ellipsometry achieves its high degree of accuracy thanks to an intrinsic phase and amplitude reference. The TE component serves as a reference for the TM component (or vice versa). The discussion also illustrates the typical challenge of interpreting optical data: What is measured is not the metric thickness d but rather the optical thickness nd. Just how difficult it is to separate n and d depends on the abruptness of the transition between layers and the quality of the instrument. In some applications the extinction coefficient k, a measure of how much light is absorbed, further complicates matters. Fortunately, in the thin-film limit, polarimetric measurements can independently yield all three individual parameters.
Knowledge of n and k as a function of λ allows one to identify different materials and is an essential ingredient in the more sophisticated applications previously mentioned. Spectroscopy opens the door to nanostructural analysis by so-called effective-medium theory, a field that goes back to J. C. Maxwell Garnett’s work from 1904. With state-of-the-art generalized ellipsometry, materials as complex as liquid crystals can be analyzed in detail.
To life!
Even in a short piece such as this Quick Study, we can give a flavor of how ellipsometry is used. We focus on bioabsorption, one of three principal applications in the life sciences; the other two are biosensing and structure characterization. Three features make ellipsometry attractive. First, as noted previously, its thickness precision is well below 1 nm. That makes it ideal for studying biolayers, which may be composed exclusively with nanometer-sized molecules. Second, it can be used in any transparent medium, so it can readily be applied to solid–liquid interfaces. Many bioreactions take place at such interfaces, and water is the natural environment for most biomolecules. Third, ellipsometry does not require that molecules be labeled, as is necessary for techniques based on fluorescence or radioactivity.
To study biomolecular adsorption one can, for example, immerse a surface in a liquid and monitor the dynamics of bioadsorption at the solid–liquid interface as molecules are added to the solution. The data provided by ellipsometry allow for calculation of the surface mass density; thus one can study interactions between molecules and interfaces and also interactions between molecules and previously adsorbed biolayers. Not only that, one can track desorption phenomena, swelling, molecular conformation changes, and the influences of ionic strength, acidity, and other solution properties. Biomaterials, immunoreactions, and blood coagulation are among the fields that would benefit from the types of studies described in this paragraph.
Synergy with computers
We have already noted the important role that ellipsometry and polarimetry have played in the impressive performance of today’s computers. But ellipsometry and polarimetry in their current form are as much a product of computers as computers are of the two techniques. The concepts underlying ellipsometry and polarimetry are straightforward and have been known since the time of Paul Drude in the late 1800s. Early measurements, however, used ellipsometers that were tedious to operate and required intense atomic-line sources. Ellipsometry and polarimetry in their current forms were developed in the late 1960s and early 1970s; the key to that development was the availability of small, relatively cheap minicomputers that could acquire and reduce digital data. The resulting photometric designs, which needed only relatively weak continuum sources, enabled scientists and engineers to take spectroscopic measurements and benefit from today’s wide range of applications.
References
1. H. Arwin, in Handbook of Ellipsometry, H. G. Tompkins, E. A. Irene, eds., William Andrew, Norwich, NY (2005), p. 799.https://doi.org/10.1016/B978-081551499-2.50014-9
2. H. Fujiwara, Spectroscopic Ellipsometry: Principles and Applications, Wiley, Hoboken, NJ (2007).
3. Special issues, “Proceedings of the 4th International Conference on Spectroscopic Ellipsometry (ICSE4),” Phys. Status Solidi A 205 (April 2008);
Phys. Status Solidi C 5 (May 2008).
More about the authors
Hans Arwin is a professor of applied optics at Linköping University in Linköping, Sweden. Dave Aspnes is a Distinguished University Professor of physics at North Carolina State University in Raleigh.
Hans Arwin, 1 Linköping University, Linköping, Sweden .
David E. Aspnes, 2 North Carolina State University, Raleigh, US .


