Champagne acoustics
DOI: 10.1063/PT.3.4005


Popular lore has it that the quality of a sparkling wine can be determined by the characteristics of its bubbles. As the saying goes, “The smaller the bubbles, the better the wine.” Regardless of whether that statement is true, it seems uncontroversial to say that the enjoyment of sparkling wine is closely connected to the presence of its bubbles, and certainly the physics and chemistry of bubble formation in sparkling wines have been studied for at least the past two decades. In this Quick Study, we describe some work we did to find out if passive acoustic monitoring—listening to the sounds that the bubbles make as they form and rise in the wine—can be used to extract quantitative information about the bubbles. Passive acoustic monitoring has been applied to other systems involving bubbles—for example, to detect underwater leaks from gas pipes and methane hydrate deposits at the seafloor or to analyze the sizzling sounds, indicative of ice melt, made by trapped bubbles escaping from pockets in submarine glacier ice.
Floating oscillators
Acoustically speaking, a bubble is a resonant object; it rings at a particular frequency that depends on the size of the bubble and material properties of the liquid and gas. The first study to quantify the natural frequency of an oscillating bubble was published in 1933 by Marcel Minnaert, who was interested in the sounds made by running water. He started by assuming that the kinetic energy of the bubble is due entirely to the motion of the surrounding liquid, which is much heavier than the entrained gas, and that the potential energy is due to the compression and expansion of the entrained gas, which is much more compressible than the surrounding liquid. Minnaert then derived an expression for the small radial oscillations of a bubble and recognized that it was equivalent to the expression for a simple harmonic oscillator. The natural frequency of the bubble, he found, is inversely proportional to the bubble diameter.
The characteristics of sparkling-wine bubbles depend not only on the properties of the wine itself, but also on the vessel into which the wine is poured and the temperature at which it is served. We wanted to measure bubbles in a typical setting, so we performed our measurements on chilled sparkling wine in a standard champagne flute. A possibility that we did not explore was to use the purposefully etched champagne flutes produced by some manufacturers to encourage bubble formation. Experiments were conducted immediately after the wine was uncorked and poured into the flute. For our first round of experiments, we studied bubbles from a bottle of Cook’s California Sparkling Wine and from a bottle of the more expensive Moët & Chandon Impérial Champagne.
Clearly fizzier
To record the sounds made by the bubbles, we inserted a hydrophone (underwater microphone) directly into the wine near the center-bottom of the champagne flute, as shown in figure
Figure 1.

A ringing bubble. A hydrophone (a) placed into a flute of sparkling wine records the sound a bubble makes as it breaks free of the glass and rises. (b) The audio signal is a short tone burst at the natural frequency of the bubble, which is inversely proportional to the bubble diameter.
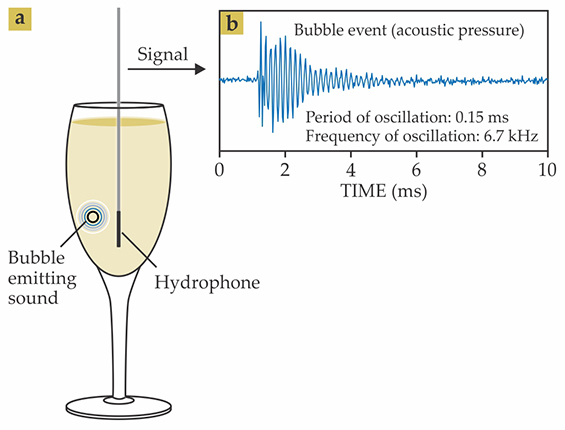
The audio recordings that we took were in the audible frequency range, from 20 Hz to 20 000 Hz. When listened to directly, they sound like sizzling or crackling noises: Not much information about the bubbles can be discerned with the naked ear. However, when we looked closer at the recorded acoustic pressure waveform, we observed that the sizzling sound is made up of short tone bursts lasting only a few cycles each. Figure
Once we determined that the recorded signals consisted of discrete bubble events, the next step was to run the signal through a bank of narrowband bandpass filters and track the energy as a function of time in each band. In that manner we could quantify the overall rate at which events were occurring and determine the frequency distribution (and thus size distribution) of events. First, though, we had to set a minimum energy threshold for a bubble event. A threshold that is too high would yield no events, whereas one that is too low would give results that look like noise. So we fine-tuned the threshold by hand to arrive at a good level.
Figure
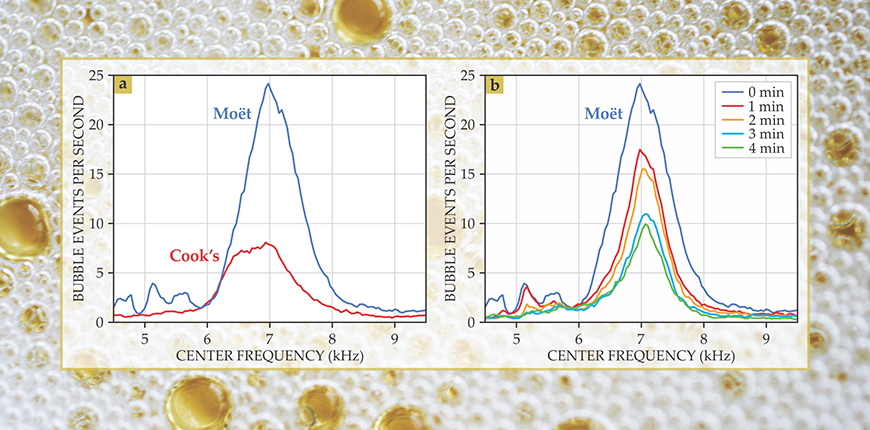
Figure 2.

Make me feel fine. Acoustic data reveal how many bubbles of a given frequency ring per second in a glass of champagne. The data shown here were taken in one-minute intervals and grouped into 174-Hz-wide bins whose central values are indicated on the horizontal axis. (a) As these data from the first minute after pouring show, Cook’s sparkling wine (red) has fewer bubbles than Moët champagne (blue), and Cook’s bubbles tend to be at a slightly lower frequency, hence a larger diameter. (b) Effervescence doesn’t last forever. With increasing time from the initial pouring (colored curves), the rate of bubble formation in Moët champagne decreases. (Background photograph by Quinn Dombrowski; CC BY-SA 2.0 .)
Our preliminary results validate the idea that passive acoustic monitoring can be used to obtain quantitative information about the bubbles in sparkling wine. The analysis that we performed can be refined by using a more sophisticated model for the bubble resonance. For example, we could correct for the finite size of the champagne flute and the fact that the bubbles interact with one another when they oscillate. In addition, we could take into account such physical effects as the viscosity of the surrounding liquid, damping due to acoustic radiation, and thermal conductivity between gas and liquid. Characterizing the damping of individual bubble oscillations in terms of the viscosity and thermal properties of the surrounding liquid could give insight into the chemical properties of the wine itself. With a more sophisticated analysis framework, acoustic monitoring could become a tool used for quality assurance during the production of sparkling wines and other carbonated beverages. Even now, it could be used to gather quantitative data on the bubbles of various sparkling wines to test the popular notion that smaller bubbles mean better wine.
We gratefully acknowledge Jonathan S. Abel of the Center for Computer Research in Music and Acoustics at Stanford University for suggesting the line of research presented here and for many useful discussions.
References
► T. G. Leighton, The Acoustic Bubble, Academic Press (1994).
► T. G. Leighton, P. R. White, “Quantification of undersea gas leaks from carbon capture and storage facilities, from pipelines and from methane seeps, by their acoustic emissions,” Proc. R. Soc. A 468, 485 (2012). https://doi.org/10.1098/rspa.2011.0221
► G. Liger-Belair, Uncorked: The Science of Champagne, Princeton U. Press (2013).
► M. Minnaert, “On musical air-bubbles and the sounds of running water,” Philos. Mag. 16, 235 (1933). https://doi.org/10.1080/14786443309462277
► E. C. Pettit et al., “Unusually loud ambient noise in tidewater glacier fjords: A signal of ice melt,” Geophys. Res. Lett. 42, 2309 (2015). https://doi.org/10.1002/2014GL062950
More about the authors
Kyle Spratt and Kevin Lee are research associates at the Applied Research Laboratories of the University of Texas at Austin, where Preston Wilson is a professor of mechanical engineering.


