Solving the century-old mystery of background Love waves
DOI: 10.1063/PT.3.4651

Earthquakes generate only a small fraction of the seismic energy that travels through Earth and on its surface. Most seismic activity arises from wind-driven ocean waves interacting with the solid ground. The background vibrations carry useful information about the exchange of energy between the ocean, the atmosphere, and Earth’s subsurface, and seismologists extract that information to image the planet’s internal structure and to conduct other geophysical investigations.
The strongest of those vibrations are known as secondary microseisms and are produced by pressure sources at the ocean surface that don’t attenuate with the depth of water. Such fields arise when ocean waves interact nonlinearly with each other. 1 Most of the secondary microseisms, known as Rayleigh waves, oscillate in an up–down direction as they propagate across a surface. But some of the seismic energy takes the form of Love waves, which oscillate side to side.

Ocean waves interacting with each other produce a second-order pressure variation that doesn’t attenuate with ocean depth. The waves exert vertical forces on the seafloor that generate seismic activity in the form of Rayleigh waves, which oscillate in a direction orthogonal to their propagation. But that theory cannot explain the observation in the ambient seismograph record of Love waves, which exhibit shear motion. (Image by Hansueli Krapf, CC BY-SA 3.0 .)

Despite about a century of observations, the origin of those Love waves has puzzled seismologists. Some ocean waves, driven initially by atmospheric winds associated with hurricanes and other storms, form pressure sources that generate compressional waves. They propagate to the seafloor and can travel through Earth’s interior. If the compressional waves interfere with each other, the interaction produces secondary- microseism Rayleigh waves but not Love waves.
For several decades, seismologists have pondered two hypotheses to explain the origin of the Love waves. One proposes that the ocean bathymetry—the inclined surfaces of seafloor ridges—splits the pressure sources into vertical and horizontal components, which can generate Rayleigh and Love waves, respectively. 2 The other hypothesis contends that the three-dimensional variations in seismic-wave velocities inside Earth scatter the seismic wave field in ways that generate Love waves. 3 But to date, the computational cost of 3D simulations has prevented researchers from comprehensively studying secondary-microseism Love waves.
Now Lucia Gualtieri of Stanford University and her colleagues at Princeton University have uncovered the waves’ elusive source. 4 Using high-frequency numerical simulations, the researchers show that secondary-microseism Love waves form when seismic energy traveling through Earth’s subsurface scatters haphazardly because of 3D heterogeneities in temperature, density, and rock and mineral composition. Besides answering a decades-old question, the finding may spur new tomographic methods and help improve existing ones.
From 30 years to 8 hours
When researchers first started modeling seismic activity with computers in the 1970s, simulated waves were coarse approximations of the real thing. Those early models used a simple Cartesian coordinate system because of the limited computational capabilities available at the time, and the lowest period of a wave field that could be simulated was about 20 seconds. Secondary microseisms, however, have periods of 4 to 10 seconds.
To accurately capture the behavior of Love waves, Gualtieri and her colleagues used an Earth model with better frequency resolution. It has a geocentric coordinate system that incorporates various planetary parameters, including ellipticity, rotation, and the Coriolis effect. 5 The algorithm, a 3D spectral element solver, numerically calculates solutions to the differential equations that describe propagating waves as a sum of basis functions. Researchers first adapted the method for seismology studies in 1994, and since then the open-source code called SPECFEM3D Globe has been reviewed, revised, and validated by dozens of experts.
Still, using the venerable code to model secondary microseisms for the entire planet strains computational resources. The ambient-noise pressure sources of the waves are located across Earth’s surface. A simulation of a portion of those places couldn’t provide the insight that came from modeling all of Earth. The quantity of spatial cells the model used to resolve the Love waves numbered about 230 000.
When Gualtieri first tested the code at Princeton, the local computer cluster could handle just one-sixth of Earth at a time. The supercomputer at Oak Ridge National Laboratory in Tennessee, however, made the full simulation possible. “When I was in grad school in 2011, people were saying this would take 30 years,” says Gualtieri. “But my simulation took about 8 hours.”
Dimensions matter
Once the model was running smoothly, the researchers tuned it with and without bathymetry and 3D heterogeneities, the features that were hypothesized to generate secondary-microseism Love waves. The top panel of the

A state-of-the-art Earth model simulated secondary-microseism Love waves, the shear motion that arises when ocean waves interact nonlinearly with each other. The ocean color indicates the intensity of the pressure sources. The direction and strength of Love waves are indicated by the polar histograms at various detecting stations (black triangles). The top-panel simulation assumes a simple, layered Earth structure and shows only a few Love waves (pink bars) arriving at a handful of stations in Europe. The bottom panel shows results from a simulation that includes three-dimensional variations in seismic-wave velocity produced by a heterogeneous Earth structure. That distribution and number of Love waves better match observations. (Adapted from ref.
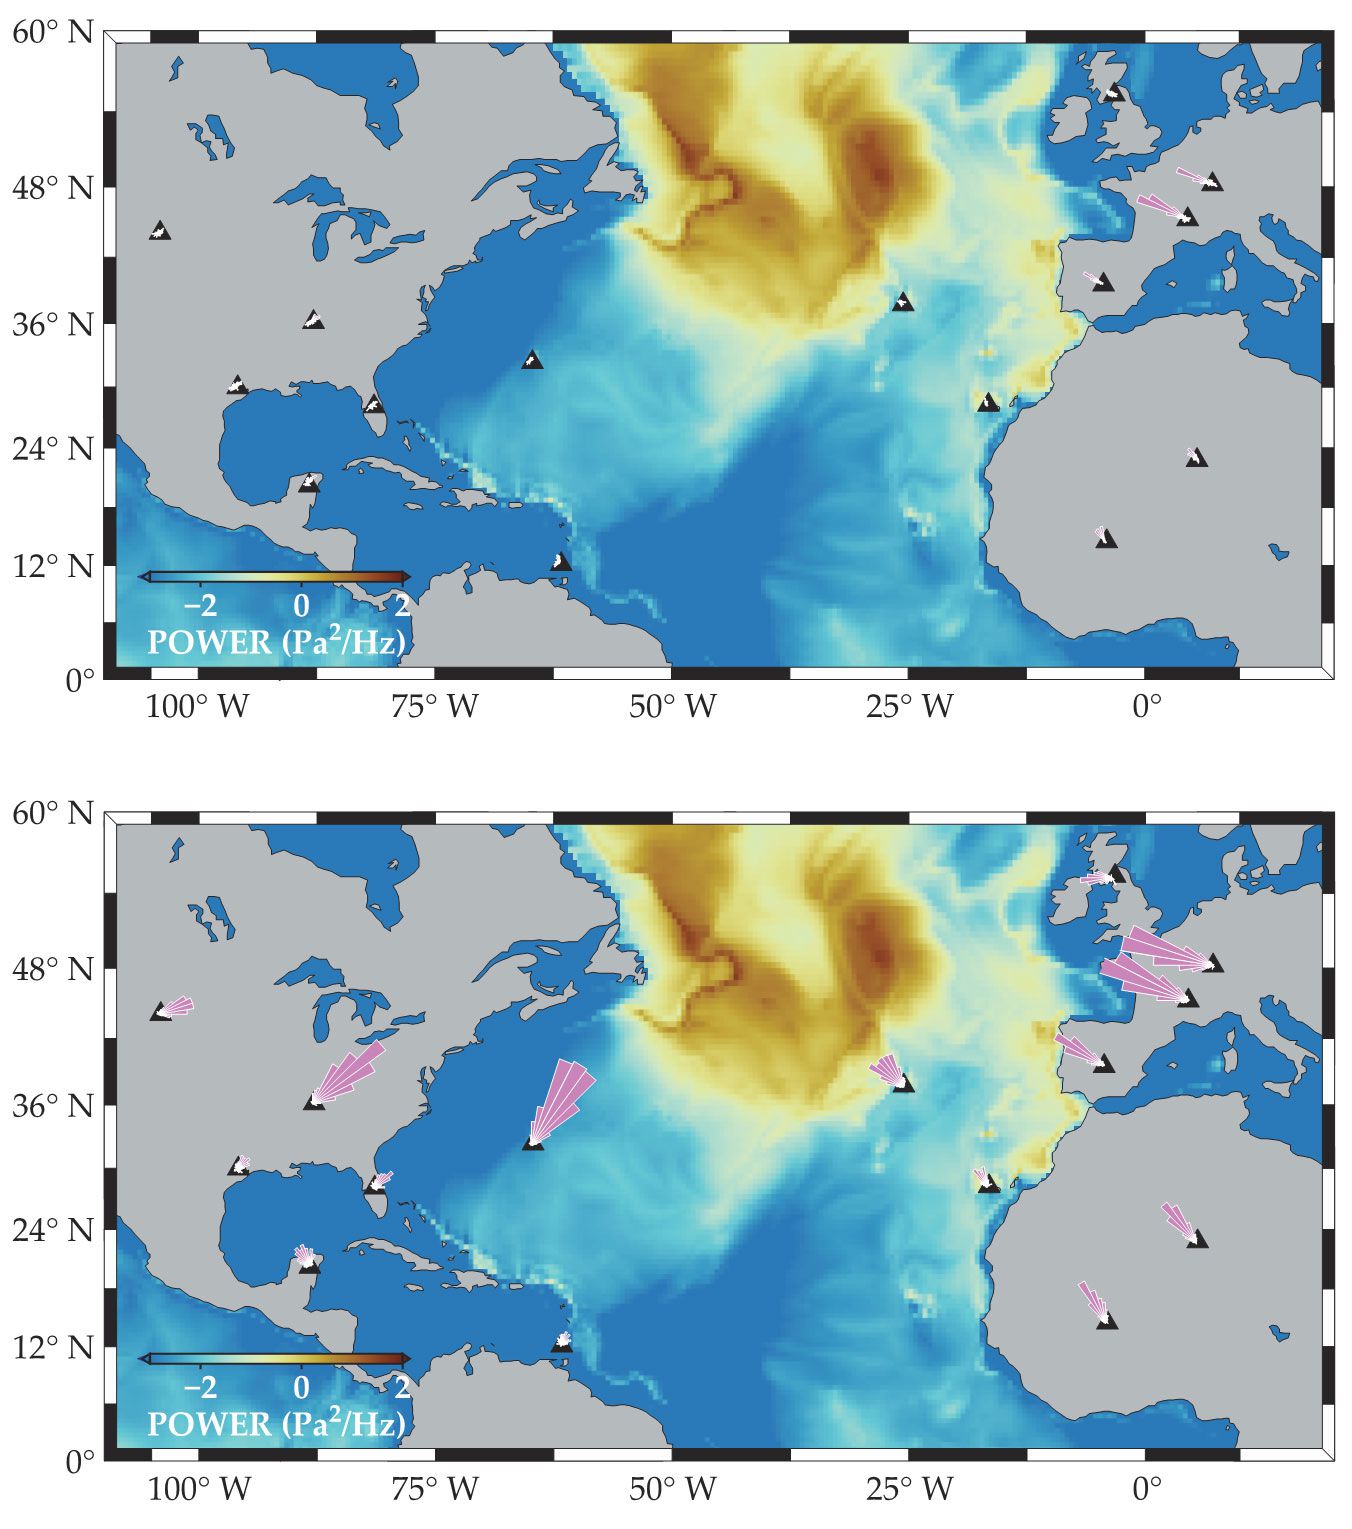
The roughness of the seafloor did generate some Love waves, but Gualtieri and her colleagues found that at most locations, with the exception of a few areas, the bathymetry was not steep enough to significantly split the pressure sources. However, the simulation that includes the 3D heterogeneous structure, in the bottom panel of the
Andrea Morelli, a professor of physics at the University of Bologna in Italy, says, “The results are enlightening. The discussion about the generation of Love waves by oceanic sources will not end here, of course, and further analyses will be needed to confirm this mechanism and improve the detail.” Based on a wave’s period, researchers could more precisely calculate the depth of a heterogeneity. The deeper structure of the mantle may also affect the reshaping of the entire ambient wave field, though researchers still need to explore that possibility further.
Refined tomography
The new findings may improve future efforts to image the subsurface. The classic approach to seismic tomography relies on data from earthquakes and their sources to reconstruct an image of the planet’s interior. A different and more data-rich approach uses ambient seismic noise, but its sources are murky. So seismologists have relied on cross-correlation methods, which produce an image by assuming a homogeneous distribution of the sources to get information about the seismic-wave velocity variations between pairs of stations. (See the article by Roel Snieder and Kees Wapenaar, Physics Today, September 2010, page 44 .)
Love waves are recorded in the horizontal component of seismic activity. But previous imaging studies either did not use the horizontal components or assumed that they originated at the surface. “Our work could be a way of starting to do tomography with ambient noise in a classical way, using the information about the sources,” says Gualtieri.
Without information about the ambient pressure sources, researchers have had to assume that they’re uniformly distributed around Earth. But the
References
1. M. S. Longuet-Higgins, Philos. Trans. R. Soc. London A 243, 1 (1950). https://doi.org/10.1098/rsta.1950.0012
2. T. Saito, Geophys. J. Int. 182, 1515 (2010). https://doi.org/10.1111/j.1365-246X.2010.04695.x
3. T. Tanimoto et al., Geophys. Res. Lett. 42, 2650 (2015). https://doi.org/10.1002/2015GL063637
4. L. Gualtieri et al., Proc. Natl. Acad. Sci. USA 117, 29504 (2020). https://doi.org/10.1073/pnas.2013806117
5. D. Komatitsch, J. Tromp, Geophys. J. Int. 149, 390 (2002); https://doi.org/10.1046/j.1365-246X.2002.01653.x
D. Komatitsch, J. Tromp, Geophys. J. Int. 150, 303 (2002). https://doi.org/10.1046/j.1365-246X.2002.01716.x
More about the authors
Alex Lopatka, alopatka@aip.org


