Magnetic waves pervade the Sun’s corona
DOI: 10.1063/1.3141930
Somehow, vast amounts of energy leave the Sun’s 6000-K photosphere, rise about 10 thousand kilometers, and heat the corona to 1 million kelvin. Despite the prodigious scales, no one knows exactly how the energy overcomes the thermal gradient to reach the corona or how the energy ultimately thermalizes.
Magnetic fields dominate the energy density of the corona and surely play a leading role in heating it, as figure 1 suggests. But to the continuing frustration of solar physicists, the heating mechanism evidently operates on scales too fine and fast to catch in the act.

Figure 1. Loops of magnetic field sprout from the Sun’s photosphere and reach into the corona. This UV image, taken by NASA’s TRACE spacecraft, reveals the hot plasma entrained by the loops but not the magnetic waves that might transport plasma or the nanoflares that might heat it.
M. ASCHWANDEN ET AL, LMSAL, TRACE, NASA

In a forthcoming paper, Steven Tomczyk and Scott McIntosh of the National Center for Atmospheric Research in Boulder, Colorado, report a search for one of the contending mechanisms: the magnetohydrodyamic disturbances known as Alfvén waves. 1 The waves show up throughout the NCAR study, but whether they contain enough energy to heat the corona remains unclear. A rival and even more elusive contender—nanoflares—retains the leading position.
Even if Alfvén waves aren’t the long-sought heat source, they clearly constitute a major component of coronal dynamics. And now that their properties can be observed and characterized, they could serve as a diagnostic that helps to identify the true mechanism.
Resolving Alfvén waves
Hannes Alfvén first identified the plasma waves that bear his name in 1942. Magnetic fields provide the restoring force; ions provide the inertia. As Alfvén himself realized, the waves seem an ideal mechanism for heating the corona. They propagate along magnetic field lines at thousands of kilometers per second. Density or thermal gradients don’t deflect them. Once launched from the photosphere, an Alfvén wave will zoom along its magnetic field all the way into the corona.
Because Alfvén waves are oscillations in velocity, not density, they remain almost invisible in emission maps. The lack of a photometric signature, compounded with the waves’ high speed, modest amplitudes, and short, few-hundred-second periods, makes detecting Alfvén waves technically challenging. To have any hope of seeing them, one needs to resolve plasma velocities with sub-arcsecond, few-second precision.
To determine the velocities of receding galaxies, orbiting stars, exploding supernovae, and other moving objects, astronomers exploit the Doppler shift of spectral lines. For their Doppler study, Tomczyk and McIntosh used a spectrometer that Tomczyk built, the Coronal Multi-channel Polarimeter (CoMP). They made their observations at the Sacramento Peak Observatory in Sunspot, New Mexico.
CoMP is designed to operate behind a coronagraph, a device that blocks out the bright solar disk to reveal the fainter, transparent plasma above the Sun’s halo. Coronagraphs allow the corona’s full projected height to be observed, but at the expense of omitting the major portion of the corona above the disk.
Inside CoMP is a combination of lenses, polarimeters, narrow-band filters, and an active-matrix detector. The spectrometer can map the spatial distribution, temporal evolution, and Doppler shift of IR lines. The blue area on this issue’s cover shows a polarization intensity map in one of the two lines that Tomczyk and McIntosh observed, iron XIII (Fe+12), which forms at 1.5 million kelvin.
Thanks to an effect identified in 1908 by George Ellery Hale, CoMP can also derive magnetic field information. In the presence of a magnetic field, the red and blue wings of an emission line acquire different circular polarizations. Whether the red wing has right CP and the blue wing has left CP (or vice versa) depends on the orientation of the field; the degree of polarization depends on the projected strength of the field along the line of sight.
At the wavelengths Tomczyk and McIntosh observed—and indeed in most wavelengths—the Sun’s corona is optically thin. Photons that reach CoMP’s active-matrix detector could therefore come from anywhere along the line of sight. CoMP can’t overcome all the limitations of projected images, but, with certain assumptions and analysis techniques, it is possible to extract two-dimensional maps of the magnetic field direction and the plasma’s spatial and temporal coherence.
In essence, Tomczyk and McIntosh’s analysis entails looking pixel by pixel, time bin by time bin, for regions of continuous coherence. If two waves happen to lie along a particular line of sight, their projected velocities can cancel each other. CoMP’s Doppler maps, therefore, represent a lower limit to the power present in coronal waves.
Figure 2 shows a map in Fourier space of the spatial and temporal coherence, a so-called k–ω diagram, derived from 100 minutes’ worth of data gathered from the portion of the corona shown on the cover. Seismologists plot such diagrams to characterize the propagation and power of earthquakes. The CoMP k–ω diagram is the first of the Sun’s corona.

Figure 2. The spatial and temporal coherence of coronal emission is characterized by plotting spatial frequency against temporal frequency in a k–ω diagram. The ridges indicate coherent structures. In particular, the oblique ridges have the properties expected of Alfvén waves.
(Adapted from
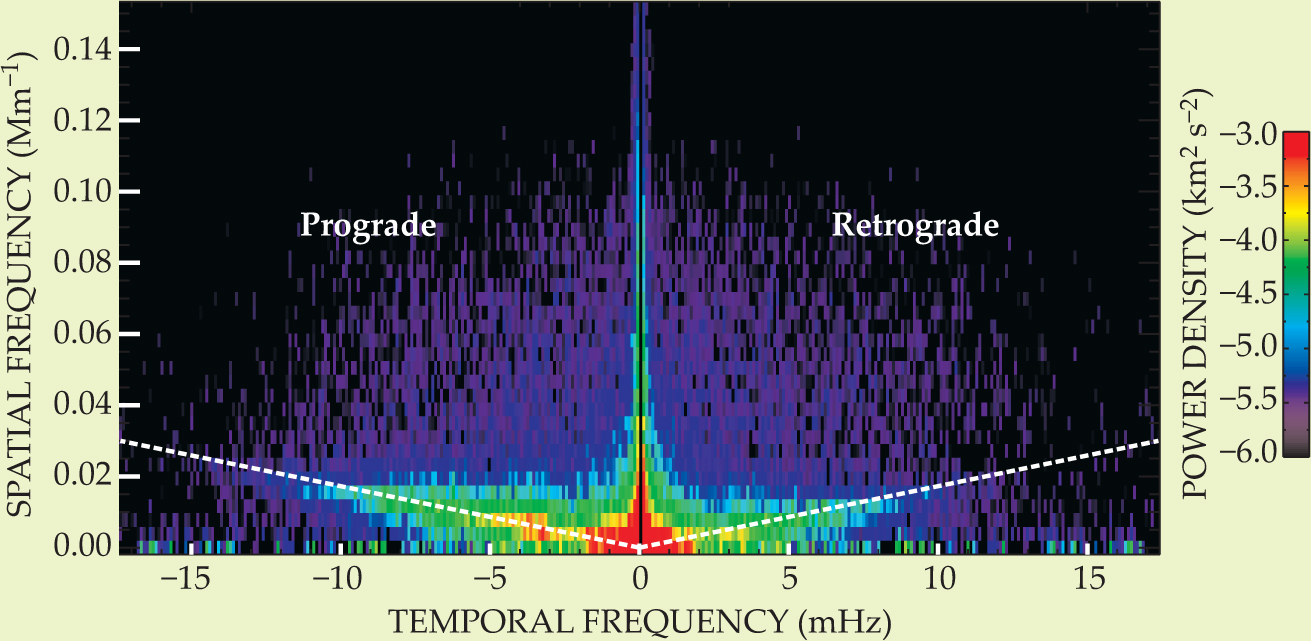
If power were spread evenly in space and time, the map would be one color. That’s not the case. Two prominent features are visible: a narrow, vertical ridge centered at zero frequency and two oblique, slightly broader ridges.
The oblique ridges are consistent in their properties with Alfvén waves propagating upward (left) and downward (right) at a speed of 650 km s-1. Moreover, as figure 3 shows, the magnetic field derived from the circular polarization and velocities derived from the Doppler shifts are aligned, just as they should be for Alfvén waves.

Figure 3. The magnetic field and plasma velocity in the corona appear to be aligned, as shown by the red 45° diagonal that runs through data gathered by the CoMP spectrometer. The largely uncorrelated region in the lower right of the plot arises from an ambiguity identified by James Van Vleck.
(Adapted from

The prominence of the oblique ridges underlines another key finding: the waves pervade the corona. Two years ago Bart De Pontieu and his collaborators, using data from Japan’s Hinode spacecraft, found that Alfvén waves pervade the chromosphere too. 2 Can those ubiquitous waves heat the corona?
Tomczyk and McIntosh calculated the energy flux in the Alfvén waves they observed. They found a value of 0.01–0.10 W m-2, which falls short by at least four orders of magnitude. Correcting for projection can’t close such a wide gap, but it’s conceivable that most of the wave power is carried by structures that are too small for CoMP to see. The case against Alfvénic heating remains unproven.
Dissipation and nanoflares
Even if Alfvén waves were found unambiguously to have the power to heat the corona, a challenge remains: How does their energy end up as heat? Sharp gradients in plasma density or magnetic field curvature could thermalize the energy by launching dissipative waves or by causing waves to interfere turbulently.
Whether either dissipation mechanism occurs is hard to say, but the CoMP data contain a clue. As figure 2 shows, Tomczyk and Mcintosh could identify whether waves travel out from the photosphere (prograde) or back down toward it (retrograde). The retrograde signal is one-third to one-half as strong as the prograde signal. Dissipation that occurred before the waves made their return trip could account for the deficit.
Nanoflares remain the leading candidate for heating the corona, even though no one has definitively observed them. They are thought to originate in the myriad thin flux tubes that together make up the thick coronal loops in figure 1. Stirring the photosphere’s velocity field causes the roots of the loops and tubes alike to jostle violently and randomly, twisting the magnetic field lines. Eventually, when the twist becomes too great, the loops and tubes snap into a new configuration of lower curvature and energy.
At its most extreme, such reconnection hurls vast amounts of plasma back onto the Sun or out into space, knocking out satellites and power grids. When thin tubes reconnect, the result is a nanoflare, which impulsively heats the local plasma. Instabilities can also yield nanoflares. A constant, ubiquitous barrage of reconnection or instabilities could in principle heat the corona.
Unfortunately, evidence for nanoflares is even harder to obtain than it was for Alfvén waves. Not only are the events small in scale, they are also fleeting. At the temperatures and densities that prevail in the corona, thermal conduction is extremely efficient. When an individual nanoflare pops off, the local plasma temperature shoots up to 1 MK, then drops rapidly. Meanwhile, the density, and with it the observable intensity, also drops as the plasma sinks rapidly. Trying to see an individual nanoflare is like trying to hear an individual cicada.
The best prospect for observing nanoflares lies in the x-ray band, where the hot corona emits most of its photons. Space-based instruments can deploy filters as fine as CoMP’s and can observe with the spatial and temporal resolution needed. The challenge used to be squeezing copious data into limited telemetry. Now, it’s a matter of getting the right instrument into space.
If the nanoflare hypothesis is vindicated, Alfvén waves will remain important. Observing them provides crucial information about the strength and evolution of the coronal magnetic field. And regardless of what heating mechanisms they favor, solar physicists all want to observe the Sun with higher spectral, temporal, and spatial resolution.
References
1. S. Tomczyk, S. W. McIntosh,Astrophys. J. (in press); available at http://arxiv.org/abs/0903.2002 .
2. B. De Pontieu et al., Science 318, 1574 (2007). https://doi.org/10.1126/science.1151747


