Atlantic water carried northward sinks farther east of previous estimates
DOI: 10.1063/PT.3.4179

Climate models predict that the Atlantic Ocean’s overturning circulation should slow down over the next few decades. 1 If they’re right, northern Europe could experience colder winters, and the global cycling of nutrients that feeds biological systems may be disrupted. The regularly functioning meridional overturning circulation (MOC) moves warm surface water from the tropical Atlantic to higher latitudes where it loses heat to the atmosphere. Once the cold, salty, and consequently dense water reaches the northern Atlantic and Arctic, it sinks, or overturns, to a depth of 1–5 kilometers and becomes what’s known as deep water. It then travels southward back to the tropics as part of a global ocean circulation (see the article by J. Robert Toggweiler, Physics Today, November 1994, page 45 ).
Simulations are the only way to evaluate the future state of the MOC, and direct measurements are needed to test and evaluate models. For decades, physical oceanographers who study the MOC have hitched their wagons to hydrographic research cruises to collect those observations. Temperature, salinity, velocity, and other properties of seawater have been measured at many depths and locations when cruises pass through the North Atlantic. The cruises are expensive, though, and usually happen a year to a few years apart. Researchers can’t rely on such infrequent sampling to gauge long-term MOC trends.
Data-gathering efforts expanded substantially in 2004 when RAPID-MOCHA, an international partnership between the UK-based Rapid Climate Change program and the US-based Meridional Overturning Circulation and Heatflux Array, deployed the first set of ocean sensors to collect continuous measurements and at many depths in the Atlantic. Rather than choosing the subpolar North Atlantic for the array, researchers chose the subtropics because it’s home to fewer, less-complicated flows. In examining the historical data from the hydrographic cruises and one year of measurements from the array, oceanographers were stunned to learn that the month-to-month variations of the MOC could be as large as 10 Sv (1 sverdrup equals 1 million cubic meters per second), or about half of the MOC’s average annual transport. 2 Many researchers thought that such large variations were only possible on decadal to multidecadal time scales.
To better understand the entire spectrum of MOC variability, Susan Lozier of Duke University and international colleagues have deployed the first array of ocean sensors to continuously collect measurements in the subpolar North Atlantic. 3 Known as the Overturning in the Subpolar North Atlantic Program (OSNAP), the array collects data across the region at multiple depths. When the researchers analyzed the initial 21 months of data, they found that the eastern North Atlantic overturned seven times as much water as the western region.
Years in the making
Research since RAPID-MOCHA was first deployed has revealed that the MOC in the subpolar Atlantic can vary independently from the subtropics. A 2010 study that combined observations with a numerical model concluded that overturning in the subtropics from 1950 to 2000 had slightly weakened while the subpolar overturning had strengthened. 4 Another study from 2014 that reanalyzed historical data from 1965 to 2000 found that variability in the storage of heat in the subtropical Atlantic differed from the subpolar Atlantic basin. 5 Meanwhile, most simulations suggested that overturning in the subpolar North Atlantic should be dominated by density-driven flows primarily in the Labrador Sea to the west of Greenland, with some contribution from the Nordic Seas. Even before those studies were published, an international team of oceanographers began planning another array.
“We met over the course of three days at Duke in 2010,” says Lozier, “and the design came together.” It took another five years before OSNAP—a collaboration between Canada, China, Germany, the Netherlands, the UK, and the US—deployed the trans-basin array. As shown in figure
Figure 1.

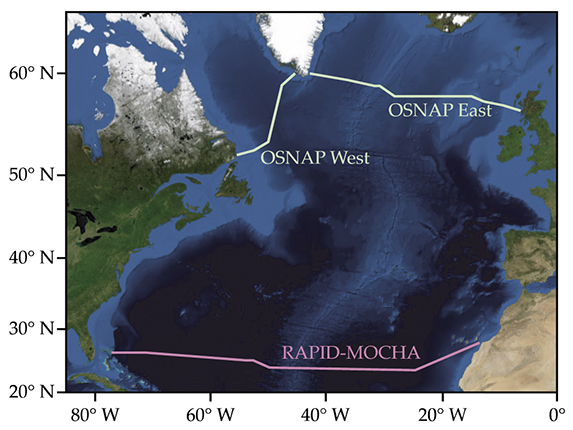
The Overturning in the Subpolar North Atlantic Program (OSNAP) is the first array to continuously measure temperature, salinity, and velocity at regular depth intervals in the northern Atlantic and Arctic Oceans. OSNAP West crosses the Labrador Sea between northeastern Canada and southwestern Greenland. OSNAP East stretches across the basins to the east of Greenland and ends at the western coast of Scotland. The first measurement array in the Atlantic, RAPID-MOCHA, is an international partnership between
Each mooring, one of which is shown in figure
Figure 2.

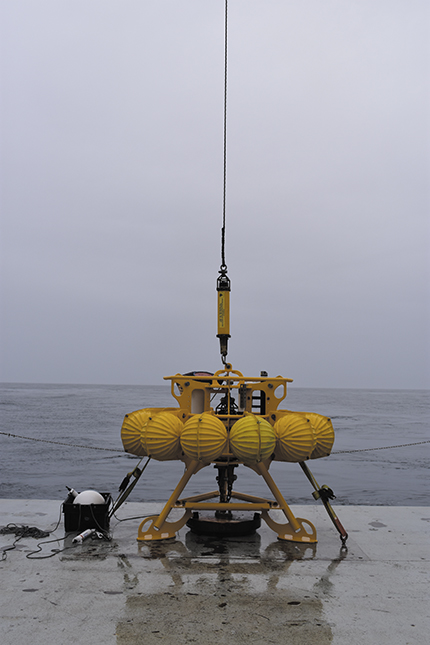
The mooring shown here will sit on Greenland’s continental shelf 200 m below the surface. While the yellow portion anchors the mooring to the seafloor, the instruments in the black box to the left float above it and collect continuous measurements of temperature, salinity, and velocity at multiple depths.
ISABELA LE BRAS, UNIVERSITY OF CALIFORNIA, SAN DIEGO
Overturning expectations
The discovery, shown in figure
Figure 3.

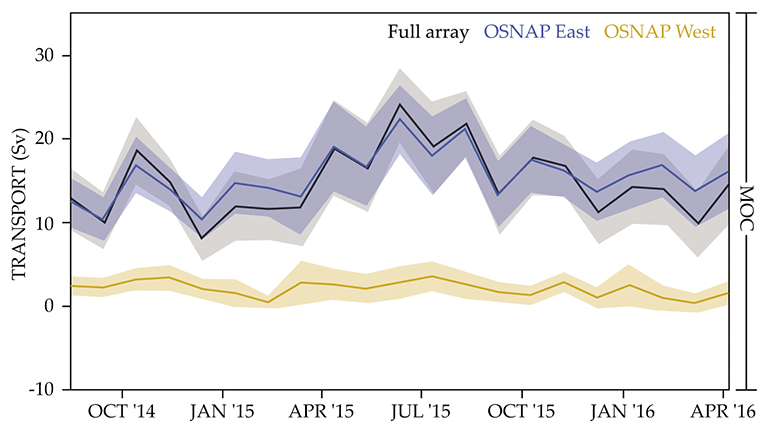
Seven times as much water overturned across the eastern array (blue) compared to the western array (yellow) of the Overturning in the Subpolar North Atlantic Program (OSNAP). (1 sverdrup, Sv, equals 1 million cubic meters per second.) The shading denotes the uncertainty in the 30-day averaged transport.
Because OSNAP is positioned at the gateway through which heat enters the Arctic, the new data will also help uncover how heat moves through the North Atlantic. To that end, the researchers partitioned the water into a uniform-density flow and a density-varying MOC flow. The results revealed that 73% of the average heat transported was attributable to the MOC. Because the Labrador Sea experienced far less overturning than expected, the newly observed eastern pathway for heat to the Arctic challenges previous expectations too.
In contrast to the overturning’s strong effect on heat transport, overturning had less of an effect on the transport of fresh water that comes either from glacier melt or excess precipitation over the ocean. More fresh water was moved in the west, which had a weaker MOC than the east, from July through November of 2015. The water crossing OSNAP West consists mostly of a uniform-density flow. However, the water in the east has flows of uniform density that nearly match the density-varying MOC flow. Lozier and her colleagues hypothesize that the flow imbalances in the west and strong salinity differences across the Labrador basin spur a stronger flux of freshwater transport.
A new mental model
Jochem Marotzke, an oceanographer from the Max Planck Institute for Meteorology, who helped initiate the RAPID-MOCHA program, says the first OSNAP results “confirm what a small minority of us have been saying based on modeling studies: The connection between deepwater formation and the sinking branch of the MOC is way more complicated than that held by prevailing beliefs.”
Many simulations predict that climate change will weaken the MOC. OSNAP is still in its early days; confirming those predictions will require measurements over a longer time. And resolving the MOC’s basin-scale differences by comparing the OSNAP results with those from RAPID-MOCHA could benefit from more measurements.
A short record, though, can still improve climate models. “We can test whether the models show the same relationship between deepwater formation and MOC as in the measurements,” says Marotzke. That verification will help determine the skill of models in simulating the MOC in a future climate. The ocean also moderates climate by acting as a carbon sink (see the article by Jorge L. Sarmiento and Nicolas Gruber, Physics Today, August 2002, page 30 ). Therefore, improved observations of the MOC will help modelers develop more realistic simulations of the ocean’s uptake and storage of carbon.
Though limited, the data may also help open researchers’ minds to new ideas. “Even the short measurements rattle beliefs long held by many,” says Marotzke. Yet such shifts in thinking are routine in science. “Even though the final word cannot be said,” says Marotzke, “the measurements prepare us for having to revise our mental models of how the ocean works.”
References
1. T. F. Stocker et al., eds., Climate Change 2013: The Physical Science Basis—Working Group I Contribution to the Fifth Assessment Report of the Intergovernmental Panel on Climate Change, Cambridge U. Press (2013).
2. S. A. Cunningham et al., Science 317, 935 (2007). https://doi.org/10.1126/science.1141304
3. M. S. Lozier et al., Science 363, 516 (2019). https://doi.org/10.1126/science.aau6592
4. M. S. Lozier et al., Nat. Geosci. 3, 728 (2010). https://doi.org/10.1038/ngeo947
5. R. G. Williams et al., J. Clim. 27, 698 (2014). https://doi.org/10.1175/JCLI-D-12-00234.1
More about the authors
Alex Lopatka, alopatka@aip.org


