Deep convection drives oceanic overturning
DOI: 10.1063/pt.uvlg.jjol


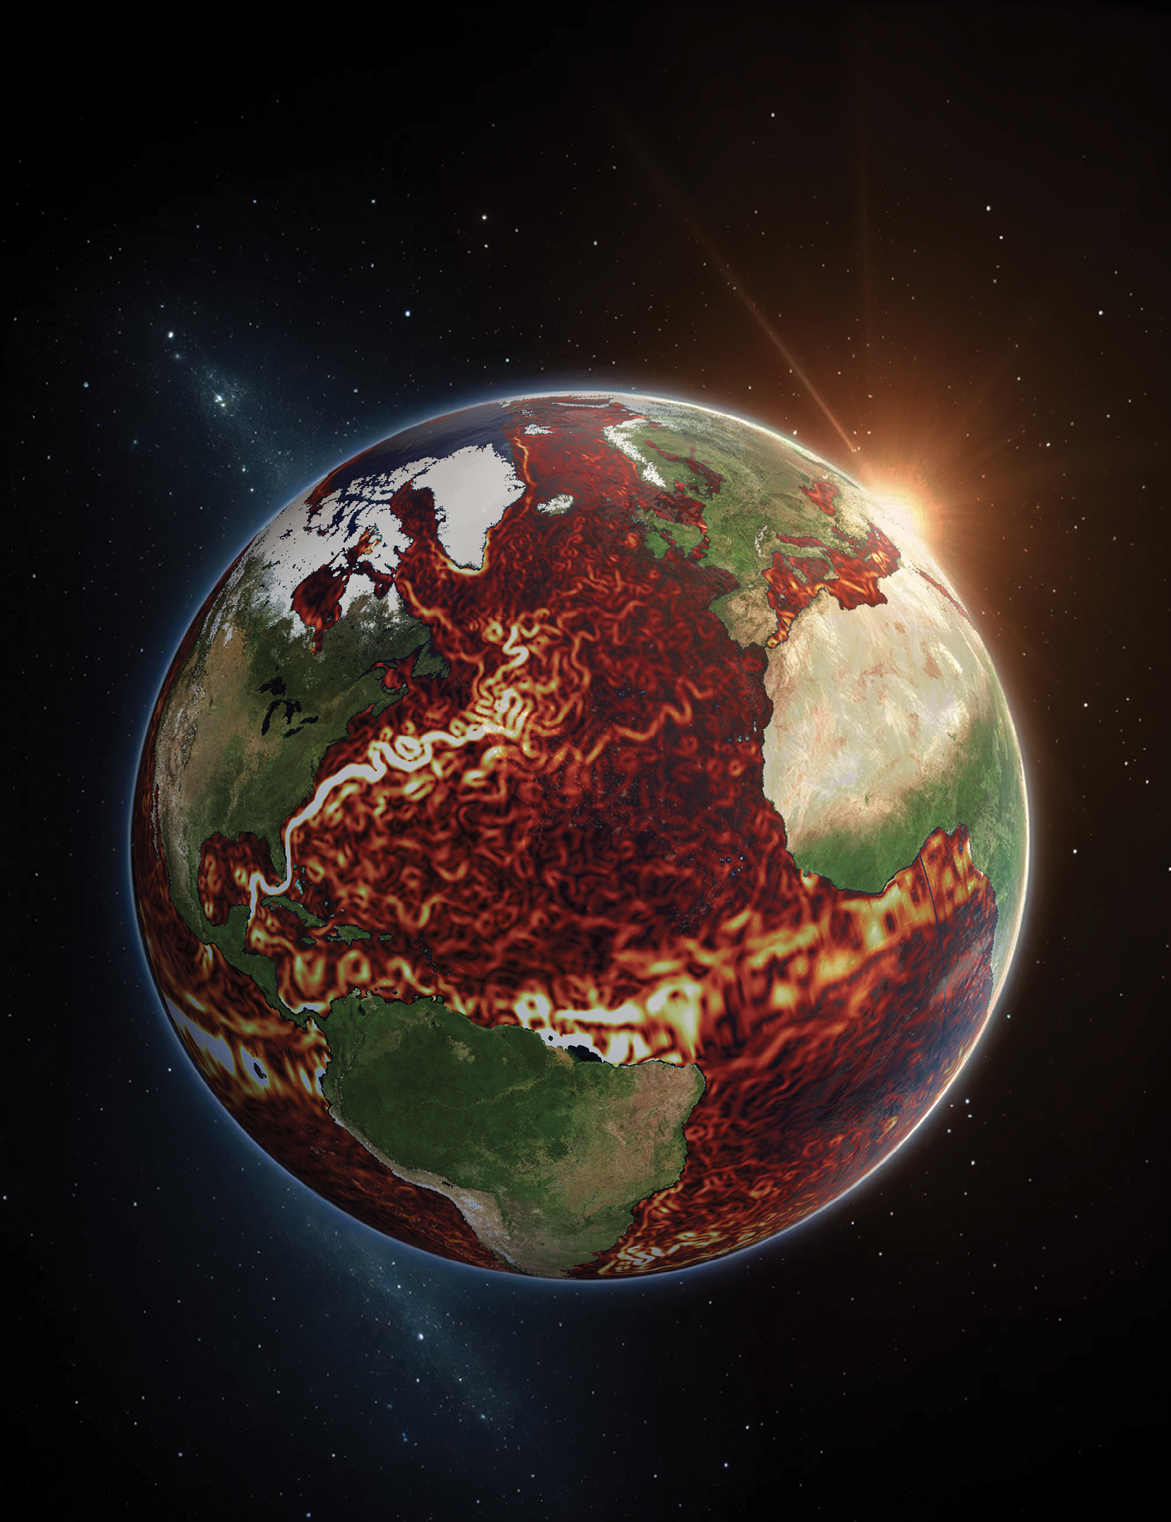
In 1751 Henry Ellis, captain of the British slave-trading ship Earl of Halifax, was sailing across the North Atlantic Ocean when he made a surprising discovery. At 25° N, the latitude of modern-day Miami, he measured the temperature of the ocean waters. Taking measurements as deep as a mile, he found very cold water sitting below the warm tropical waters at the surface. Those water masses could have been cooled to such low temperatures only in an extremely cold environment, which indicated that they originated in polar regions. 1
It wasn’t until decades later, in 1797, that Count Rumford (Benjamin Thompson) recorded, in his essay “Of the propagation of heat in fluids,” the important implication of those measurements: that they could be explained only through a North–South circulation system in the ocean. In the high latitudes of the North Atlantic, cold air during the winter months cools and densifies surface waters, causing them to descend to great depths in the ocean interior. At depth, that cold water spreads equatorward, inducing an opposing surface-level current that transports warm water from the equator to high latitudes. The result is an overturning circulation that moves like a conveyor belt.

(IMAGE CREATED BY KAUSHIK MISHRA AND BISHAKHDATTA GAYEN WITH DATA FROM THE PHYSICAL OCEANOGRAPHY DISTRIBUTED ACTIVE ARCHIVE CENTER AND NASA’S VISIBLE EARTH, BLUE MARBLE COLLECTION.)
Today we know a lot more about the global ocean’s overturning circulation, in particular the overturning circulation in the Atlantic Ocean. The Atlantic Meridional Overturning Circulation (AMOC) redistributes a significant amount of heat, fresh water, and carbon; as a result, it plays a crucial role in the climate system. 2 Poleward heat transport by the AMOC, for example, is the reason why temperatures in northern Europe are much higher than those at similar latitudes elsewhere. It has also stabilized Europe’s climate for thousands of years.
Earth’s climate has not always been stable. For example, in the last glacial period, which ended 11 500 years ago, Earth experienced pronounced temperature swings on time scales of decades or less, much shorter than the time scales of climate change’s known orbital drivers, which operate over periods of 26 000 to 100 000 years. Those abrupt changes in the last glacial period were linked to variability of the AMOC. 3 Theory and climate models suggest that the AMOC is a nonlinear system with multiple equilibrium states. 4 Climate scientists consider disruptions to the AMOC one of the most powerful and likely tipping points in Earth’s climate system, 5 and they’ve extensively debated whether we are nearing a major upset of the circulation system due to changing climate.
One of the key uncertainties obscuring scientific understanding of the dynamics of that circulation system, including what drives its variability on different time scales, is the elusive link between deep convection and the mass transport of water associated with the AMOC.
6
As illustrated in figure
Figure 1.

The Atlantic Meridional Overturning Circulation is composed of currents that move warm, less-dense water (red arrows) at the ocean surface and cold, denser water (blue arrows) at depth, vertically linked by regions of deep convection in the Labrador, Irminger, and Norwegian Seas (yellow patches). Warm ocean currents flow toward the North Pole and are continuously cooled by the atmosphere along the way (illustrated by transition from red to orange in the Labrador, Irminger, and Norwegian currents), and then at depth, they return toward the equator. (Adapted from ref.
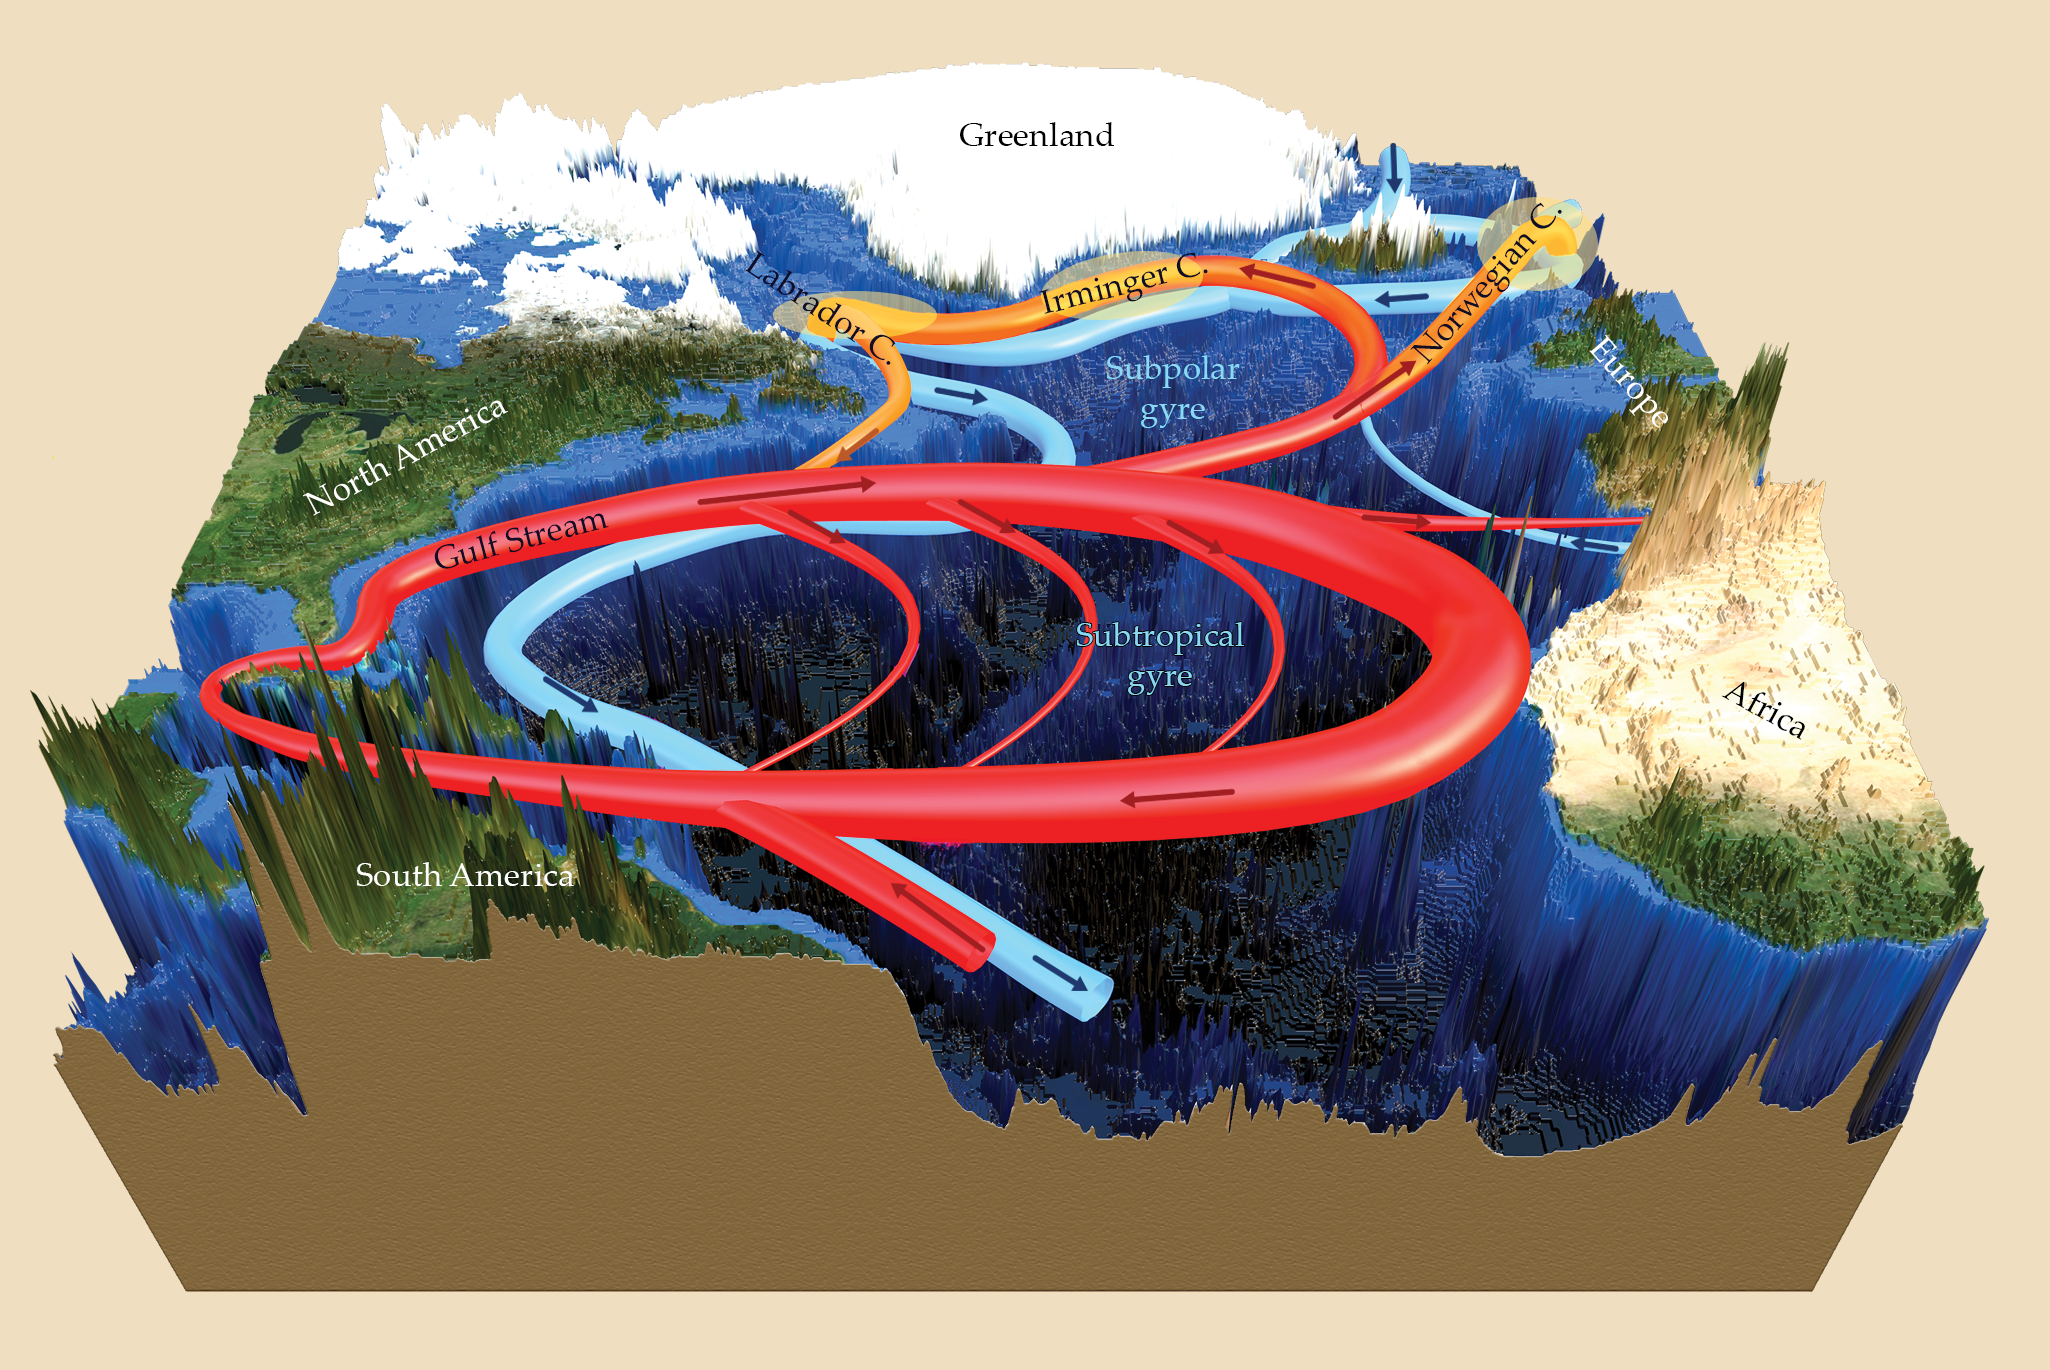
The apparent conundrum is that the shallower and deeper branches are associated with a transport of water of close to 20 sverdrup (1 sverdrup is equal to 106 m3/s; for comparison, the total global input of fresh water from rivers into oceans is ~1.2 sverdrup). But in the classic oceanographic view, the vertical exchange processes acting in regions of deep convection are not associated with any net mass transport. 7 Instead, deep convection is conceived of as the mixing of water parcels vertically, resulting in only up- and downward scalar transport of properties like temperature, salinity, and nutrient load. Given that view of ocean convection, how can an overturning circulation of 20 sverdrup move through regions of deep convection without a net transport of any water taking place?
Unnoticed by much of the oceanographic community, the missing link can be found in a process known as rotating horizontal convection. It is a complex form of convection that accounts for differential heating and cooling along the ocean surface, as well as Earth’s rotation. The character of rotating horizontal convection has been uncovered by research into geophysical fluid dynamics using both laboratory experiments and turbulence-resolving direct numerical simulations.
8
,
9
Realistic scaled physical models, based on dynamic similarity arguments (see
Using dynamic similarity to simulate ocean convection
The principle of dynamic similarity posits that if two fluid flows—regardless of their absolute length scale or each fluid’s specific properties—have the same values for all relevant dimensionless numbers, they are dynamically similar. In essence, they behave in the same way. As a result, researchers can study complex Earth-scale systems by building dynamically similar lab-scale experiments.
The dimensionless numbers relevant to large-scale ocean circulation include the Rayleigh number, which signifies the driving force of buoyancy against dissipative forces; the Rossby number, which reflects the ratio of inertial forces to Coriolis forces; and the Ekman number, which indicates viscous forces in relation to the Coriolis effect. Not only do those numbers provide a means of producing systems with dynamic similarity, but they also encapsulate the fundamental forces at play in oceanic circulations. By carefully designing experiments or simulations in which those nondimensional numbers match the conditions of the real-world system of interest, researchers can gain invaluable insights into the behavior of vast ocean circulations. Those values can be tuned in many ways, such as by using materials of different viscosities, or altering the dimensions of the experimental setup. That approach not only makes the otherwise insurmountable task of studying global systems feasible, but it also bridges the gap between theory and observation, which opens the door to more accurate predictions and a deeper understanding of our world’s oceans.
The simplest form of convection
Convection is a captivating phenomenon that occurs when a fluid moves because of differences in buoyancy. At its most basic level, that movement is driven by the interplay between buoyancy and gravitational forces. Imagine a shallow pan filled with water, with its base heated and its surface exposed to a cooler environment, as modeled in figure
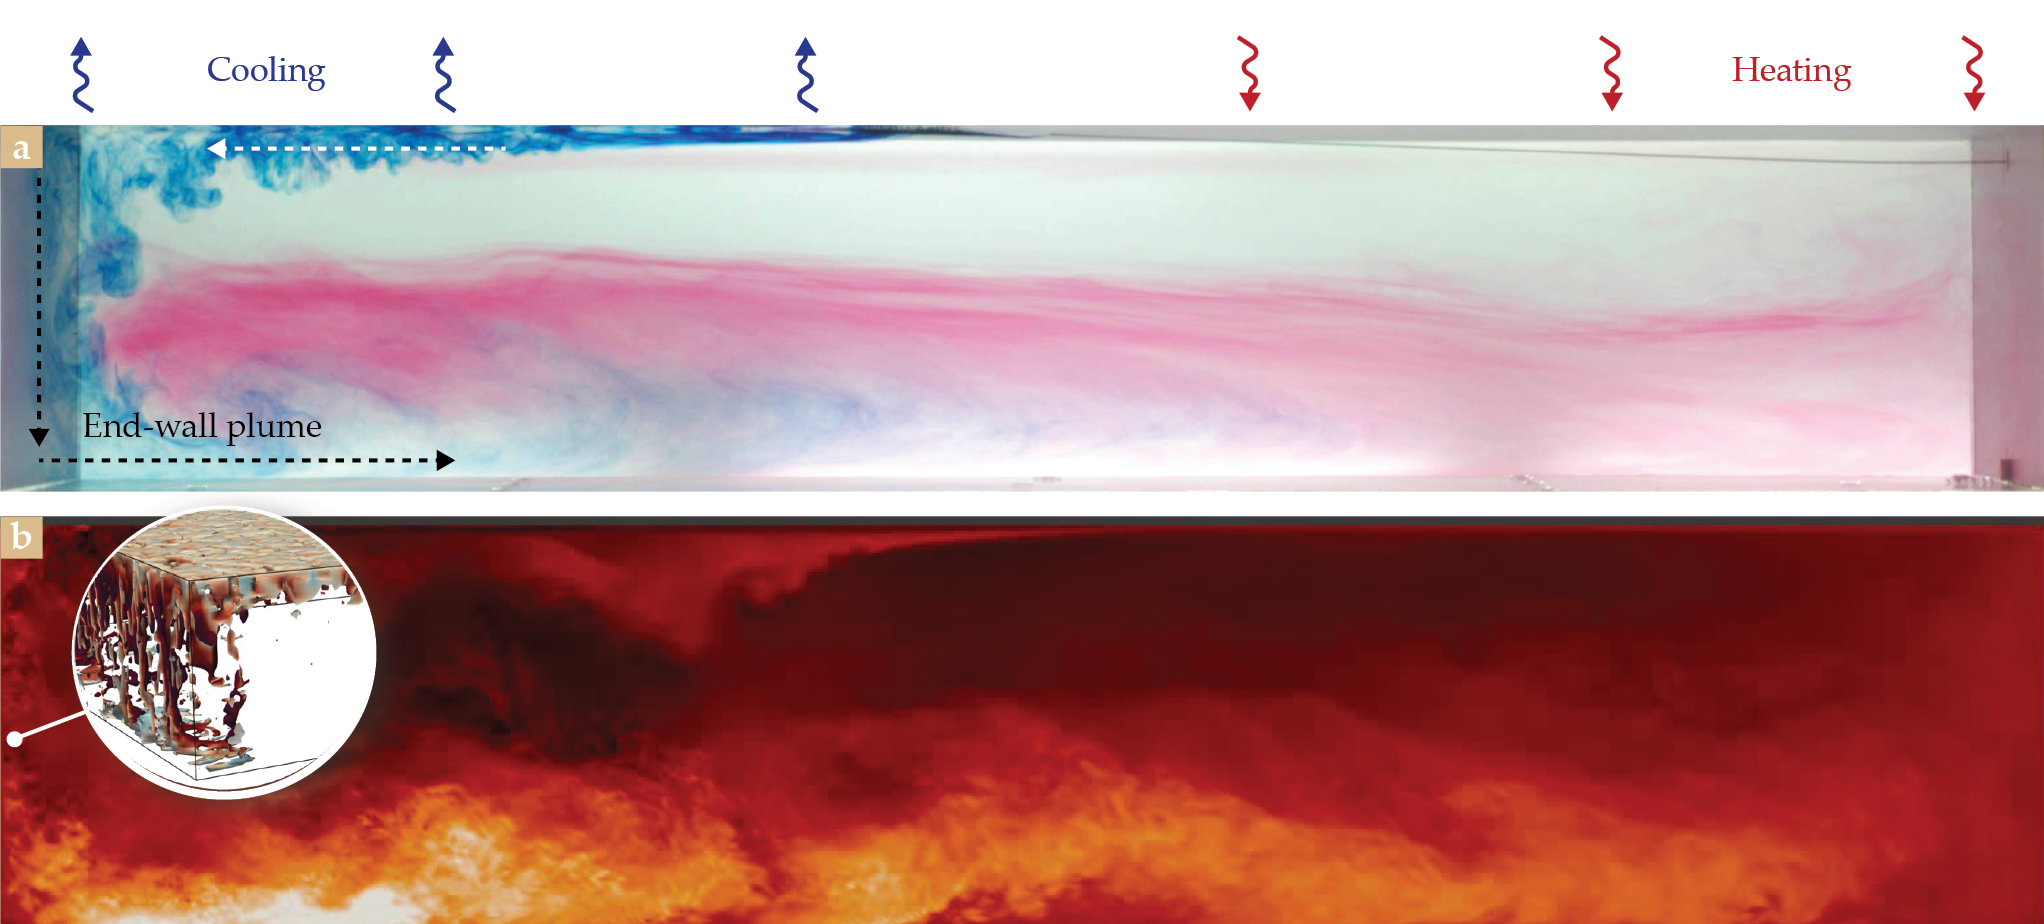
Figure 2.

The flow field from a numerical experiment of Rayleigh–Bénard convection in a 3D rectangular box illustrates convective motions between a heated surface and a cooled surface, with colors representing vertical velocities (blue for upward and red for downward motions).
Convection in fluids is defined by the dimensionless Rayleigh number Ra, which accounts for buoyancy forces and viscous resistance. Beyond a critical Ra (~103), convection cells known as rolls emerge and arrange into symmetric patterns. With increasing Ra, flow becomes turbulent and shows chaotic movements. At higher levels (Ra > 1010), smaller plumes self-organize into megaplumes that resemble large-scale atmospheric currents. Megaplumes add complexity by introducing shear forces that affect the behavior of smaller plumes and create a cycle of interactions.
Self-organization is a key process in which local interactions spontaneously transform disordered systems into structured patterns, such as mantle plumes and atmospheric convective storms, which are observable across various physical domains. (See the article by Caroline Muller and Sophie Abramian, Physics Today, May 2023, page 28 .) In that process, complex behaviors and structures can emerge from simple rules inherent to the system. The phenomenon challenges the traditional top-down approach to understanding complexity.
The classic view of deep oceanic convection 7 is consistent with idealized Rayleigh–Bénard convection, in which fluid’s vertical movements exchange water parcels between the heated and cooled parts of the domain without any net mass exchange. But that view cannot explain the mass transport associated with large-scale vertical and horizontal components of the overturning circulation observed in the ocean.
Going horizontal
In Rayleigh–Bénard convection, the flow is forced by heating from below and cooling from above, with a vertical buoyancy gradient parallel to the force of gravity. In the ocean, temperature changes are driven by air temperatures and solar radiation along the horizontal ocean surface. At equatorial latitudes, solar radiation heats the ocean, while near the poles, the ocean is cooled, setting up large-scale buoyancy gradients perpendicular to the force of gravity. Additional buoyancy gradients arise from differences in salinity, which are controlled by regions of evaporation and precipitation, the freezing and melting of sea ice, and freshwater discharge by rivers. Cooling and heating along a horizontal surface leads to a class of convective flows known as horizontal convection,
8
as shown in both a laboratory experiment and a numerical simulation in figure
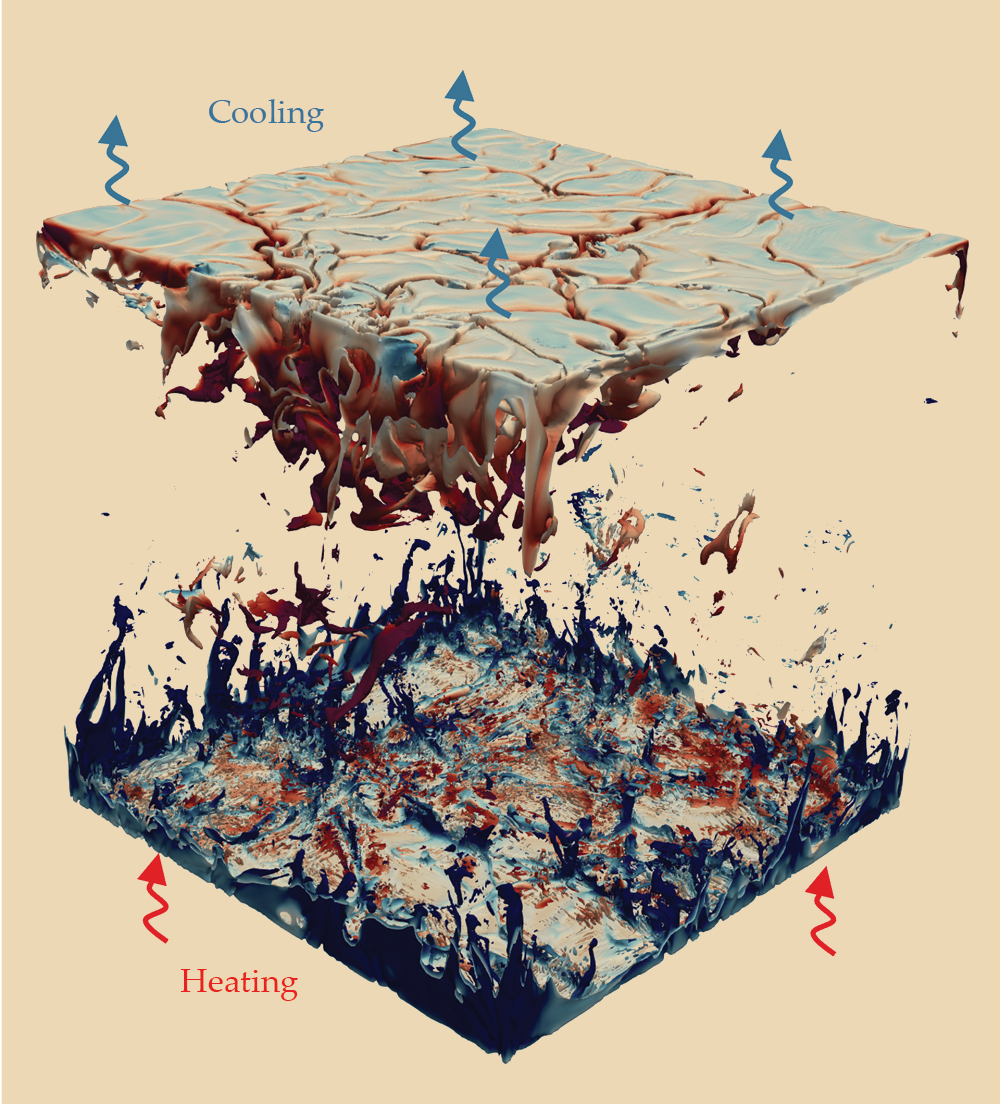
Figure 3.

Horizontal convection is illustrated by the flow field from both (a) a laboratory experiment (Rayleigh number 1012) and (b) a numerical simulation (Rayleigh number 1015) of horizontal convection in a 3D rectangular box domain. In panel a, dye visualization shows the flow path from the heated region to the cooled region (right to left) along the upper boundary and broader bottom flow in the opposite direction. A full-depth end-wall plume is observed against the wall at the cooled end of the domain. (Adapted from ref.
In Rayleigh–Bénard convection, both heating and cooling impose destabilizing buoyancy forcing, resulting in up and down motions concurrently. In contrast, in horizontal convection, it is only cooling that promotes destabilizing buoyancy forcing, because the heating from the top of the surface means the warmer, less dense water at the surface is gravitationally stable. That arrangement sets up overturning spanning the whole domain. As the cool water falls, a horizontal flow that forms along the surface moves water from the heated domain to the cooled domain, as shown from right to left in figure
That horizontal convection model is analogous to horizontal flow in the ocean, in which water moves from the low latitudes where it is heated to polar latitudes where it is cooled. In the ocean, the horizontal flow is confined to a stable boundary layer, generally a few hundred meters thick, at the ocean surface. To replenish the water at the surface, water rises at tropical and subtropical latitudes. The horizontal surface current is stabilized by the large vertical buoyancy gradients at the base of the boundary layer, with the dense, cold water mass naturally remaining below the warm water mass above.
Large horizontal buoyancy gradients thus create the conditions for an overturning circulation. For horizontal convection with Ra < 10¹⁰ (the length scale is determined by the box’s horizontal length, which is different from Ra values determined by the domain height, commonly used in the classical Rayleigh–Bénard definition), a laminar overturning circulation forms. Laminar circulation features a narrow and weak horizontal flow across the upper boundary and is marked by a single weaker end-wall plume in the domain of the unstable boundary. 10
For settings with larger Ra, such as the ocean (where the value ranges between 1020 and 1024), flow is more energetic and generates convective eddies. In cold regions, where cooling of the surface water is destabilizing, convective plumes emerge in the stable, warm boundary-layer flow and lead to the formation of mixed-temperature layers in mid- to high latitudes. 10 Farther toward polar latitudes, continuous cooling makes those convective plumes penetrate increasingly deeper into the water column.
In lab experiments, those dynamics change once the flow approaches the end wall. There, because of the combined effects of boundary-induced turbulence and the lack of lateral space for the plumes to spread, the plumes merge through self-organization and penetrate the entire depth of the water column. That phenomenon leads to the creation of large convective activity against the end walls, like the left wall in figure
Away from the boundaries and the end walls, in the more quiescent interior of the domain, a broad upward flow is established to restore mass conservation in the system. After slowly moving upward, fluid moves horizontally from the warm end to the cool end and completes the box-scale circulation loop that is an overturning circulation.
Adding a twist
Just when it might seem that the complexity of oceanic convection has been fully unraveled, another dimension emerges: the rotation of the planet. As Earth rotates on its axis, it bestows upon every moving entity a subtle yet profound pseudoforce, known as the Coriolis force. Invisible yet omnipresent, the Coriolis force imparts a preferential spin to fluid bodies in motion, including the vast swaths of oceanic currents.
When the principles of horizontal convection are superimposed onto a rotating framework, the dynamics are known as rotating horizontal convection,
9
and the resulting circulation patterns resemble those observed in the ocean. One key change that occurs with the addition of the Coriolis force is that instead of the flow from heated to cooled regions spreading homogeneously across the full width of the domain, poleward flow is concentrated in narrow, fast-flowing boundary currents, as shown in a numerical simulation in figure
Figure 4.

Rotating horizontal convection is numerically simulated in a domain similar to the Northern Hemisphere section of the Atlantic basin. Circulation is shown as kinetic energy (brighter regions have higher energy). The inset illustrates a descending boundary-layer current, wall plumes, and convective chimneys as an isosurface of the kinetic-energy field. A horizontal stream function, shown as contours above the model domain, highlights the anticyclonic and cyclonic gyres associated with the heated and cooled regions, respectively.
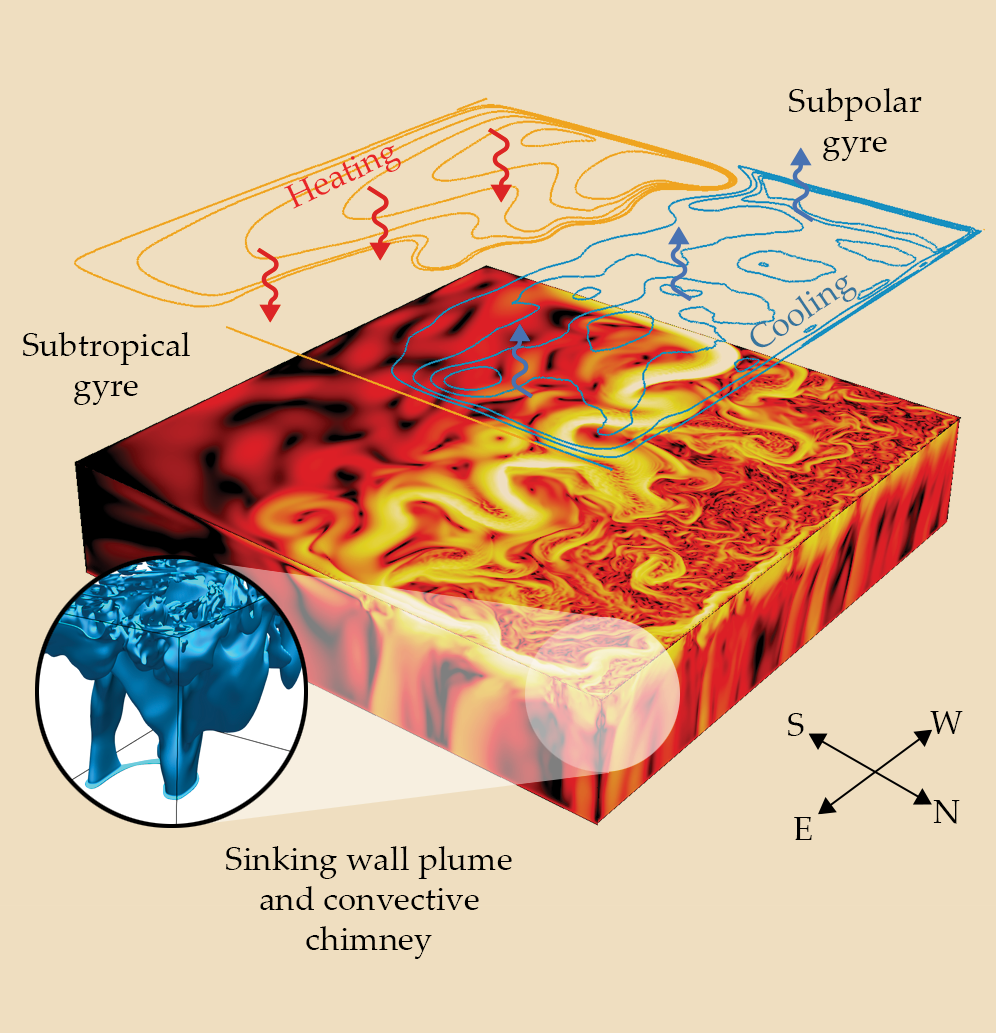
In the heated region appears an anticyclonic gyre, akin to the subtropical gyre shown in the schematic in figure
Once the western boundary current reaches the point of negligible heat input, where the flow transitions from heating at equatorial latitudes to cooling at polar latitudes, the current separates from the western boundary and flows east across the basin. The east–west zonal current is supported by a north– south buoyancy difference caused by temperature forcing and is influenced by the Earth’s rotation, a phenomenon commonly referred to as the thermal wind balance. 11 Often that balance breaks down and flow becomes unstable, which leads to the emergence of mesoscale eddies, the oceanic equivalents of atmospheric storms.
Once the flow approaches the eastern boundary, it continues northward and, when it reaches the northern end wall, turns westward (see figure
As with horizontal convection, surface cooling leads to downward convective plumes (commonly known as convective chimneys when discussed in the context of a rotating environment) that reach increasingly deeper into the water column until they eventually penetrate the entire column depth. In the presence of rotation, the plumes are located along the narrow boundary current, with an end-wall plume toward the northeast corner of the domain (see the figure
Closing the circle
The idealized dynamics of rotating horizontal convection show the connection between oceanic deep convection and the AMOC. To visualize that connection, researchers use output from a high-resolution simulation based on the Community Earth System Model,
12
with a focus on the area of the subpolar gyre and deep convection of the northern Atlantic Ocean, as shown in figure
Figure 5.

An ocean system model derived from the Community Earth System Model. (a) Ocean basins relevant to regions of deep convection are apparent in a map of the bathymetry of the North Atlantic, including the Labrador Basin (LB), Irminger Basin (IrB), and Iceland Basin (IcB). Models that incorporate bathymetry and ocean eddies are used to calculate (b) the magnitude of velocities at the ocean surface, (c) the mean mixed-layer depth (MLD) over the winter months (December to March), and (d) the maximum MLD.
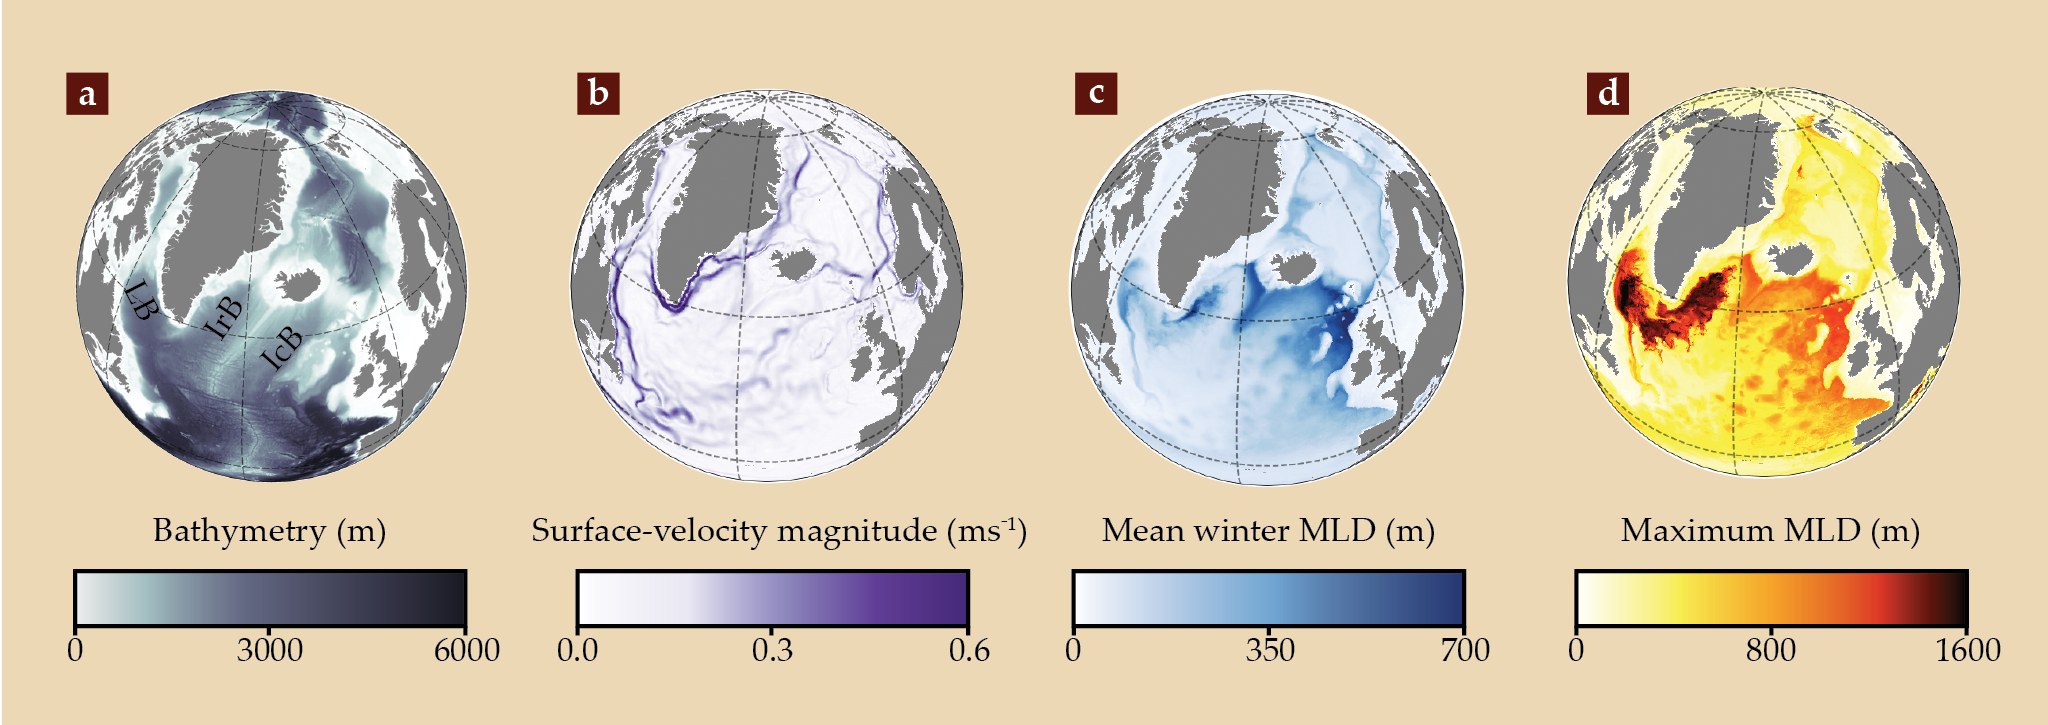
One difference between idealized experiments and Earth is the roughness of the ocean floor, as shown in figure
Oceanic convection can be visualized by the mean mixed-layer depth—the depth over which convection homogenizes the water column—over the winter months, as shown in figure
The other style of convection can be seen in narrow bands against steep ocean floor topography in the Iceland Basin and northeastern region of the Irminger Basin (south and east of Iceland, respectively), with mixing extending up to 700 m in depth during the winter months. It is those northeast corners where the circulation, in the presence of planetary rotation, can build up a pressure gradient, which creates narrow regions with a net-downward mass transport, 14 consistent with observations, 15 idealized ocean models, 16 and experiments of rotating horizontal convection. 9
The reason for those two distinct convective regions is planetary rotation, which separates end-wall-style plumes and regions of net-downward mass transport. Both of those convective regions are crucial components of the overturning circulation, and neither of them controls AMOC variability on its own.
The main features of the AMOC are the result of large-scale buoyancy gradients at the ocean’s surface due to both surface heating in equatorial regions and cooling in polar regions, with salinity and winds also playing important roles that are not discussed here. Like the atmosphere (see the article by Martin Singh and Morgan O’Neill, Physics Today, July 2022, page 30 ), the AMOC acts as a heat engine that produces mechanical energy through the transport of heat from warmer regions to cooler regions. The resulting circulation, described by the dynamics of rotating horizontal convection, leads to the large oceanic heat transport that dictates the mild European climate. Thus, understanding the convection processes at play in ocean circulation is crucial to our understanding of the ocean’s role in a future climate.
Laboratory experiments and numerical simulations are immensely valuable basic-research tools to understand geophysical fluid dynamics and our complex climate system. Already used by the atmospheric science community, that research approach could be applied in future work to build understanding about the role of self-organization of convective plumes in oceanic overturning circulation. Idealized physical experiments make complex physical processes into measurable phenomena, opening the door to a clearer understanding of those systems.
Bishakhdatta Gayen is supported by an Australian Research Council Future Fellowship. Numerical simulations were performed on the National Computational Infrastructure at the Australian National University, with support from the Commonwealth of Australia. Gratitude is extended for valuable discussions with colleagues, particularly Ross Griffiths, Graham Hughes, Catherine Vreugdenhil, Andy Hogg, and Fabien Roquet. Andreas Klocker appreciates the support of the Bjerknes Centre for Climate Research through its backing from the Norwegian Ministry of Education and Research, and he thanks his colleagues at the Bjerknes Centre’s DYNASOR (DYnamics of the North Atlantic Surface and Overturning ciRculation) project for useful discussions.
References
1. B. A. Warren, in Evolution of Physical Oceanography: Scientific Surveys in Honor of Henry Stommel, B. A. Warren, C. Wunsch, eds., MIT Press (1981), p. 7.
2. M. W. Buckley, J. Marshall, Rev. Geophys. 54, 5 (2016). https://doi.org/10.1002/2015RG000493
3. J. Lynch-Stieglitz, Annu. Rev. Mar. Sci. 9, 83 (2017). https://doi.org/10.1146/annurev-marine-010816-060415
4. W. Weijer et al., J. Geophys. Res. Oceans 124, 5336 (2019). https://doi.org/10.1029/2019JC015083
5. T. M. Lenton et al., Proc. Natl. Acad. Sci. USA 105, 1786 (2008). https://doi.org/10.1073/pnas.0705414105
6. M. F. de Jong, L. de Steur, Geophys. Res. Lett. 43, 7106 (2016). https://doi.org/10.1002/2016GL069596
7. J. Marshall, F. Schott, Rev. Geophys. 37, 1 (1999). https://doi.org/10.1029/98RG02739
8. G. O. Hughes, R. W. Griffiths, Annu. Rev. Fluid Mech. 40, 185 (2008). https://doi.org/10.1146/annurev.fluid.40.111406.102148
9. B. Gayen, R. W. Griffiths, Annu. Rev. Fluid Mech. 54, 105 (2022). https://doi.org/10.1146/annurev-fluid-030121-115729
10. B. Gayen, R. W. Griffiths, G. O. Hughes, J. Fluid Mech. 751, 698 (2014). https://doi.org/10.1017/jfm.2014.302
11. H. U. Sverdrup, Proc. Natl. Acad. Sci. USA 33, 318 (1947). https://doi.org/10.1073/pnas.33.11.318
12. P. Chang et al., J. Adv. Model. Earth Syst. 12, e2020MS002298 (2020). https://doi.org/10.1029/2020MS002298
13. A. Bretones et al., J. Climate 35, 109 (2022). https://doi.org/10.1175/JCLI-D-21-0152.1
14. J. Marotzke, J. R. Scott, J. Phys. Oceanogr. 29, 2962 (1999). https://doi.org/10.1175/1520-0485(1999)029<2962:CMATTC>2.0.CO;2
15. M. S. Lozier et al., Science 363, 516 (2019). https://doi.org/10.1126/science.aau6592
16. M. A. Spall, R. S. Pickart, J. Phys. Oceanogr. 31, 810 (2001). https://doi.org/10.1175/1520-0485(2001)031<0810:WDDWSA>2.0.CO;2
More about the authors
Bishakhdatta Gayen is an Australian Research Council Future Fellow and an associate professor in mechanical engineering at the University of Melbourne in Australia and an assistant professor at the Centre for Atmospheric and Oceanic Sciences at the Indian Institute of Science. His research explores the impact of small-scale turbulence and convection on global ocean circulation and the melting of Antarctic ice shelves. Andreas Klocker is a senior researcher in the Earth systems group at NORCE Norwegian Research Centre and the Bjerknes Centre for Climate Research, both in Bergen, Norway. His research focuses on understanding the dynamics of polar oceans and the global overturning circulation.


