Computed tomography turns 50
DOI: 10.1063/PT.3.4834


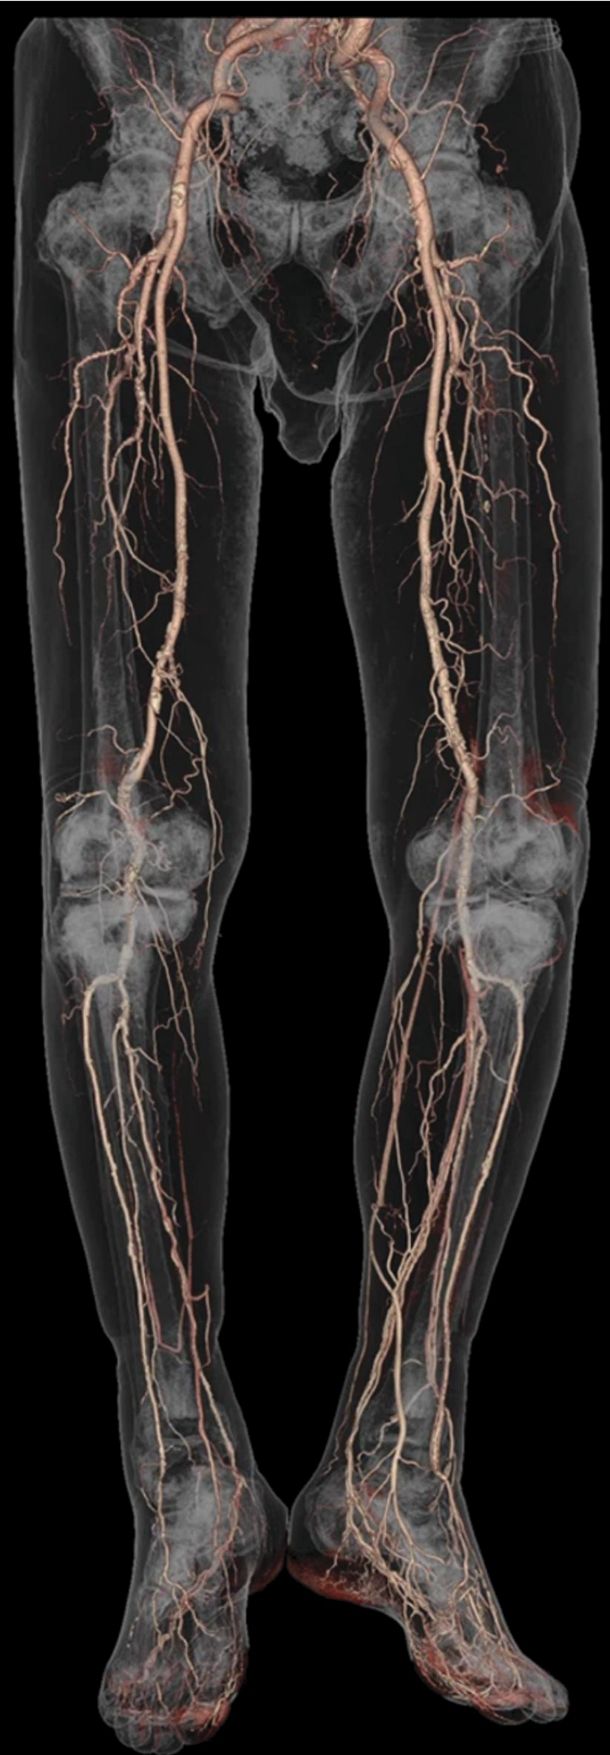
Computed tomography (CT) uses thousands of x-ray transmission measurements taken at different angles around a patient to produce three-dimensional cross-sectional images of the human body. That technology allows physicians to visualize their patients’ internal anatomy, as shown in the opening image, and reveals the presence of acute and chronic diseases and the consequences of injury in remarkable detail. Prior to the integration of CT into clinical radiology, physicians relied on exploratory surgery to diagnose many serious patient symptoms. Thankfully, that’s now a relic of the past.

Image courtesy of Hiroshi Moriya, MD, PhD, Ohara General Hospital, Japan.
CT had a curious birth. The Central Research Laboratories of the British music company EMI were well known for their development of stereophonic sound, broadcast television devices, and radar. Yet in the late 1960s, with financial support from the UK’s Department of Health and Social Security, radar-operator-turned-electrical-engineer Godfrey Hounsfield developed the first x-ray CT scanner (see reference and box
Computed tomography and the Nobel Prize
CT inventors Godfrey Hounsfield and Allan Cormack were awarded the Nobel Prize in Physiology or Medicine in 1979. That’s an interesting distinction, given that neither researcher was a physiologist or physician. (Both were physical scientists—an engineer and physicist, respectively; for their Nobel lectures, see reference .) A South African physicist who worked in the US at the time the prize was awarded, Cormack investigated the mathematical principles 13 , 14 of tomographic imaging using a cobalt-60 radiation source in the early 1960s.
Working independently in the UK, Hounsfield developed CT hardware using an x-ray tube between 1967 and 1971. His scanner was used to make the first CT images in patients. An affable man, he became a celebrity in the radiology world, recognized as the humble engineer who changed the worldwide practice of medicine forever. The early CT community named the grayscale values in CT images “Hounsfield units” in his honor.
Since that first clinical use, CT has grown ever more sophisticated and versatile. The early years of CT scanner advancements coincided with other technological developments. Those include improvements to precision machining, advanced bearing systems, solid-state x-ray detectors, lasers, semiconductor integration, and composite materials—all of which enabled faster and more precise CT hardware performance. Computers also continued to get faster, and more sophisticated computer algorithms led to improved image quality, which dramatically expanded the commercial CT market. The fields in which CT has been applied are remarkably diverse. Box
Big and small systems
Computed tomography (CT) systems extend far beyond medical applications, from small-specimen imaging systems to huge devices designed for nondestructive testing. At the small end of the spectrum, CT systems can produce images of tiny specimens, from gemstones to fruit flies, at pixel dimensions below 20 nm. At the other extreme, in 2009 government engineers constructed a CT scanner able to evaluate the structure of nuclear warheads, and an aerospace company built a two-story-tall system to scan aerospace components such as rocket assemblies and turbine blades for imperfections.
In more familiar applications, CT scanners are used at airports for scanning the interiors of checked bags. Most specimen and industrial scanners rotate the specimen, rather than the x-ray tube and detector array. That imaging geometry greatly simplifies the mechanical design of the system. For human scanning, however, the x-ray tube and detector array, not the patient, are rotated.
More than 90 million medical CT examinations are now performed each year in the US. The pervasiveness reflects the value of the information that CT provides for both medical diagnosis and treatment planning. The large number is driven by physicians on the front lines of medicine, who order the exams, and not by radiologists, who interpret the CT scans prescribed by their referring physician colleagues.
CT imaging requires some 106–109 x-ray transmission measurements taken around the patient and at positions along the long (
Medical CT imaging uses x-ray energies of about 30 to 150 keV. At those photon energies, Compton scattering dominates x-ray interactions in tissue. Compton scattering depends on electron density
Panel a of figure
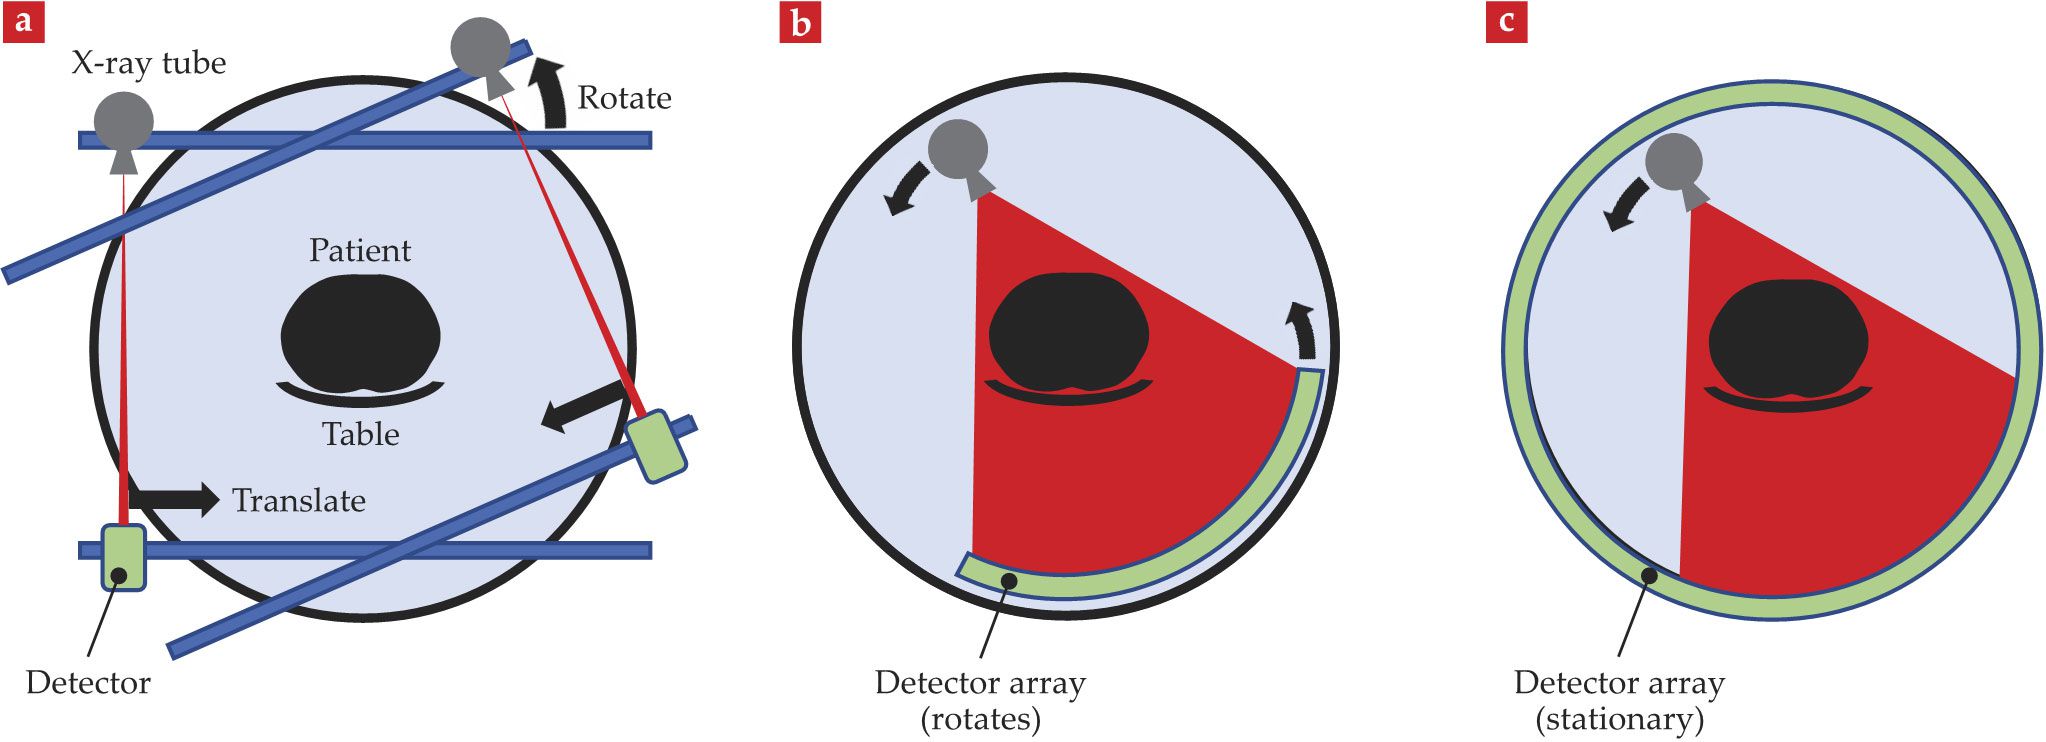
Figure 1.

Computed tomography (CT) has evolved considerably since 1971. (a) In the translate–rotate geometry, the x-ray tube and detector were mounted opposite one another, with the patient’s head placed between them. The tube and detector together translated across the width of the patient’s head in one direction, after which the frame on which they were secured rotated by 1°; the tube and detector were then translated back across the patient’s head in the other direction. Those processes were repeated until the device had rotated 180° around the patient. (b) In the rotate–rotate geometry, an array of detectors sits opposite an x-ray tube that emits a fan-shaped beam. Both the tube and the detectors rotate synchronously around the patient to acquire data. Producing significantly shorter scan times, the geometry is used in all commercial CT scanners today. (c) In the rotate–stationary geometry, the detector was a stationary, ring-shaped array and the fan-shaped x-ray beam rotated around the patient within the detector array. The expensive detector array, less dose-efficient geometry, and limited ability to block scattered radiation led to abandonment of this geometry. (Courtesy of John Boone/University of California, Davis.)
The transmission data were used to produce an 80 pixel × 80 pixel image representing the scanned cross section of the patient via a process known as image reconstruction. The image thickness was determined by the width—either 8 or 13 mm—of the collimated x-ray beam. To image a greater length of the body, the technologist repeated the entire process, one cross section at a time. A complete brain scan consisted of only six images, the acquisition of which took about 30 minutes, during which the patient needed to hold perfectly still. Such long acquisition times initially limited the procedure to imaging of the head, because it could be immobilized.
Despite the long acquisition times, images from the first CT scanners created tremendous excitement among radiologists and other physicians, and their feedback encouraged corporations to invest heavily in the technology’s development. Next-generation scanners incorporated a somewhat wider x-ray beam but used fundamentally the same acquisition process. Third-generation scanners, shown in panel b of figure
After one rotation’s worth of data collection, either using a translate–rotate or rotate–rotate mechanism, the gantry’s rotation was braked to prevent severing the cables that connected the gantry to the stationary frame. In the early 1990s, slip-ring technology was introduced to conduct power and signal to the rotating gantry, eliminating the need to stop gantry rotation and rewind the cables. The slip ring did more than allow the gantry to rotate continuously; it also allowed for helical, or spiral, scanning. In contrast to the sequential acquisition of data for one cross section of the body at a time—during which the patient table was stationary for x-ray exposure—in helical scanning the patient is moved through the rotating gantry while transmission measurements are taken. The result is a helical trajectory of the x-ray source around the patient, which completely eliminated the inertial constraints during the entire patient scan.
As scan times decreased, x-ray tubes needed to produce the same number of photons in a shorter time. The introduction of helical CT thus led to improvements in x-ray tube design to achieve the higher x-ray production rates. But the fundamental physics of heat conduction in the tube’s vacuum environment remained a limitation. In the late 1990s, innovations in detector design helped to address limitations in tube power. Instead of using just one array of detectors, which covered only 10 mm along the patient, researchers developed scanners with multiple detector arrays along the
Having a greater number of thinner detector arrays also improved the spatial resolution along the
Figure 2.

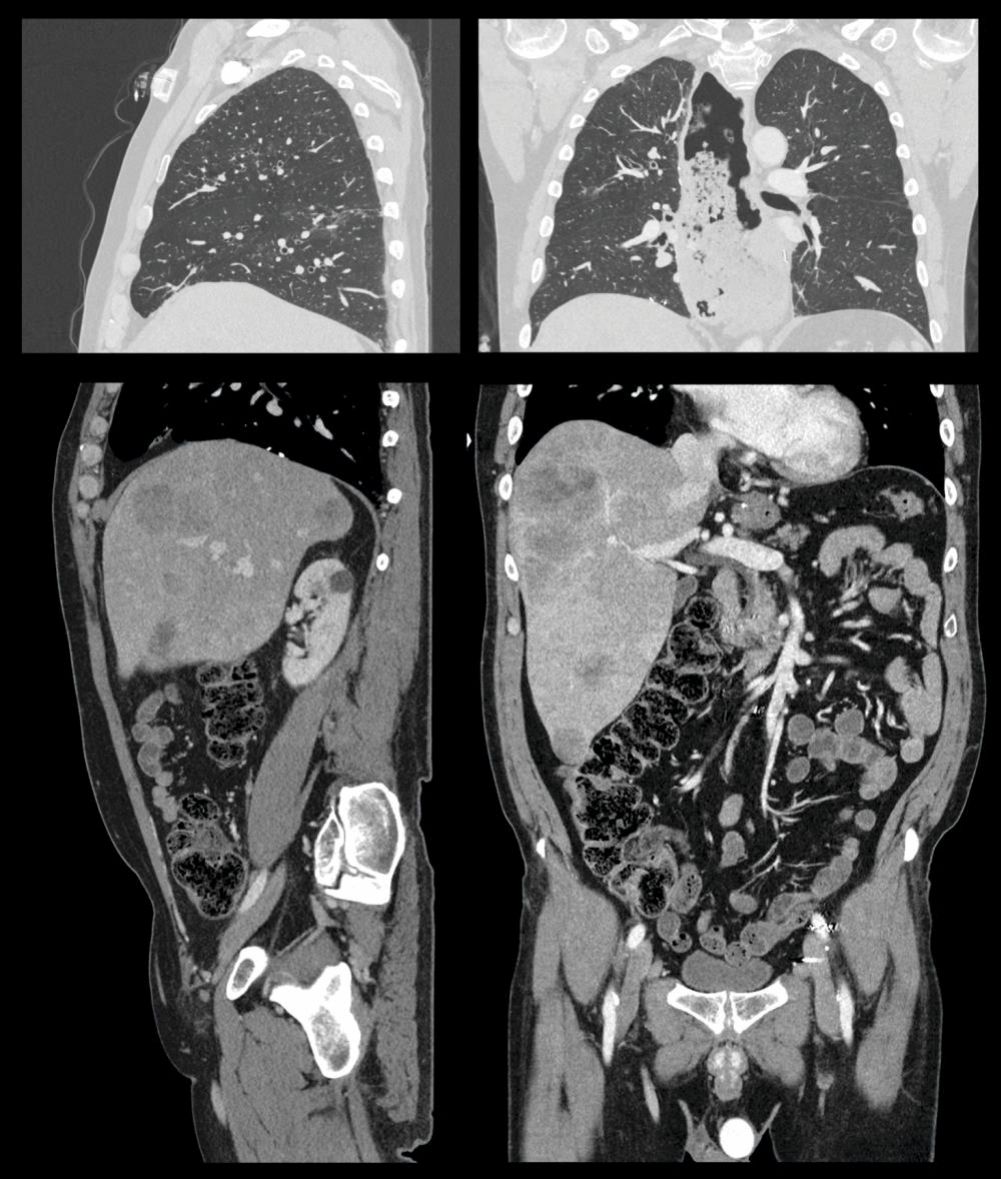
Sagittal and coronal perspectives of the torso. Images of the thorax (top) and abdomen and pelvis (bottom) demonstrate the remarkable clarity with which computed tomography (CT) imaging can depict human anatomy. Excellent contrast between air, tissue, and bone makes CT scans of the lung essential for diagnosing many pulmonary disorders. A vascular contrast agent containing high-atomic-number iodine can be injected to enhance the contrast of soft tissues in the abdomen and pelvis and make blood vessels and cardiac chambers visible. (Courtesy of Canon Medical Systems, USA.)
From projection data to images
Figure
Figure 3.

Filtered back-projection reconstruction. These projection data represent the total x-ray attenuation of an object along a path between the x-ray source and detector. To reconstruct the computed tomography (CT) image, the data are back projected along the direction in which they were acquired. The process uniformly distributes the measured attenuation along the line between the x-ray source and detector. The image shows four data sets at four different projection angles
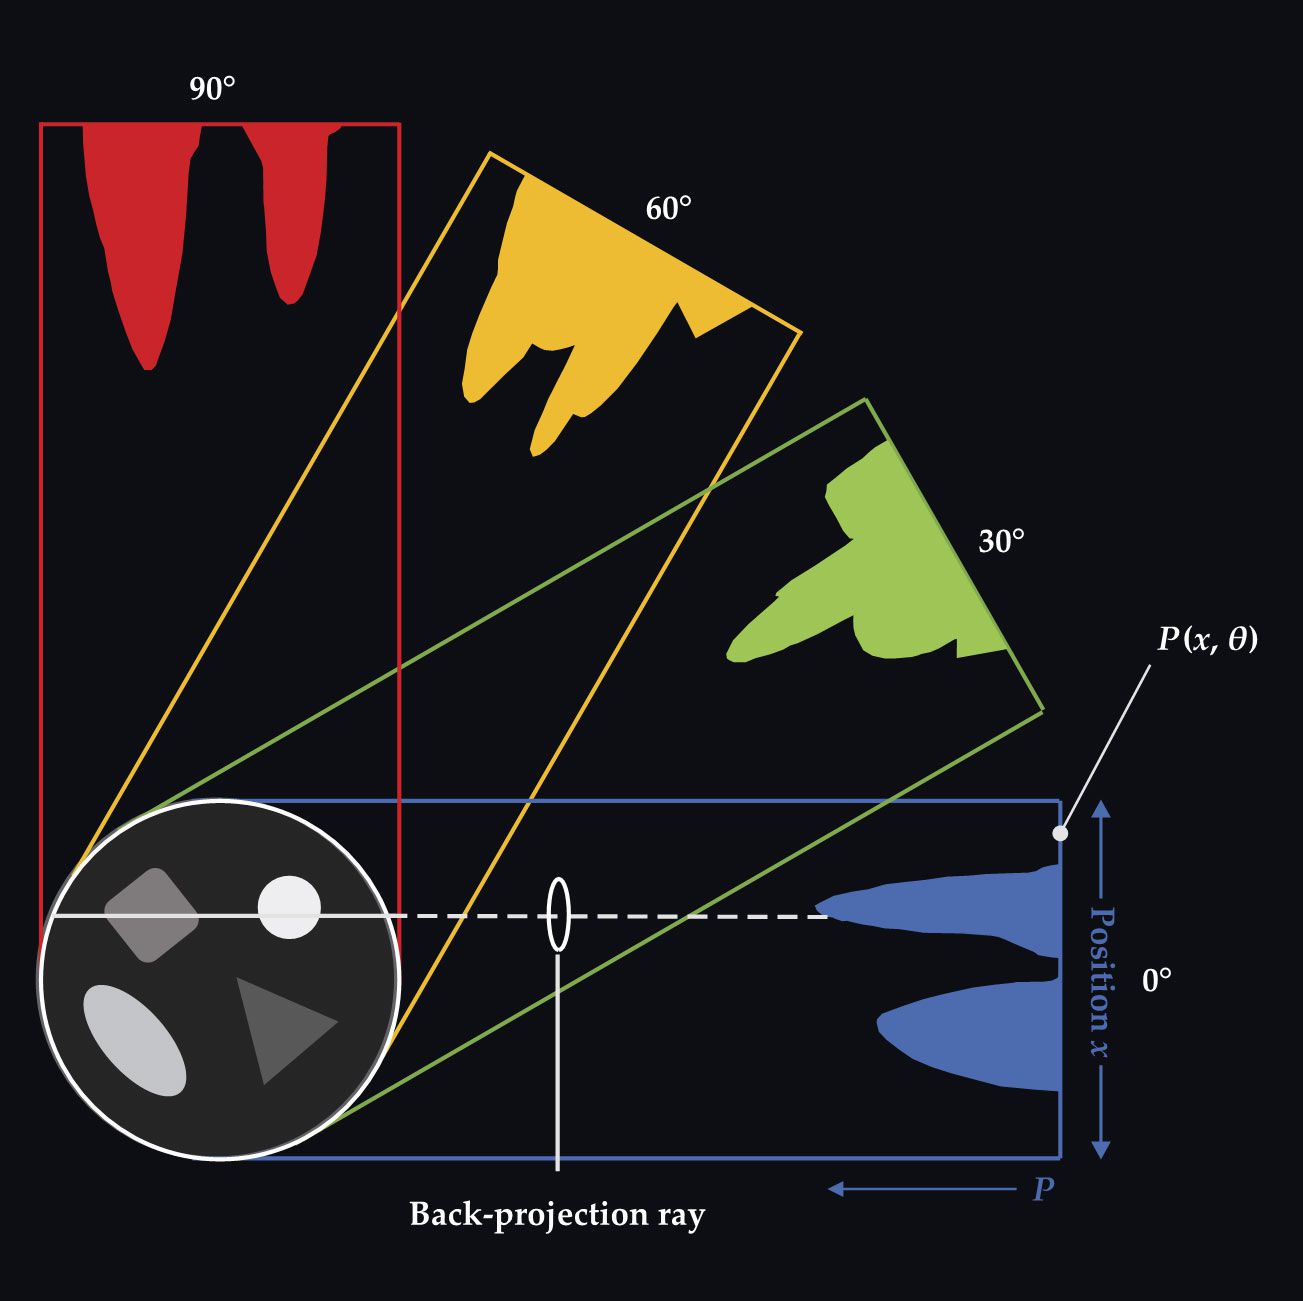
A modern CT scanner may use 1000 angular projections
Figure 4.

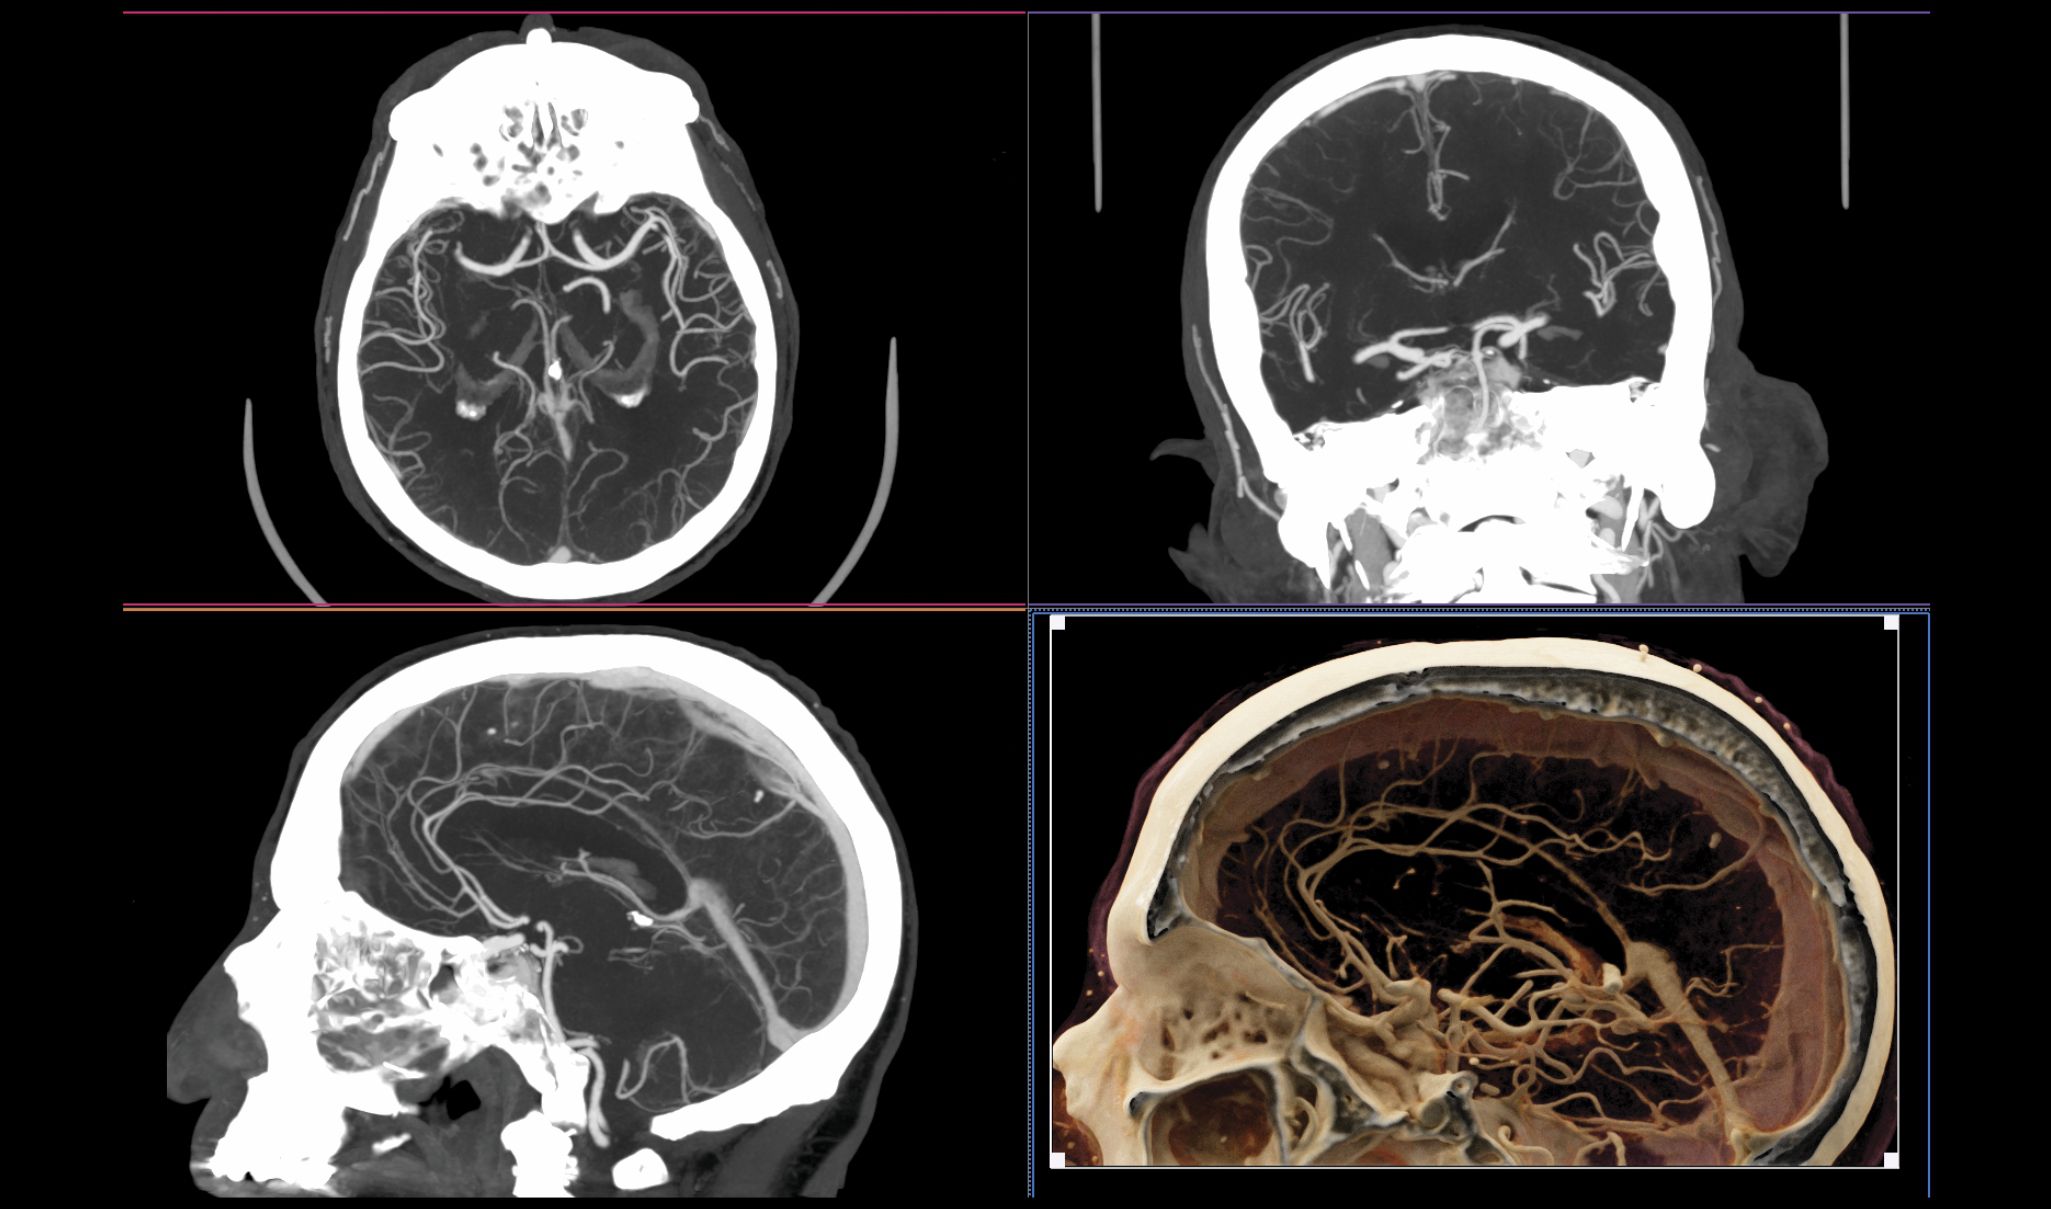
Blood vessels in the brain. Once referred to as CAT (computed axial tomography) scanners because the data were acquired and reconstructed in the axial plane, modern CT systems have submillimeter detector pixels along the
Because of the increasing power of computers over the years, iterative reconstruction (IR) methods are now routinely available. They go beyond filtered back projection to include statistical considerations and a physical model of the CT system to produce images with lower statistical noise. And by reducing image noise during the reconstruction process, physicians can use lower radiation doses. But even with powerful computers, IR methods can still require minutes-to-hours of reconstruction time. That’s unacceptable in a busy radiology department where patients may need immediate attention. Artificial intelligence techniques known as convolutional neural networks (CNNs) have recently become available and in many cases are replacing IR approaches. They are considerably faster to perform and can produce images with better spatial resolution and lower noise levels.
Quantitative imaging
Unlike other imaging modalities in a radiology department, CT scanners produce quantitatively meaningful grayscale images, in which the pixel values are related to
The physical dimensions measured in CT data sets are also quantitatively accurate. That’s a result of the well-defined geometry required in CT, in which all transmission measurements are made along straight lines between the x-ray source and detector elements. Because of that geometry, radiation-based cancer treatments can be accurately planned and performed; biopsy needles can be accurately positioned; and linear, areal, and volumetric measurements can be accurately made. For example, the correct size for a stent to be placed in a patient’s artery can be determined by the measurement of the diameter of the artery on the CT image. The volume of a tumor can be assessed by outlining its 3D boundaries, and a patient’s response to radiation or drug therapy can be deduced by measuring changes in tumor volume over time.
Radiation levels
Imaging with CT provides an amazing look into a patient’s body and can provide lifesaving diagnostic information, but it also involves exposing patients to ionizing radiation, which at high doses is known to produce alterations in DNA that can potentially lead to the development of cancer. Although the relatively low radiation dose levels used in CT can be assessed accurately, the resulting risks are difficult to quantify. That’s because radiation is a relatively weak carcinogen. Hence, epidemiological studies of individuals exposed to the low radiation doses are difficult to perform. They also vary in their conclusions because of numerous uncertainties and different model assumptions; some studies demonstrate a small health benefit, some show no effect, and some exhibit a small health detriment.
What’s more, the effect of a known radiation dose depends upon many factors, including the distribution of dose to different tissues and organs; the timing of repeated exposures; and the patient’s age, sex, race, genetics, and health status, all of which influence the radiobiological impact of an x-ray exposure. 4 For example, because children’s cells are more actively reproducing than the cells of an adult, most organs and tissues of a child would have a higher risk of negative health effects than those of an adult exposed to the same amount of radiation. Fortunately, lower doses of radiation are needed to obtain diagnostic-quality CT images in children, because of their smaller size.
Despite the difficulty in predicting a patient’s exact risk from a CT scan, the amount of radiation used for medical imaging is known to increase a person’s risk of getting cancer by only a small amount compared with the baseline risk of developing cancer. For example, out of 1000 people, about 400 will develop cancer sometime in their lifetime. In contrast, of 1000 patients who receive a CT scan of their chest, abdomen, and pelvis, only one of them might develop cancer from the scan. That same CT scan, however, can provide information critical to the medical care of a patient who is ill or injured. In almost all situations where a physician recommends a CT exam, the potential benefit to the patient far outweighs any potential risk.
Still, radiation can be scary for some patients, and details of scientific studies and statistics can be hard to explain. One helpful approach is to describe potential risks in terms of effective dose. 3 For example, the effective dose from naturally occurring radiation sources, such as radon gas or cosmic rays, in Denver, Colorado, is about 5.2 mSv/year, whereas in San Francisco, it is 3.1 mSv/year. Moving to Denver from San Francisco therefore increases a person’s background radiation exposure by about 2 mSv/year—the equivalent of one head CT scan per year. No one is likely to worry about an increased radiation dose of 2 mSv/year when considering a move to Denver, yet some patients hesitate when they are advised to get even one CT scan. That type of comparison may help patients and their families put the small amount of radiation from a CT scan into perspective. Even when a CT scan is negative, or normal, it can provide physicians with important information about where to turn next.
Clinical implications
The use of CT in caring for patients continues to increase because of its proven medical value in the hands of experienced radiologists. The clinical demand for CT is driven by the modern scanner’s ability to produce exquisitely detailed images of patient anatomy, the wide availability of scanners, and the time required to perform most exams: 5–10 seconds. Recently, two manufacturers developed CT systems that can resolve objects as small as 125–150 microns. 5 The achievement promises further improvements in the imaging of bone, lung, and vascular tissues.
Because CT scans are so fast, image artifacts from patient motion are few, even for pediatric patients, making sedation no longer necessary in most cases. Although special electron-beam CT scanners were built for cardiac imaging in the past, 6 modern CT systems can routinely image the heart using cardiac-gating techniques. 3 Some CT scanners can also perform multi-energy imaging, in which projection data acquired at different x-ray effective energies can be processed to isolate specific materials, 7 such as the organic crystals that cause gout; identify different classes of kidney stones; and differentiate different types of arterial plaque. Relatively low-cost cone-beam CT scanners have also emerged in recent years for highly specialized clinical applications, such as breast, 8 orthopedic, 9 and dental imaging. 10
The value of CT imaging to medicine and many other disciplines has exceeded even the high expectations of Hounsfield and other CT pioneers. Now, 50 years after its introduction to clinical medicine, CT is an essential tool of modern medicine—a stethoscope on steroids. Indeed, in a survey of leading US physicians, CT, along with magnetic resonance imaging, was ranked as the most important medical innovation of the 20th century. 11 To celebrate CT’s birthday, millions of patients whose lives have been improved by its diagnostic and treatment-planning capabilities can raise a glass to a technology that makes the unseen visible. And the generations of CT scientists and physicians who have contributed to CT’s technological development can enjoy a well-deserved pat on the back.
References
1. G. N. Hounsfield, Br. J. Radiol. 46, 1016 (1973). https://doi.org/10.1259/0007-1285-46-552-1016
2. J. Ambrose, Br. J. Radiol. 46, 1023 (1973). https://doi.org/10.1259/0007-1285-46-552-1023
3. J. T. Bushberg et al., The Essential Physics of Medical Imaging, 4th ed., Wolters Kluwer Health (2020).
4. J. M. Boone et al., Radiology 265, 544 (2012). https://doi.org/10.1148/radiol.12112201
5. A. M. Hernandez et al., Med. Phys. 48, 2760 (2021); https://doi.org/10.1002/mp.14789
S. Leng et al., Radiographics 39, 729 (2019). https://doi.org/10.1148/rg.20191801156. M. J. Lipton et al., Radiology 152, 579 (1984). https://doi.org/10.1148/radiology.152.3.6540463
7. T. R. C. Johnson, AJR, Am. J. Roentgenol. 199, S3 (2012).
8. J. M. Boone et al., Radiology 221, 657 (2001). https://doi.org/10.1148/radiol.2213010334
9. Q. Cao et al., Med. Phys. 45, 114 (2018). https://doi.org/10.1002/mp.12654
10. W. C. Scarfe, A. G. Farman, P. Sukovic, J. Can. Dent. Assoc. 72, 75 (2006).
11. V. R. Fuchs, H. C. Sox Jr, Health Aff. 20, 30 (2001). https://doi.org/10.1377/hlthaff.20.5.30
12. G. N. Hounsfield, “Computed medical imaging,” Nobel lecture presented at Karolinksa Institute, Stockholm, 8 December 1979;
A. M. Cormack, “Early two-dimensional reconstruction and recent topics stemming from it,” Nobel lecture presented at Karolinksa Institute, Stockholm, 8 December 1979.13. A. M. Cormack, J. Appl. Phys. 34, 2722 (1963). https://doi.org/10.1063/1.1729798
14. A. M. Cormack, J. Appl. Phys. 35, 2908 (1964). https://doi.org/10.1063/1.1713127
More about the authors
John Boone is a professor of radiology and biomedical engineering at the University of California, Davis. Cynthia McCollough is the Brooks-Hollern Professor and a professor of medical physics and biomedical engineering at the Mayo Clinic in Rochester, Minnesota.


