X-ray outburst reveals a supernova before it explodes
DOI: 10.1063/1.2970204
Core-collapse supernovae are attributed to a sequence of cataclysmic events presumed to follow from the exhaustion of the fusion fuel in the core of a star at least eight times more massive than the Sun: When the outward thermal and radiation pressure from exothermic nuclear fusion no longer balances the gravitational crush of the star’s outer layers, the core suddenly collapses. The rebound from the collapse propels a shock wave outward through the star as a prelude to the eventual ejection of most of the star’s material. Only a remnant neutron star—or a black hole—is left behind. The signature supernova light that first appears about a day later is eventually dominated, after weeks or months, by incandescence of the ejecta heated by the decay of radioactive nickel-56 created in the explosion.
The broad outlines of this scenario are supported by extensive observations of various spectroscopic classes of core-collapse supernovae at wavelengths ranging from radio to x ray. But until now, the data-taking has mostly begun only when the supernova had become optically bright, days after the core collapse. Such delay has left many details unclarified, progenitor stars unidentified, and theoretical presumptions unverified.
But now, by happy accident, Princeton University astronomers Alicia Soderberg and Edo Berger have observed an extremely luminous x-ray outburst manifesting the breakout of the rebound shock wave from the surface of a doomed progenitor star. 1 That serendipitous find allowed teams of observers to follow the ensuing supernova (labeled SN 2008D) almost continuously, in unprecedented detail, from just minutes after its core collapse to its radio afterglow months later.
Such a prompt supernova signal had been predicted 40 years ago by Stirling Colgate, but never seen until now. An x-ray outburst was seen in conjunction with a gamma-ray burst that heralded a 2006 supernova. But the character of that x-ray signal seems to have been peculiar to GRBs, which are generated by ultrarelativistic, highly collimated jets of ejecta produced by less than 1% of all core collapses. 2
Analysis of the SN 2008D observations largely confirms the prevailing theory of core-collapse supernovae. In particular, it provides the first direct verification of the presumption that the progenitors of core-collapse supernovae without hydrogen spectral lines (SN types Ib and Ic) are Wolf-Rayet stars—compact stars born with a mass of at least 20 solar masses M ⊙ whose strong stellar winds have denuded them of their hydrogen envelopes. Furthermore, comparison of SN 2008D’s radio afterglow with its x-ray outburst indicates that the progenitor’s wind had remained quite steady for several years, showing on its deathbed none of the hiccups that Wolf-Rayet stars sometimes exhibit late in life.
The Soderberg-Berger supernova turned out to be a type Ib—that is, one whose spectrum indicates that the progenitor’s helium layer, unlike the outer hydrogen layer, was still largely intact when the core collapsed. 3 The more common type II supernovae, whose spectra do show hydrogen lines, are known to result from the core collapse of much larger stars—typically red supergiants—with hydrogen envelopes intact. Type II core collapses seem never to produce GRBs. And their shock breakouts are expected to generate longer, less spectacular outbursts of lower-energy x-ray and UV photons than the stripped progenitors.
The accidental discovery of SN 2008D’s x-ray burst suggests that a dedicated x-ray satellite monitoring the whole sky would find something like 100 core-collapse supernovae per year at the moment of their birth. Such abundant data would help answer remaining questions. What, for example, determines whether the core collapse of a stripped progenitor will generate a GRB? And beyond the usual precincts of astrophysics, the regular availability of prompt x-ray bursts as “time stamps” of core collapse, as Berger calls them, promises to assist those who use gravity-wave detectors or neutrino telescopes in extracting real signals from obscuring background noise.
Serendipity
On 9 January of this year, Soderberg and Berger accidentally came upon the x-ray burst that heralded SN 2008D while revisiting another core-collapse supernova (SN 2007uy) that had appeared just two weeks earlier in the same spiral galaxy—NGC 2770, 90 million light-years from the Milky Way. Considering that such a galaxy typically hosts only a few supernovae per century, so rapid a succession is itself quite a coincidence. Add to that the good fortune that the outburst, lasting only a few minutes (see figure 1), happened to occur during one of a few optical, UV, and x-ray exposures of NGC 2770 that Soderberg had prearranged for NASA’s Swift orbiter to take that week.

Figure 1. The abrupt rise and fall of the x-ray pulse serendipitously recorded on 9 January 2008 by the x-ray telescope aboard the Swift orbiter at the site of a supernova (SN 2008D) that would not become visible at optical wavelengths for another day or so. The curve is a fit with a linear rise followed by an exponential decay.
(Adapted from ref. 1.)
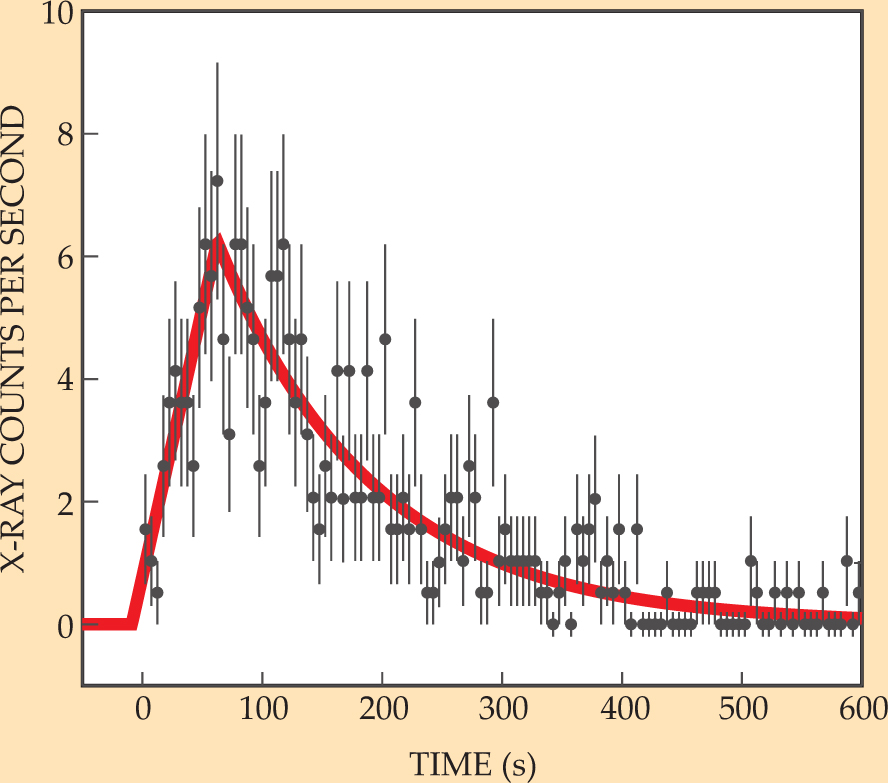
Figure 2(a) shows Swift’s x-ray and UV exposures of the galaxy on 7 January. At the position of the two-week-old SN 2007uy, there’s a very faint x-ray afterglow. But its UV image is still bright. At the position of the yet unborn SN 2008D, there’s nothing to be seen.

Figure 2. X-ray and UV exposures of the host galaxy of last December’s supernova SN 2007uy taken by telescopes aboard Swift. The exposures in (a), recorded two days before the x-ray outburst shown in figure
(Adapted from ref. 1.)
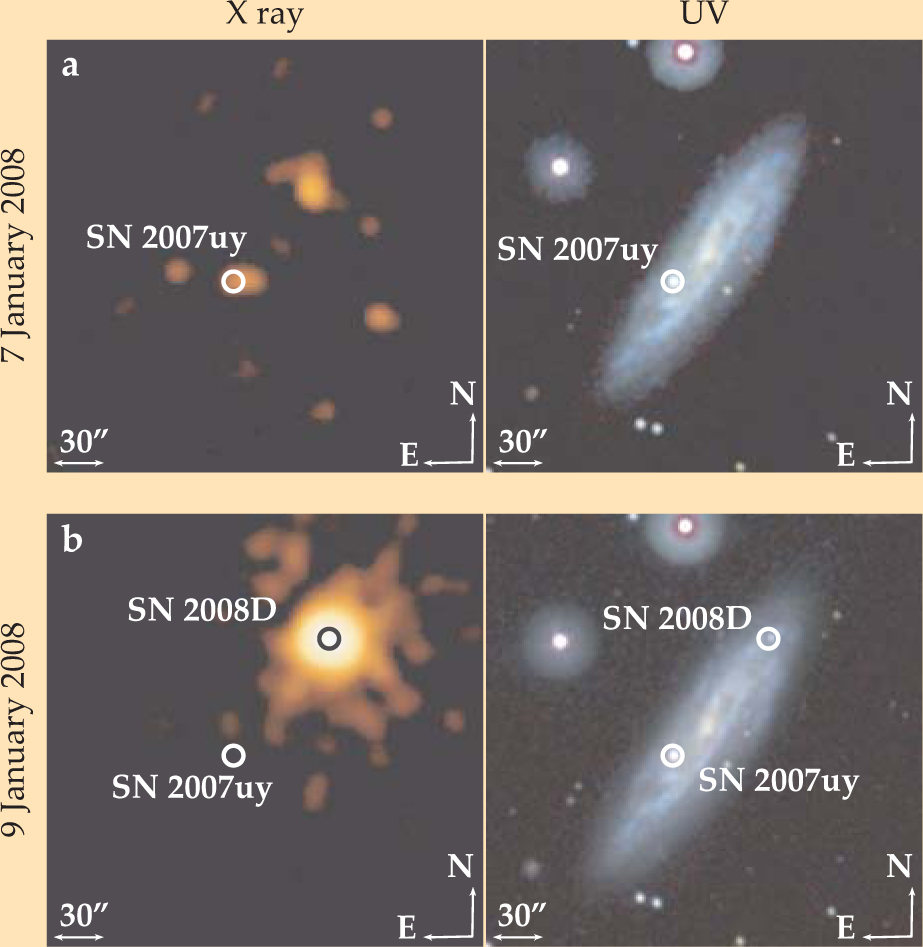
While Swift’s x-ray telescope (XRT) was looking again two days later, the short, intense x-ray outburst suddenly appeared halfway across the galaxy (left panel of figure
About an hour after that, the two Princeton astronomers became aware of their extraordinary catch when Berger downloaded the last few hours of Swift observations. They couldn’t go back immediately for another look, because Swift, on its fixed schedule, had already shifted its gaze away from the eventful galaxy. But they could, and did, promptly alert a network of ground-based telescopes. Soderberg quickly organized a worldwide collaboration, including Swift’s lead scientist, Neil Gehrels. She asked Gehrels to re-point the UVOT back to NGC 2770 at the earliest possible moment.
So, after a 36-hour hiatus, Swift began monitoring the new supernova at eight different UV and optical wavelengths almost daily for the next two months. The resultant light curve shown in figure 3 plots the waxing and waning of the light intensity summed over the whole range of observed wavelengths.

Figure 3. The light curve of supernova SN 2008D for two months following its initial x-ray outburst is effectively the total light intensity measured by Swift over the wavelength range of its eight UV and optical filters. The solid curve, showing a model fit to the data at each wavelength, has two components yielding two separate peaks: The dashed green curve is blackbody radiation from the shock-heated stellar envelope as it expands and cools. And the dashed orange curve is incandescence from heating of the star’s ejecta by decay of the radioactive nickel-56 produced in the explosion. After about a month, the observations fall between the 56Ni curve and the solid curve that indicates what one would see if 100% of the subsequent decay energy of cobalt-56, the radioactive daughter of 56Ni, went to heating the ejecta.
(Adapted from ref. 1.)
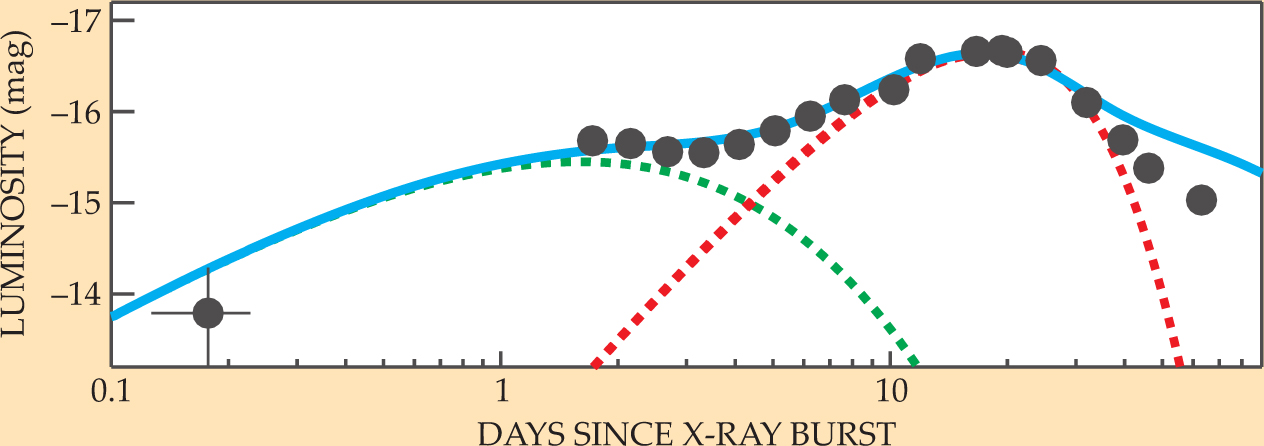
The light curve appears to have two peaks. Detailed model fitting by the Soderberg collaboration to the data at each wavelength attributes the first peak, about two days after the x-ray outburst, to the maximum of blackbody radiation from the expansion and cooling of the stellar envelope originally heated by the shock wave. The brighter second peak, two weeks later, is attributed to maximum heating of the supernova’s ejecta by the decay of about 0.1 M ⊙ of 56 Ni created in the explosion.
Other observations
In addition to the coaligned narrow-field UVOT and XRT instruments, Swift also carries a wide-field GRB-alert telescope called BAT. Indeed the primary purpose of Swift when it was launched late in 2004 was to respond swiftly to a GRB, only roughly localized by BAT, by slewing its orientation so that the UVOT or XRT could quickly pinpoint the source for detailed followup by much larger telescopes (see Physics Today, November 2005, page 17 ). Although SN 2008D was well within BAT’s field of view at the time of the x-ray outburst, the instrument recorded no gamma signal. That argues for a run-of-the-mill core collapse rather than one of those rare exotics that begets a GRB.
An important role of the largest ground telescopes was to monitor SN 2008D’s evolving spectrum as the thinning envelope of ejecta allowed increasing optical access to the supernova’s innards. At the end of April, when the supernova had been dimming for three months, an independent collaboration led by Maryam Modjaz (University of California, Berkeley) used the 10-m Keck telescope in Hawaii to discover a spectral feature which convinced them that the supernova explosion had been significantly aspherical. 3 A faint oxygen emission line revealed a two-pronged Doppler structure suggesting that the oxygen layer surrounding the progenitor’s core had been blown off in a toroidal rather than spherical shape. But there was no evidence of the extreme asphericity associated with GRBs.
The supernova’s radio afterglow is synchrotron radiation from electrons accelerated by the star’s fastest ejecta—with speeds of order 105 km/s. Thus the radio-telescope data probe precincts much farther out than the bulk of the oxygen ejecta. “Out there,” says Soderberg, our VLBA [Very Large Baseline Array] radio data, which profile the fast ejecta with fine resolution, reveal a perfectly spherical explosion.”
Because the fastest ejecta quickly catch up with slower-moving winds that the star emitted several years earlier, the synchrotron radiation they generate serves to measure the star’s mass loss over that extended period. “Analyzing the radio data,” says Berger, “we find an intense but steady mass-loss rate over the last three years that’s about the same as the rate in the star’s final quiet hours, which we calculate from the x-ray outburst.”
The outburst
Ordinarily one would expect the shock-wave breakout from the surface of a Wolf-Rayet star with a typical radius of 5–10 solar radii R Q to generate an x-ray outburst lasting roughly 10 seconds rather than the hundreds of seconds seen in figure 1. Soderberg and company attribute the burst’s overlong duration to the dense envelope of stellar wind, which, they estimate, had been steadily relieving the star of 10−5 M ⊙ per year. The brief outburst’s spectral data can accommodate either a power-law or blackbody fit. Concluding that a non-thermal power law yields the better fit, the group argues that the XRT, whose low-energy cutoff is 0.2 keV, was seeing thermal UV photons Compton-scattered up to x-ray energies by the semirelativistic shock wave.
Also looking at the SN 2008D data, theorists Roger Chevalier (University of Virginia) and Claes Fransson (Stockholm University) prefer a thermal blackbody fit for the breakout x-ray spectrum, which would transform smoothly into the observed UV and optical blackbody spectra as the expanding photosphere cools. 2 Chevalier has for decades been elaborating on Colgate’s prediction of shock-breakout radiation. One can deduce the effective surface area of a celestial object of known distance from the brightness and color temperature of its blackbody radiation. Extrapolating back from the early UV and optical data, the Soderberg collaboration concluded that the progenitor star has a radius of about 1 R ⊙.
“That would still be a Wolf-Rayet star, “says Chevalier, “but an atypically small one. And it’s hard to reconcile with the duration of the x-ray outburst.” Treating the outburst spectrum as the supernova’s earliest blackbody data and including subtle radiative-diffusion effects in their modeling of the UV and optical data, he and Fransson arrive at a progenitor radius closer to 10 R ⊙.
Do all type Ib and Ic supernovae produce x-ray outbursts at shock breakout? Arguing for the affirmative, Soderberg and company calculate that if it is true, Swifts XRT had roughly a 50–50 chance of recording one in the years since its launch.
It turns out that the Modjaz collaboration also played a serendipitous role in the early optical and IR observation of SN 2008D. They too were keeping tabs on its December predecessor, using two small automated telescopes on Mount Hopkins in Arizona. In the process, they happened to record IR and optical images of the new supernova as early as 17 hours after the x-ray outburst, thus partially filling the early 36-hour gap in the Swift UVOT observations. And the team’s previous exposures, showing nothing new at the site just a few hours before the outburst, provide the best upper limits on any last-minute prenatal displays.
References
1. A. M. Soderberg et al., Nature 453, 469 (2008).https://doi.org/NATUAS
10.1038/nature06997 2. R. A. Chevalier, C. Fransson, http://arxiv.org/abs/0806.0371 .
3. M. Modjaz et al., http://arxiv.org/abs/0805.2201 .


